
Abstract
This paper is concerned with a theoretical and experimental verification of a micromechanical model of newly developed sandwich panels denoted as 3D integrated woven sandwich composite panels. The integrated hollow core was made of a pile of 3D bars with a special configuration. Integrated woven sandwich composite panels consist of two fabric faces which were interwoven by pile fibers and therefore a very high skin core debonding resistance was obtained. With the objective of qualifying the mechanical properties of these structures, fairly extensive experimental research was carried out by investigators. Although some numerical methods have been developed to predict the mechanical behaviors of these structures, there are less analytical models in this area. Due to the computational difficulties and the time consuming nature of the finite element method, in the present study, a new micromechanics analytical model has been suggested for predicting the compressive strength of integrated woven sandwich composites. In order to evaluate the proposed model, fabricated samples with different pile heights and pile distribution densities were subjected to flatwise compression tests. The results show that compressive properties of integrated woven sandwich composite panels are decreased with the increase of core heights and increased greatly with that of the pile density. Furthermore, the micromechanics model reasonably predicted the compression strength, and there is a good agreement between the experimental data and model predictions.
Introduction
Over the past several decades, special attention has been given to reinforcement of composites with different methods [1–6]. To eliminate delamination which is the common weakness of conventional sandwich panels, a modified face-to-face velvet weaving machine was used to produce a new 3D integrated woven sandwich composite (IWSC) [7]. Three-dimensional IWSCs consist of two woven fabric faces and an integrated hollow core. These two parallel faces are bonded together using pile yarns which keep a defined distance between the top and bottom skins to form an integrated hollow core and woven into the deck layers, thus forming integrated woven sandwich (or spacer) composites [8–10]. The use of IWSC panels in manufacturing of sandwich composites has presented a new concept on this topic. This sandwich structure has the following advantages: (1) sandwich panel can be produced in a single step, and production time and costs are reduced; (2) top and bottom skins are integrally woven together with the core section, therefore the problem of skin-core delamination is solved; (3) the hollow core section can be filled by several materials and, thus, different capabilities can be given to structure [10]. The 3D IWSC panels provide high strength, low weight, thermal insulation, acoustic damping and high skin-core debonding resistance which is attractive for lightweight structures and have been increasingly used in industries such as marine, road and rail transport, automotive and aircraft industry, war industry, building and construction [9,11].
In order to characterise the mechanical properties, a significant number of works have been carried out to investigate the compressive behavior of IWSC panels [12–18]. For example, compression tests were conducted by Bannister et al. [12] on the foam and un-foamed IWSC panels. Their results show that the compression performance of foam-filled panels is noticeably improved. Van Vuure et al. [13] experimentally investigated the flatwise compression and shear properties of foamed and un-foamed IWSC panels with various core structures and showed that in order to obtain sufficient mechanical properties, foaming was indispensable for panels with a thickness of over 15 mm. Moreover, they concluded that acceptable mechanical properties can be obtained by a lower degree of pile stretching, high pile density and foam filling.
The high strain rate (HSR) response of IWSC panels with and without additional face sheets was obtained by Hosur et al. [14] using a split Hopkinson pressure set up. Mechanical characteristics and damage modes of the IWSC were investigated by Li et al. [15] under different load conditions and structural factors. Fan et al. [16] studied the deformation and energy absorption of IWSC panels under quasi-static compression tests. They showed that the compression induced shear deformation and load–displacement curves were featured by a long deformation plateau and densification after initial buckling failure. The influence of the different foam density and core thickness on quasi-static properties was investigated by Karahan et al. [17] under flatwise compression tests. They showed that foam-filled IWSC panels had better compression properties in comparison with conventional foamed sandwich structures. Macro-fracture morphology and scanning electron microscopy micrographs of IWSC panels have been examined by Zhao et al. [18] to understand the deformation and failure mechanisms. They expressed that for flatwise compression, three different failure mechanisms have been obtained for various core heights. For thinner cores (5 mm and 10 mm), the rigid breakage of core fiber and for medium core heights (15 mm and 20 mm), buckling of the core fibers were the main failure modes. For higher cores (25 mm and 30 mm), failure occurred in the middle of the “8”-shaped core.
Also, in order to predict the mechanical properties of IWSC panels, a number of researchers [19–22] provided numerical approaches based on the finite element (FE) method. Van Vuure et al. [19] found out a unit cell of this sandwich panel by simulating the shape of the pile and the resin distribution inside the unit cell. They performed a detailed modelling using a linear elastic FE analysis. Their model at higher resin contents and for the prediction of compressive modulus and shear modulus in the weft direction was less accurate. Cao et al. [20] investigated the influence of elastic modulus, pile height and density on the compression properties of IWSC panels using ANSYS software. Other researchers used the numerical approach to predict the experimental results in their works and focused on optimising the weaknesses of the previous numerical works to a certain extent [21,22]. Bardella and Genna [23] reduced the foam-filled IWSC panel to a simplified standard three-layered sandwich in which each layer can be assumed as homogeneous and employed homogenisation techniques to compute the elastic moduli of the skins and foam-filled core.
As shown above, in order to characterise the compressive mechanical properties of the IWSC panels, a considerable volume of experimental and numerical investigations were conducted by researchers. Due to the unique structure, the conventional sandwich theory cannot be applied for analysis of mechanical properties. Therefore, there is less focus on the analytical approaches. Due to the computational difficulties and time-consuming nature of the FE method, in the present study, a new micromechanics analytical model has been suggested for predicting the compressive strength of IWSCs.
Problem definition
Based on the previous research results [17,18,24,25], compressive load–displacement behavior of an IWSC panel has three distinctive stages as shown in Figure 1. These stages are: (1) elastic region, in which the overall behavior of the sandwich panel is linear up to the first maximum load; (2) after the maximum load, the curve declines dramatically as a result of pile buckling and a plateau behavior occurs in which the rate of force at this stage is almost constant; and (3) densification stage where the load increases rapidly as a result of compaction of tilted piles. Although the two last steps are slightly different in panels with different thicknesses, it is clear that after the elastic stages, a significant decrease in compression strength occurs. Hence, the ultimate strength is theoretically calculated using the maximum load in the elastic stage [18]. Therefore, a model that enables predicting the maximum load in the elastic stage is the main strategy of the present study. In this model, fundamental assumptions and principles are as follows:
Pile yarn has a complete linear behavior in the elastic stage up to peak load. Since failure does not occur in the face sheets, core section plays the main role. Piles fixed points at the upper and lower face sheets are in the same z-plane along the weft direction and there is no tilting in the “8”-shaped piles. Typical load–displacement behavior of an IWSC panel with thickness of 29 mm under flatwise compression test in the present study.

Modelling procedure and geometric framework
The major goal of the present paper is to define the strength of IWSC panels under the vertical compressive loads. The response of the panel is defined through a homogenisation process. Hence, the micromechanical process includes a procedure to define a typical volume unit and the analysis of a 3D typical bar.
The flow diagram of the process in the current model is portrayed in Figure 2. The first action is the definition of the representative volume element (RVE). Based on the assumptions mentioned before, as in the flatwise compression test, only piles carry the load. Thus, the RVE consists of a single pile. Then, the pile is divided into several segments that are called sub-elements. All of these sub-elements can be considered as a unidirectional composite in their local coordinate system, which can be related to the global coordinate system by a rotation matrix. The process is continued by calculation of the stiffness and compliance matrices of sub-elements, which are considered as unidirectional composites in their local coordinate system. After predicting the local stiffness matrix of the sub-elements, the strength of the IWSC panel will be calculated. Finally, the deflection of the pile is calculated and thus the stiffness of the pile is determined.
The general schema of the homogenization method.
Analytical model (modelling procedure)
RVE selection
Figure 3 shows the schematic representation of an IWSC panel. The structure consists of three distinct layers; two face sheets with plain weave fabrics that are integrally connected to each other by means of a core of vertically piled yarns. The pile yarns are connected to the face sheet in the warp direction and can be seen in the form of the “8” shape, and in the weft direction, they resemble the “c” shape, which represents the anisotropic behavior of this structure.
(a, b) Warp and weft cross-sectional view of the IWSC specimen. (c to h) Definition of the RVE.
The first step in developing a micromechanical model is the definition of the RVE. Based on the aforesaid assumptions, in the flatwise compression test, only piles carry the load and the face sheets are not involved. Thus, the RVE consists of a single pile. The selection process of the RVE used in this study is shown in Figure 3.
Determining the transformation matrices
Description of the pile geometry is the most important step of developing a micromechanical model. Figure 3(f) shows a schematic of a single pile geometry in the xyz coordinate system. As shown in Figure 3(g) and (h), the shape of the pile in both warp (xz plane) and weft (yz plane) directions are like a sine function. With the help of the relations proposed by Van Vuure et al. [19], the shape functions for the pile in the warp and weft directions are a function of z and can be expressed by equations (1) and (2):


It is clear that the curve length of the pile is calculated from the following equation. So, Ds or Csare obtained:


In equation (4), L is the pile length and it is a known weaving parameter; t is the faces thickness and c is the core thickness.
In the next step, the pile is divided into several segments that are called sub-elements. This task is done by dividing the height of the pile in z direction into N parts. Then coordinates of x and y of the pile are calculated from equations (1) and (2). So, N + 1 points and N sub-elements are formed. All of these sub-elements can be considered as a unidirectional composite in their local coordinate system, which can be related to the global coordinate system by a rotation matrix (see Figure 4).
Schema of discretization steps.
In order to calculate the rotation matrix, a sub-element is considered. As shown in Figure 5, β is the angle between the sub-element and xy plane and α is the angle between projection of the sub-element into xy plane and z direction. These angles are calculated by equations (7) and (8) for each sub-element.
Definition of rotation angles α and β and rotation axes.


As shown in Figure 5, transformation of the local coordinate system into the global coordinate system is done by two consecutive rotations; first, α radian about z axis and, second, β radian about the new y axis (
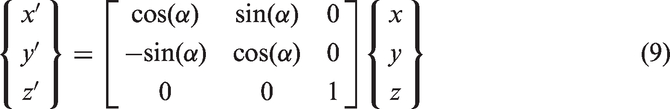
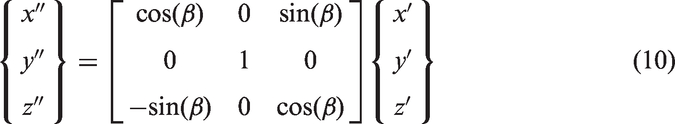
So, for the first and second rotation matrices, L1 and L2 can be defined by the following equations:


Calculation of stiffness and compliance matrices
The micromechanical modelling is continued by calculating the stiffness and compliance matrices of sub-elements, which are considered as unidirectional composites in their local coordinate system. Calculation of the compliance matrix of the unidirectional composite is done by bridging the micromechanical model developed by Huang [26].
According to the bridging micromechanical model [26], stress in the matrix can be related to fiber stress by using a bridging matrix [A] (equation (13)).


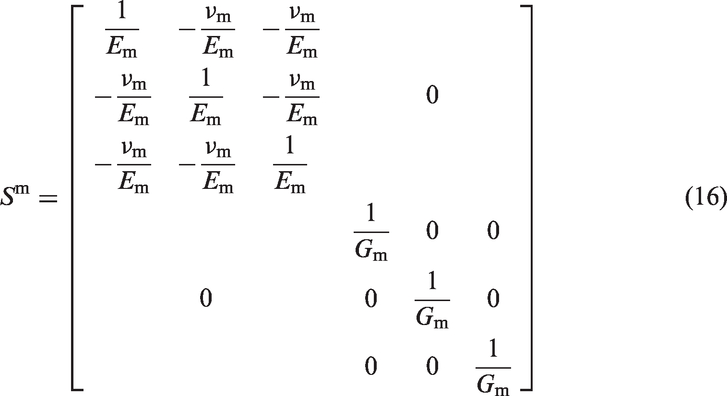
Generally, the bridging matrix has the following form:

Non-zero components of this matrix are calculated using equations (18) to (21).

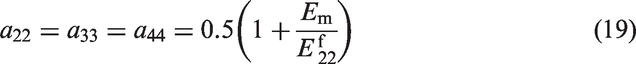


In the above equations,
Stress analysis
For stress analysis, it is assumed that the global force

Equations (23) and (24) are used for transformation of force and moment vectors in the local coordinate system in the kth sub-element.


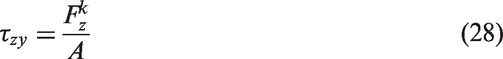

Since the stress tensor is calculated in the local coordinate system, it is possible to determine the fiber and matrix stresses in each sub-element. Equations (30) to (32) are used for this purpose.


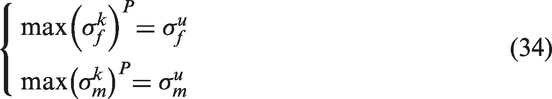
For prediction of pile strength, it is assumed that the pile failure occurs when the maximum principal stresses of the fiber or matrix in the pile reaches the strength of the fiber or matrix (equation (34)).
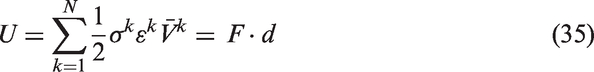
For calculation of the maximum deflection of the pile, it is assumed that all the work done by the testing machine on the specimen is converted to the elastic energy in the pile. Thus, the maximum deflection of the pile is obtained from equation (35).

Experimental assessment of the present model
In order to validate the present model, a number of flatwise compression tests were performed and the empirical results were compared with the model outputs. The influences of the core thickness (pile length) and pile distribution density were studied.
Materials
In this study, 3D integrated woven fabrics are produced by a modified large-scale textile face-to-face carpet weaving machine. Two bi-directional woven fabrics as face sheets are connected with vertical piles. Samples with three different thickness and three different pile distribution densities were produced. The linear density of the pile yarn, which would affect the thickness of the individual piles, was not varied. Other weaving parameters are fixed and were not changed.
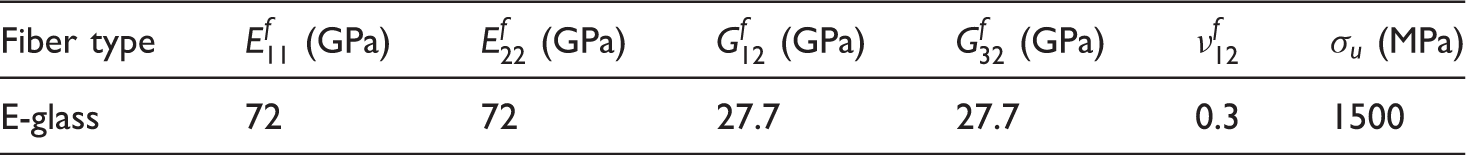
All warp, weft and pile yarns consist of type E-glass fibers with linear density of 600 tex (Syna Fibre Delijan Co., Iran). In the next step, the prepared preforms are impregnated with diglycidyl ether of bisphenol F epoxy resin (ML-506) and hardener (HA-11) (Mokarrar Engineering Materials Co., Iran) by the hand lay-up process. The mould was first polished with releasing agent, then about 40% of resin was applied on the mould evenly and the fabric was placed over it. After the resin impregnated the fabric, the remaining 60% of the resin was applied over the top face sheet. The adopted resin weight fraction of the final panel was kept at about 55%. Special care was taken to control the ambient temperature and viscosity of resin to ensure that resin has been thoroughly and evenly distributed within the preform. The produced panels were kept in ambient temperature for 24 h to complete the curing process.
After curing, the samples were cut to the dimensions required for flatwise compression test by the water jet machine. Figure 6 shows the schematic view of the produced panels. The detailed information of glass fiber and resin which are provided by the mentioned manufactures are summarised in Tables 1 and 2, respectively.
(a) Cross-sectional view of panels and (b) typical IWSC panels. The mechanical properties of fiber. The mechanical properties of resin.

Test procedure
The flatwise compression behavior of IWSC panels in the thickness direction were determined by the ASTM C-365 test method. Experiments were carried out on the Instron tensile testing machine (Model 5566). Samples were used in the form of a square with the side length of 70 mm. The load–displacement data for all samples have been collected automatically by a computer. The compressive samples are loaded at a constant crosshead displacement of 0.5 mm/min based on ASTM C-365 test method. At least three specimens of each panel were tested and the mean values of experimental results were calculated.
The inclined form of pile yarns causes the shear deformation and sliding of the upper face sheet when the specimen is under compression load. Hence, as there is some friction between the upper grip of the Instron machine and the upper face sheets, the results are friction-dependent. In order to prevent any sliding in the upper skin during the test, face sheets were fixed on the loading plate [17]. Figure 7(a) depicts the experimental procedure view of the specimen at the elastic stage and Figure 7(b) shows the deformed shape of sample at the end of the test (densification stage).
Deformation of piles during compression test: (a) elastic deformation and (b) densification at the end of test.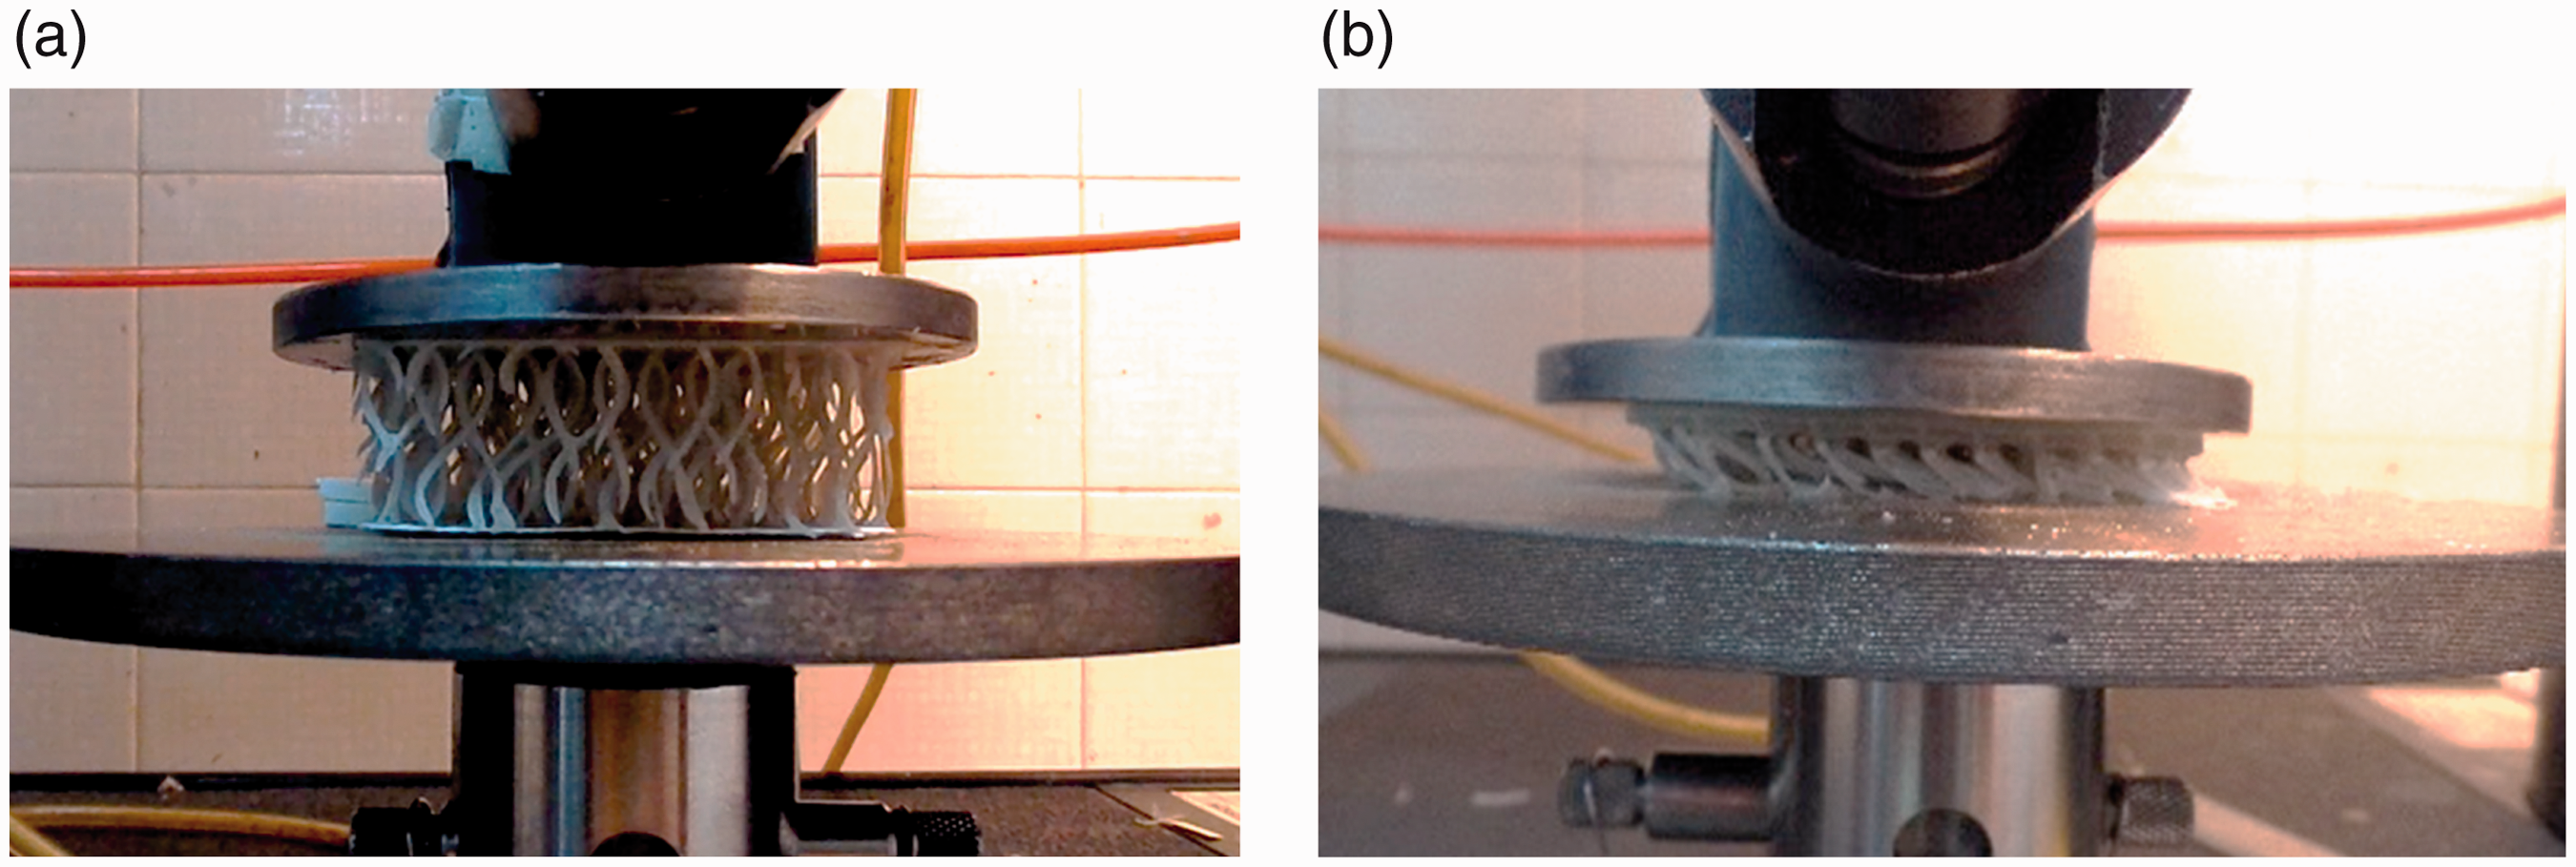
Results and discussion
Details of geometrical parameters of samples.
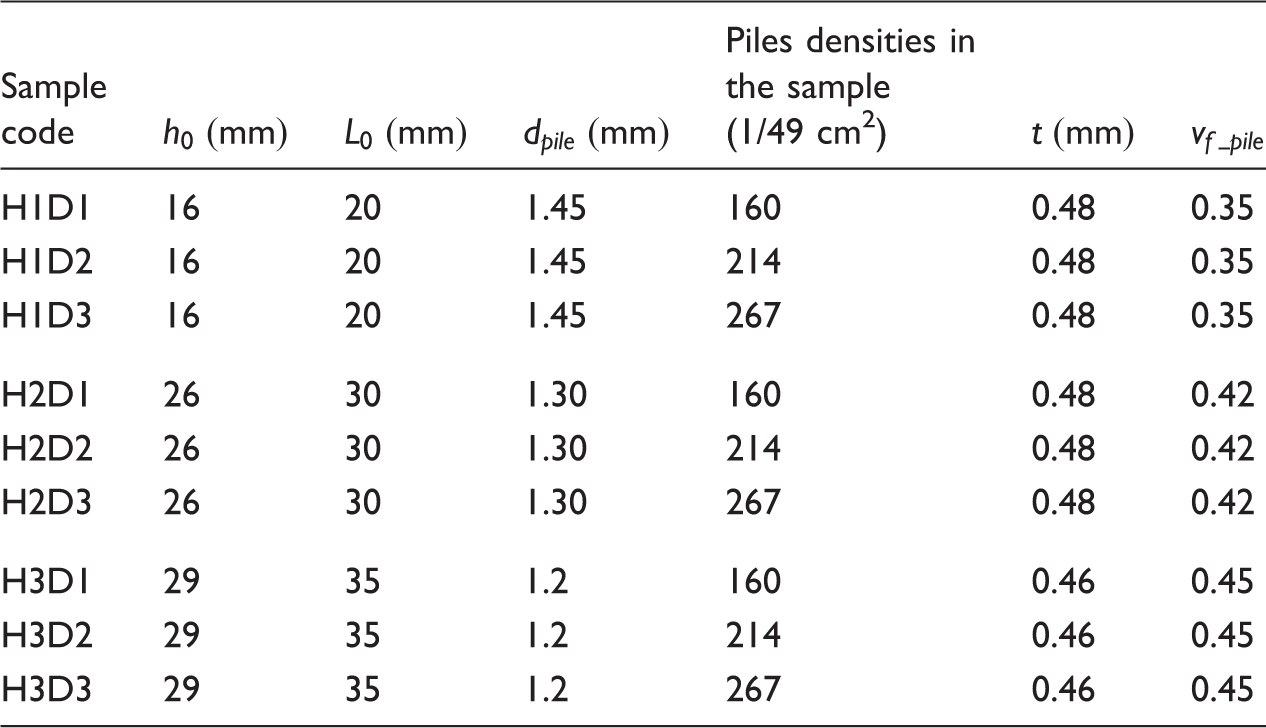
The structure of 3D integrated fabric is different from conventional woven fabrics; therefore, geometrical parameters of specimen used in the present model are depicted in Figure 8 and defined as follows: panel thickness (h0), uncurved pile length (L0) (length of the pile from A to B), pile diameter ( Geometrical properties of specimens: (a) schematic view of sample prepared for flatwise compression test and (b) 8-shaped pillar.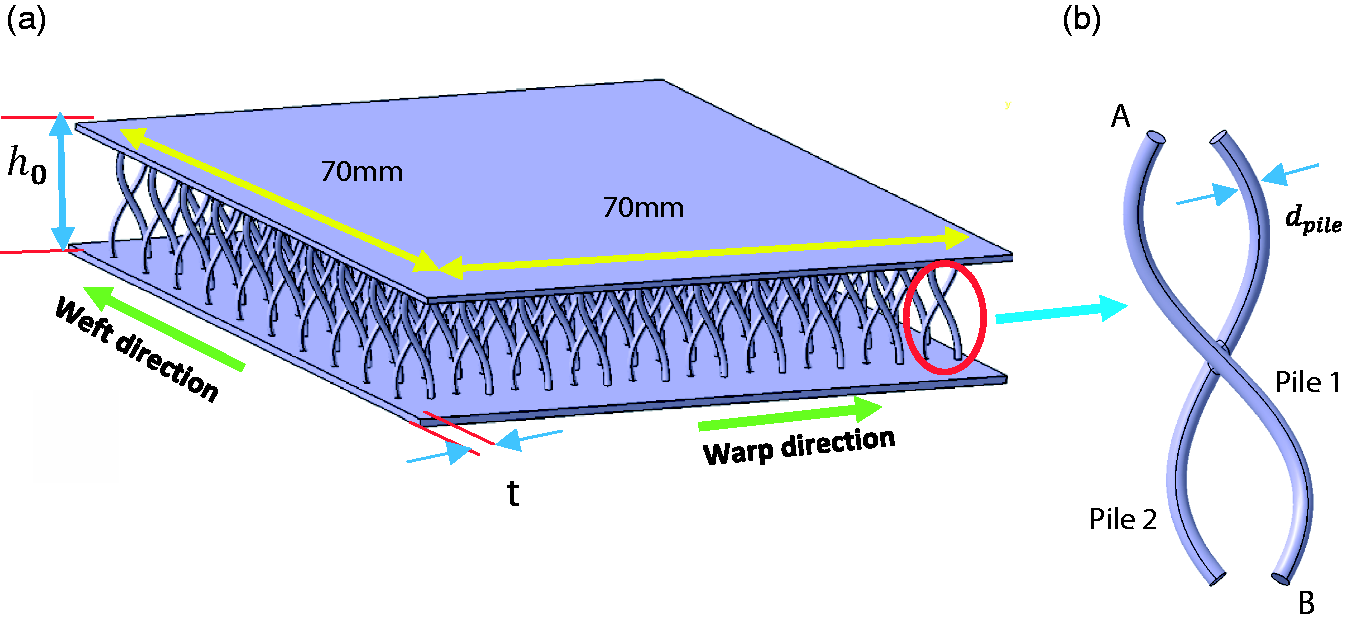
The detailed geometrical properties of specimens are presented in Table 3. The first letter of sample code stands for three different panel thicknesses (H1, H2 and H3) and the second letter stands for three different pile distribution densities (D1, D2 and D3). Pile density, which is defined as the number of piles in sample prepared for compression test (Figure 8(a)), is found by the number of piles in the weft direction multiplied by its warp direction per 49 cm2.
Figure 9 shows the experimental load–displacement behavior of specimens and prediction of the developed model. In the present model, it is assumed that the pile has a linear behavior until the failure (the first peak in load–displacement diagram). The sound of piles cracking could be heard as peak load reached. The non-linear part is the result of buckling, a kind of plasticity and densification of the core bars. The diagrams of all tested samples show that this was a correct assumption. Thus, it is possible to plot the load–displacement diagram by calculating the failure load and its corresponding displacement in the linear stage.
A comparison of experimental and predicted load–deflection diagram.
From Figure 9, it is clear that the trend of curves in all tests is similar, but there is a slight difference for different core heights, especially after the peak load and in the plateau stage.
The predictions are more accurate for panel with higher thicknesses (H2 and H3). It seems that in lower thickness (H1) as the two yarns composed of “8” shape are in close contact in comparison with higher panels thickness, therefore, the resin matrix will fill the two gaps of the “8”-shaped pillar, resulting in some irregular resin connections which are not considered in the model. This abnormal behavior of lower thickness panels under flatwise compression has been mentioned by other researchers [19,21]. On the other hand, the basis of the model is the measurement of the geometry of pile. One of the main geometric parameters of pile is the diameter which is obtained by the average thickness of piles of a panel at 50 different points. In a panel with a low thickness, as a result of mentioned irregularly, there are some rich resin areas. Therefore, the area of the measured cross-section is bigger than the real value, resulting in a magnification of results the model.
Figure 10 shows both effects of panel thickness (which is affected by pile length) and the pile distribution density on the strength of IWSC panels. As shown, the strength of IWSC panels is decreased remarkably by increasing the pile length and therefore the panel thickness. On the other hand, pile distribution density has a dominant effect on mechanical properties of IWSC panels. The low pile length with a high distribution density provided the best compressive strength. The combined effect of these two parameters shows that the compressive properties of IWSC panels can significantly be influenced by the pile length and density. This finding is consistent with that of the other studies [13,17–20].
The effect of panel thickness and pile distribution density on the composite failure load.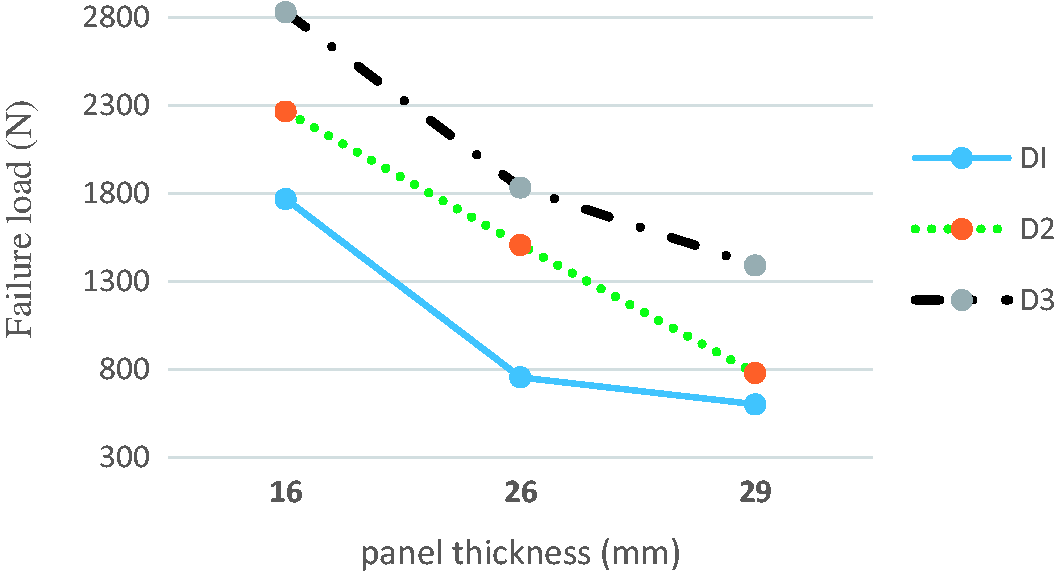
Figure 11 presents a comparison between results of the model and the experimental data. From this figure, it is obviously clear that the present model can calculate the strength of piles by an acceptable error.
A comparison of predicted and experimental strength.
Experimental data and model prediction.

As the model enables predicting maximum load in the elastic stage, the results will provide a reference for the design and application of IWSC panels. As a result, the proposed model can open new trends in modeling of the IWSC composites and this is the importance of the developed model.
Conclusion
An innovative micromechanical-analytical model has been proposed for prediction of the compressive strength of three-dimensional IWSC panels. Because of the unique and intricate nature of the core, development of a dedicated model is necessary. With the objective of evaluating the proposed model, produced samples with different core thickness and pile distribution densities were subjected to flatwise compression tests. The results show that the strength of IWSC panels is decreased remarkably by increasing the pile length and resultant panel thickness. On the other hand, pile distribution density has a dominant effect on mechanical properties of IWSC panels. The low pile length with a high distribution density provided the best compressive strength. The present model is able to calculate the strength of piles by an acceptable error and the predictions are more accurate in higher panel thicknesses. As the model enables predicting maximum compression load in the elastic stage, the results will provide a reference for the design and application of IWSC panels.
Footnotes
Declaration of conflicting interests
The author(s) declared no potential conflicts of interest with respect to the research, authorship, and/or publication of this article.
Funding
The author(s) received no financial support for the research, authorship, and/or publication of this article.