
Abstract
This paper is dedicated to investigating the properties of smooth conveyor belts through a tensile loading test, with the aim of examining the behavior of the inner structure of the belt samples. When the belt is subjected to a long-term strain, the belt relaxation effect is observed and changes may occur to the inner structure of the belt. The tensile test at constant velocity determines the load strength limit of the strip samples. The experiment has also shown the phenomenon of relaxation of the samples after the load. Metro-tomographic analysis is used to observe the behavior of the internal structure of the belt sample after the load. The obtained results indicate the initial damage of the inner structure of the conveyor belt occurred at the value of 2157 N. Under this load, the maximum damage size was 4.8 mm. This confirms the suitability of the method for tracking changes in the internal structure.
Keywords
Introduction
Conveyor belts belong to the most advantageous and most widespread forms of transport of large volumes of bulk and lumpy material, especially in surface and deep mines, stone, gravel and sand quarries, cement and steelworks, glass factories, brickworks, energy, construction, agriculture and other industries [1,2]. In course of their operation, they are almost continuously exposed to various factors, ultimately resulting in formation of undesirable conditions and processes causing their gradual wear and, possibly, the change of their individual properties. Such factors include a wide variety of causes that cause abrasive processes associated with the thickness reduction in both types of cover layers. Another group of degradation processes are those resulting in the formation of cracks and perforations. These processes are initiated under the influence of a number of parameters such as fragmentation, bulk density, transport velocity, impact angle, or, e.g. impact height. For this reason, impact loading is an important process in the transport industry as it causes wear and failure of critical components [3–5]. Overall, it can be stated that this is a very demanding issue in terms of its exploration necessary for efficient and reliable operation of conveyor belts of various structures. This is also underlined by the fact that it is therefore necessary to know and describe the behavior of conveyor belts, which is very demanding in view of the wide variety of their different designs.
The issue of conveyor belt behavior during operation is the center of interest for several researchers. Consideration must also be given to parameters such as the design of the conveyor itself, its idler housings, drums and siftings. Ultimately, this means taking into account the whole transport technology. In each of the available studies, this issue is presented on conventional belt conveyors, hose conveyors or conveyors of other designs. The entire process of conveyor belt behavior may still be complicated by the type and extent of the damage involved. There are several papers available in the area of rubber textile conveyor belts for hose conveyors, where, for example Fedorko et al. [6] showed the change in the physical and mechanical properties of the dynamically damaged conveyor belts and analyzed their inner structure—the conveyor belt skeleton was damaged by a non-destructive method of analysis. The presented results can be considered significant as they point to the facts that have not yet been identified by conventional methods. This issue is developed further in Barburski [7], where Fedorko et al. describe the processes of irreversible changes in the structure of rubber-coated textile conveyor belts due to the impact of sharp-edged material. The aim of the paper was to define dependencies between the selected parameters, such as the weight of the material, the impact height, and the degree of damage. All the presented results point to the facts that are primary initiators of unwanted process formation in rubber textile conveyor belts. Another interesting study of rubber textile conveyor belt behavior, focused on pipe conveyors, as were the previous cases, was presented by Barburski [7]. It presents a design of a new woven structure that would restrict the undesirable effect of collapsing the edges of the pipe conveyor belt inwards. His results thus point to the possibility of negating one of the common faults of all these conveyor types and expand the knowledge base with additional valuable information. However, there are many more research areas associated with pipe conveyors. It is primarily because of their more demanding structure and operating technology. Here, for example, the issue of conducting the packed conveyor belt in hexagonal idler housings and the associated problem of contact forces and motion resistance can be mentioned. In terms of asymmetric tensioning of the conveyor belt, the tension loads of asymmetrical tension forces occurring in the conveyor belt on the contact forces in the guiding idlers have been analyzed by Molnár et al. [8]. Other studies addressing this problem area include those presented by Zamiralova and Lodewijks [9]. In particular, they presented an experimental study that investigated the influence of major pipe conveyor parameters, such as the tubular diameter, the width of the belt, the transverse bending stiffness, the line mass, and position overlap of the load distribution between individual idler rolls, as well as the ability of the belt to form a stable tubular. The paper is a very important contribution which significantly unveils the issue in question and offers the possibility of comparing the insofar known theoretical results. From the point of view of efficient operation of the pipe conveyors and reduced wear of their surface structures, more and more opinions are heard as to whether it would not be more efficient to guide the conveyor belt in the shape of an ellipse instead of the conventionally used circular one. The given problems studied in more detail Maton [10], who compared the advantages and disadvantages of the pipe conveyors with a circular and eliptical cross-section of the closed conveyor belt. In addition to the shape of the packing, the motion resistance and the associated stress-deformation states in the conveyor belt play an important role in wear and tear of pipe conveyors. Several methodologies and procedures exist for their verification and identification. One of the relatively new and promising approaches is presented in Zamiralova et al. [11], which describes a new analytical method for determining the concentrated reaction forces of each of the rolls of the individual supporting idler stations of an empty pipe conveyor. In course of development of this study, an analytical model was designed and developed, and the computer simulation method was applied. The analytical model was linearized around a specific belt configuration, by applying distributed loads from the belt weight and from the belt stiffness to the pre-folded belt with initial tubular shape geometry.
An important factor that greatly affects the lifespan of the conveyor belts is the pull. In the conveyor belt, the pull is the factor upon which the transfer of forces from the propulsion set to the conveyor belt. Thus, the conveyor belt is prestressed thanks to the force of the pull, which is a desirable condition. Undesirable is increase in the prestressed value and its excess over the allowed limit. Prestressed value of the conveyor belt is influenced by a number of factors, such as the impact of the material on the conveyor belt at the sifting place or the place of release of the material from the hopper. It is a short-term process that may eventually have fatal consequences, demonstrated on the surface or in the inner structure of the belt. Visible effects on the surface include various types of damage or perforation. The range of these processes is most often investigated through experimental tests and measurements. That is why the authors devoted their full attention to the issue of conveyor belt testing against perforation. Studies by Fedorko et al. [12,13], for example, can be mentioned, dealing extensively with the problem of dependence on the weight of sharp material falling onto the conveyor belt, shatter height and force conditions in the conveyor belt based on experimental measurements by the regression mathematical model, and with the problem of determining the conditions under which the conveyor belt is damaged. Another consequence of tensile forces, reflected in the degree of damage to the conveyor belts, is the loss of their dynamic properties. The same author [14] presented the results of dynamic damage of rubber textile belts in pipe conveyor application.
It is not easy to determine the degree and level of damage of rubber textile conveyor belts. This is in particular because the conveyor belt is a closed unit whose internal structures are very difficult to analyze by commonly available conventional methods. For this reason, the range of available studies has focused on indirect, derived methods that detect damage to the rubber textile conveyor belt on the basis of various indirect indicators, such as the change in tensile strength, contact forces, or other parameters, effectively utilizing various original methods and approaches. An example worth mentioning is Andrejiová et al. [15], who selected the logistic regression method to analyze individual levels of conveyor belt damage. Two differently shaped tensile drop hammer tips (spherical and pyramidal) were applied and analyzed. All the results presented in this study are supported by experiments and can be applied in practice and in further research.
Blazej et al. [16] evaluated the non-destructive testing techniques of conveyor belt condition. A brief idea of each applied method was explained and both laboratory and industrial examples of investigation were discussed.
Simulation of the conveyor belt behavior is another area the authors deal with more extensively. One of the ways in which a rubber-coated textile conveyor belt can be examined by computer simulation is through the analysis of the bulk solid load on the conveyor belt during transport [17].
As a result of the change and action of the tensile forces in the belt of the pipe conveyor, different forms of behavior occur, necessitating different studying approaches. The computer simulation method is one of them. For this reason, simulation of conveyor belt behavior is another area the authors extensively devote their attention to, applying different software tools, and methods thereto. From a wide range of available studies, we can mention, for example, the one developed by Guo et al. [18] using the discrete element method (DEM) to create the optimized tubular diameter, which was obtained by fitting the curve of the formula for calculating the transport volume of the tubular belt conveyor and its simulation curve. It provided a certain reference value for improving the transport efficiency and prolonging the service life of the tubular belt conveyor [17]. Hu et al. [19] used a new conveyor belt simulation method in the ADAMS software. The results showed the correctness of this method and the feasibility of belt conveyor virtual prototyping. Fedorko et al. [20] resolved the problem of computation of contact forces generated by action of a conveyor belt on moulding rolls. The moulding part of the belt is analyzed during its transformation from flat to tubular form. Analyses were performed by means of the finite element method (FEM) by Abaqus software. The same software was used by Schilling et al. [21] for analysis of a pipe conveyor using solids with embedded truss elements and shells with rebar layers. Hodkiewicz et al. [22] developed the predictive models based on six wear definitions which have been used multiple linear regression, providing tools for forecasting belt replacements based on conveyor design and operational parameters. Another equally important factor of conveyor belt examining is the wear life modelling.
Of crucial importance to correct functioning of a conveyor belt is the selection of an industrial-grade adhesive joint, addressed by Mazurkiewicz [23], using FEM numerical modelling. The same author [24] analyzed the laboratory test results and industrial measurements, for conveyor-belt-bonded joint strength. The evaluation has been done from the point of view of the tensile of aging on their durability and reliability.
To carry out research on belt conveyors, various types of special test equipment and preparations are very often used. Król et al. [25] used this approach to investigate the motion resistances of a single idler housing. They used a special measurement stand for the sake of the study, simulating the conveyor operation in an underground coal mine. The presented results show the magnitude of the motion resistance depending on the transport capacity. Based on this, they determined the dependence between the movement resistance, the idler housing used in the experiment and the transported volume. The magnitude of the resistance to motion is one of the key parameters in designing conveyor belts. For this reason, it is given the main or marginal attention. Its determination is difficult. Different methods of experimental measurement are utilized, and those can be implemented in several ways. For example, Gladysiewicz et al. [26] used two conveyor belts during their measurements, where one was the transferring and the other the receiving conveyor. They conclude that the magnitude of motion resistance also depends on the angle of the material’s impact on the conveyor belt. In addition to the conveyed material, motion resistance of conveyor belts is significantly affected by the viscoelastic properties of the rubber [27], with a direct correlation between belt velocity and motion resistance. According to Munzenberger and Wheeler [28], the motion resistance of conveyor belts is also influenced by their internal structure, in particular the textile skeleton, the lower cover layer, and their respective material properties. These properties are determined in a very complicated way and there is currently no relevant universal methodology for their determination. In addition to experimental measurements, the properties of conveyor belts can be determined using different theoretical models, e.g. Maxwell model of the backing material [29].
The motion resistance significantly affects the load applied to the conveyor belt. The load on the conveyor belt is closely related to its reliable operating capability. If the tension is set correctly, the conveyor belt will not slip on either the drive or the return drum. Conveyor belt manufacturers recommend tensioning the conveyor belt in service to 1/10th of the conveyor belt strength per 1 mm width.
The aim of the paper is to investigate the properties and behavior of the inner structure of smooth conveyor belts under tensile stress using a new, not yet applied methodology that allows for direct monitoring with no need to harm the sample of the conveyor belt. The conveyor belt sample used in the experiment has been designed for general use (transport of granular and loose material (sand, lime, etc.)).
Material and methods
Conveyor belt test samples
The belts are composed of several layers of rubber and rubber-coated textile core, containing polyester or polyamide textile inserts. Rubber-lined covers protect the conveyor belt from atmospheric influences and from damage during use. Conveyor structural design necessitates the conveyor belt to be tense. Thus, the conveyor belt is strained due to the effect of the tensile force and the weight of the transported load.
The paper describes test specimens additionally reinforced with a textile lining, which causes different mechanical properties depending on the direction of loading. Such materials are called anisotropic and have different Young’s modules in different directions. The elasticity module of these types of materials varies depending on the load. All experiments were carried out in a direction parallel to the fibers, where the Young’s module is the largest, and therefore the largest load is required for the deformation of the sample. The test samples were therefore taken from the conveyor belt in the longitudinal direction. An ISO 283-1:2000 type was used for the test samples. The shape and dimensions of the test body are displayed in Figure 1. The sample of the conveyor belt contains a rubber component made of natural rubber and butadiene. Basic characteristics of the conveyor belt are shown in Table 1.
Shape and dimensions of the Type A sample ISO 283-1:2000. L – jaw opening. Basic characteristics of the conveyor belt.

Tensile test on belt samples
For the purposes of examining and testing the belt sample, it was necessary to determine the strength limit of the samples. In accordance with the standard ISO 283-1:2000, the trials were performed on three samples cut in the longitudinal direction from the conveyor belt. Load speed was selected according to standard ISO 283-1:2000 with the value of 100 mm.min−1 ± 10 mm.min−1 until the sample breaks or shows the first signs of sample failure. In the future, additional tensile tests are planned to be carried out at lower load speed. A tensile test at lower load speed is expected to yield more information. For the tensile test, a TIRAtest 2300 Tensile Machine was used (Figure 2). TIRAtest 2300 is used for straining, pressing, and bending of different materials. It is a microprocessor-controlled material testing machine with a maximum test force of 100 kN.
Tensile test by continuous loading in the tensile testing machine.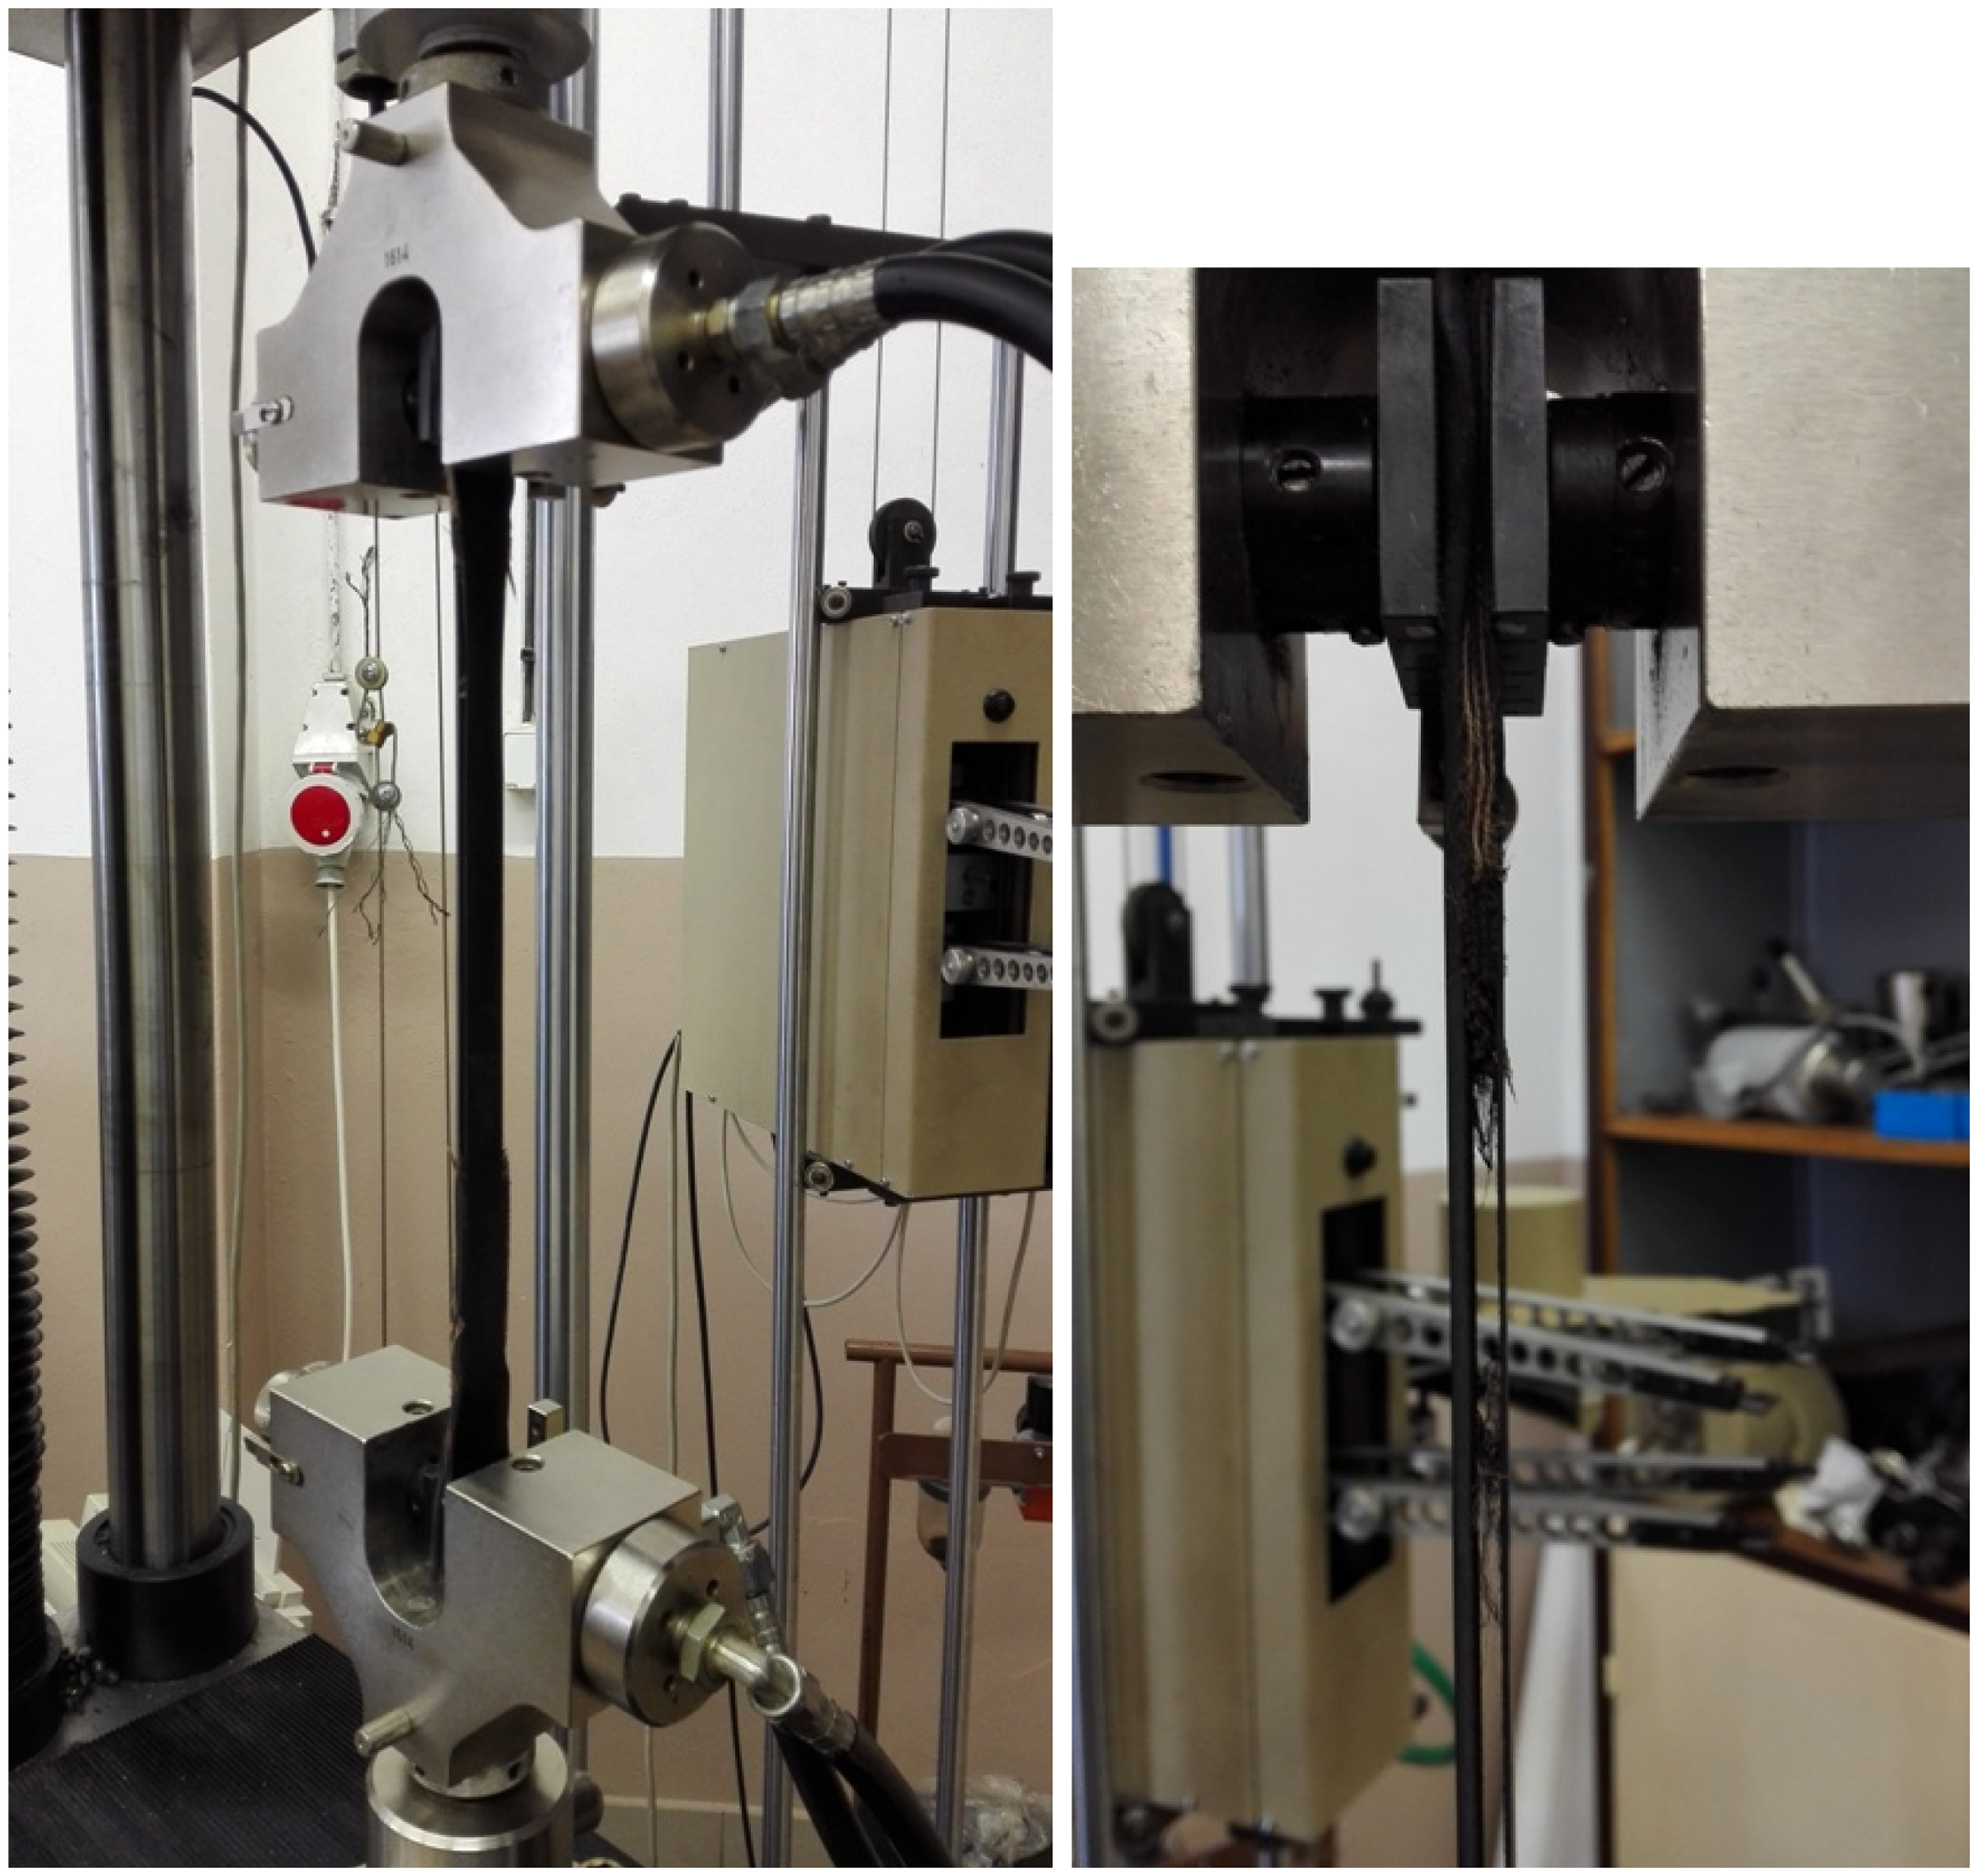
The sample was torn during the tensile test at a load of 3457 N (average value) at a relative deformation of 24% (average value) (see chart from one sample – Figure 3). For the sample, the strength limit is set to 18 MPa. The important result of this test is the value of the tensile strength limit. However, this test does not provide information on the behavior of the belt material, on changes in the belt’s internal structure over long-term loading, and the effect of belt material relaxation.
The chart of the sample’s tensile test.
Examining the behavior of conveyor belt samples under a constant load for a long period of time
The aim of the study is to identify the behavior of the belt conveyor sample under load in time. Based on past experience, it is apparent that the sample will continue to change its dimensions after loading and, as a result, the load will change. This is the so-called relaxation process, even when the load is constant, the conveyor belt sample will continue to deform. Such a style of strain is also common in practice where the conveyor belt is installed with a certain preload and after a certain amount of time it is necessary to increase the strain, in order to increase its preload for its proper function. For the purpose of such gradual loading, a measuring chain (Figure 4) is assembled to load the conveyor belt sample and monitor the behavior of the sample.
Measuring chain for testing conveyor belt samples while deformation and force are monitored.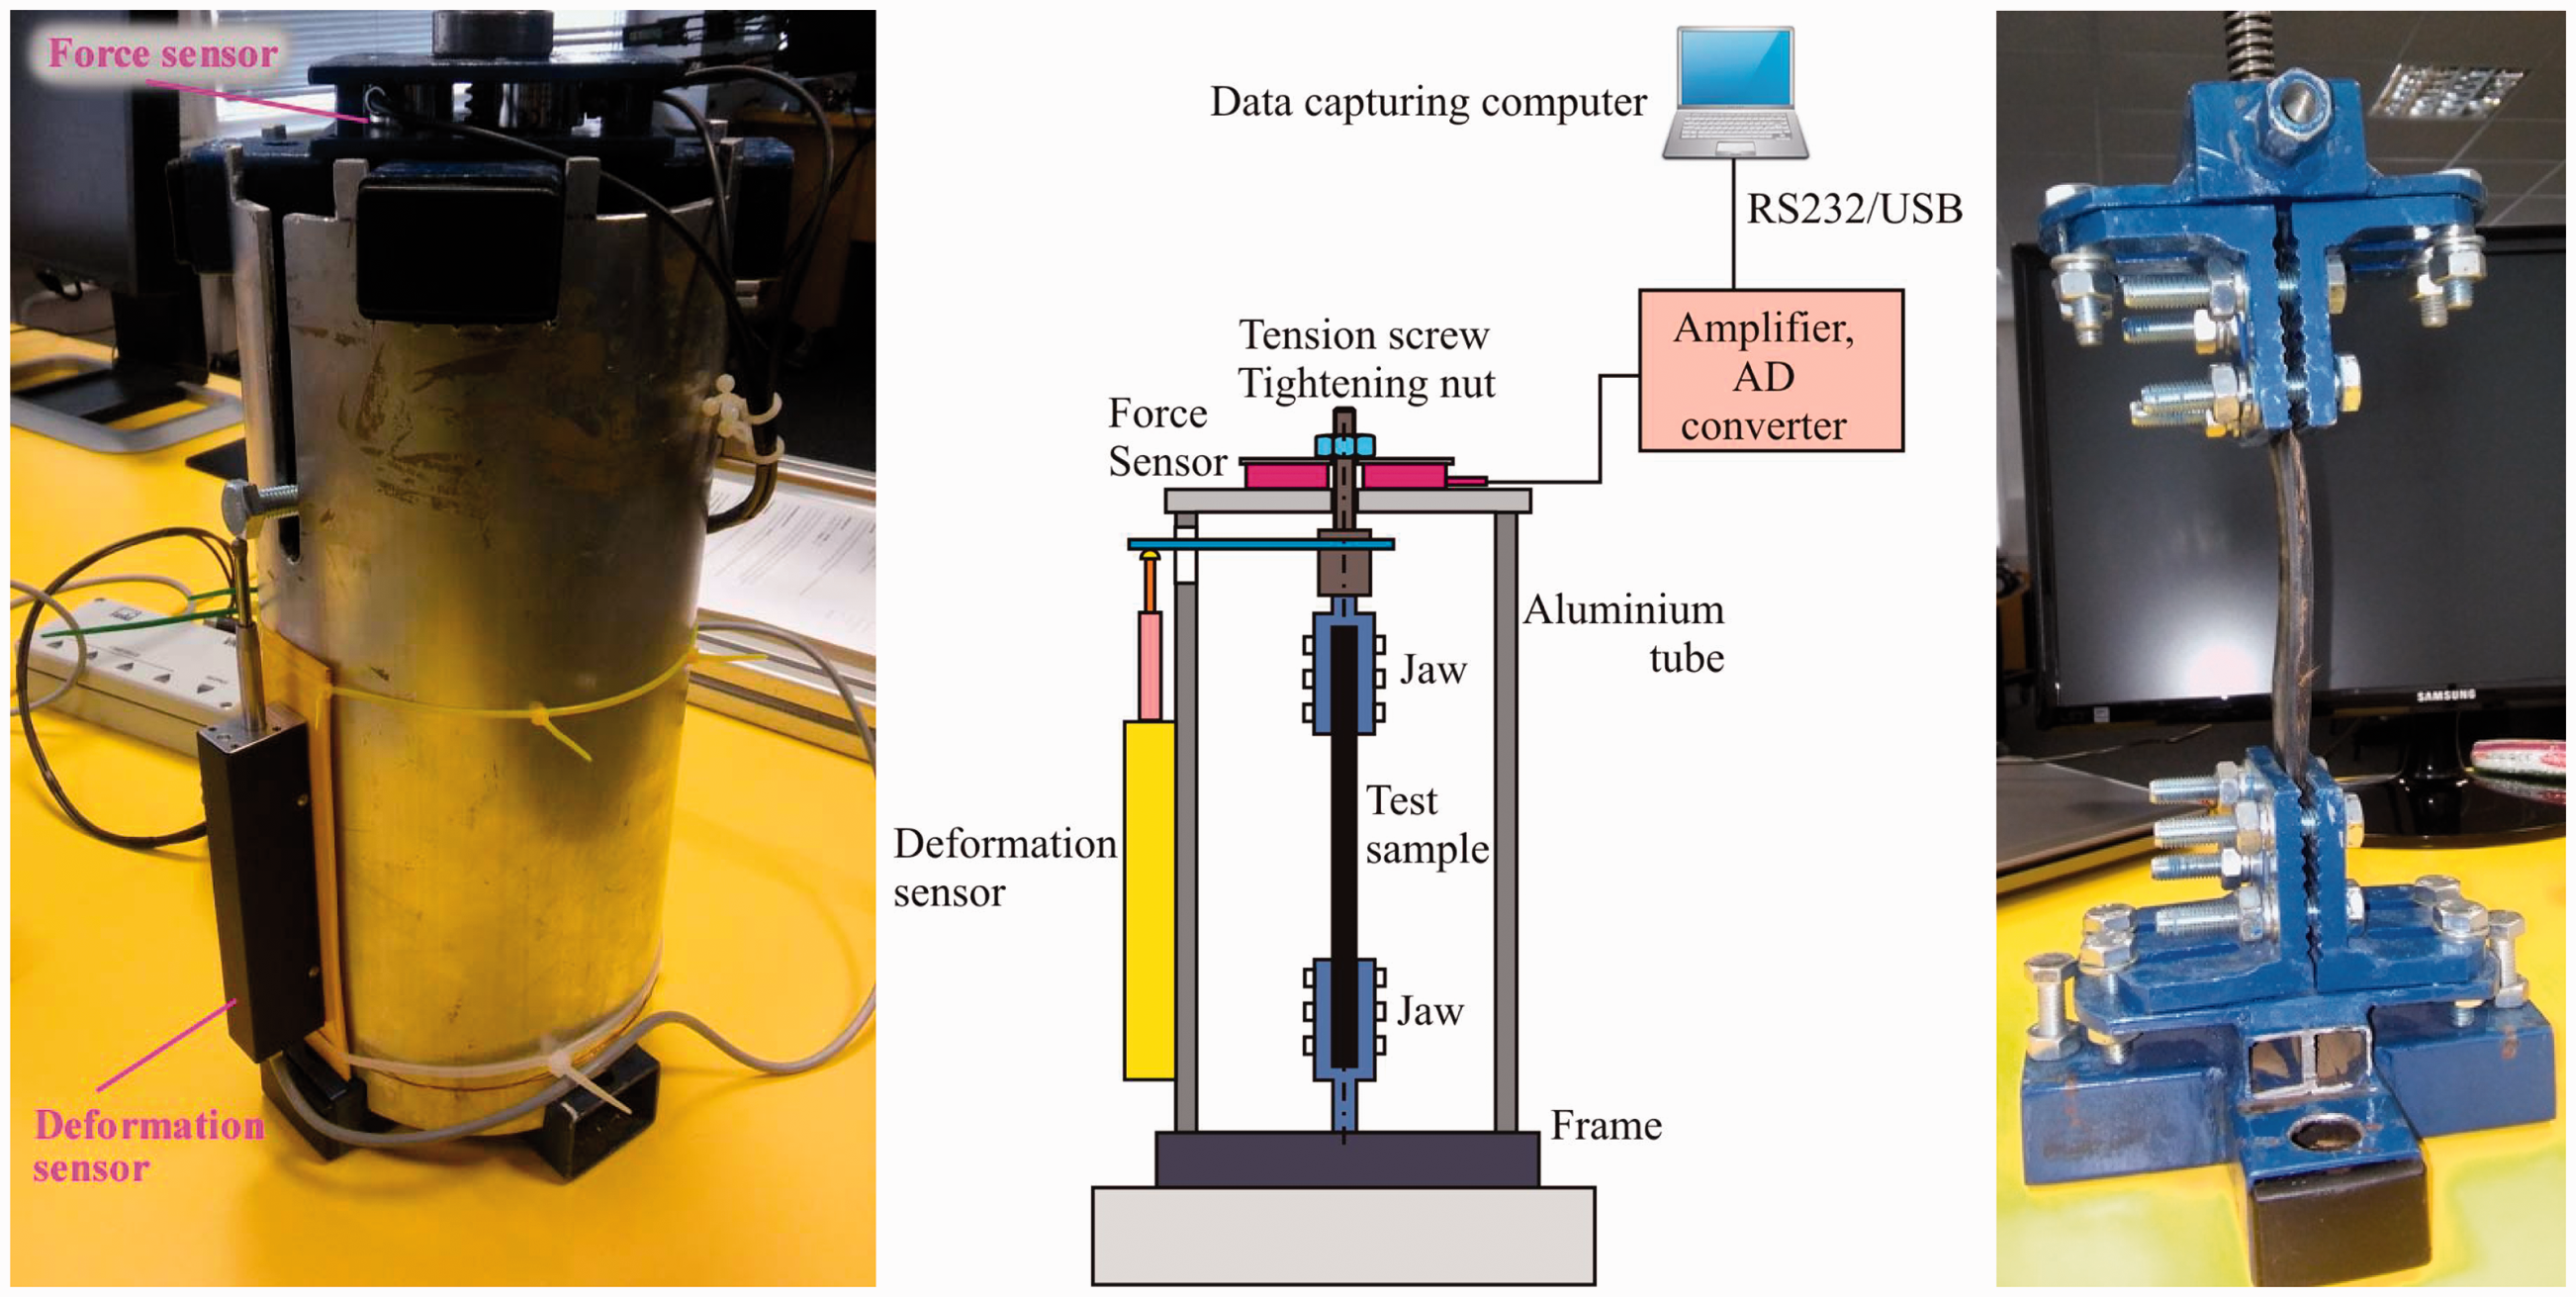
The test apparatus (Figure 4) for testing the conveyor belt samples consists of a load frame in which a sample of a conveyor belt with standard dimensions (Figure 1) is clamped in the device by clamping jaws. The screw mechanism results in an axial loading which causes the deformation of the test sample.
The applied load force can be determined by means of a force sensor placed under the tension screw with tightening nut. The force transducer consists of three separate force sensors arranged at 120° and wired in parallel (Figure 5). The total range of the force measurement is then the sum of the ranges of the individual sensors. Force transducers C9C with Junction box VKK1-4 and Amplifier board AD103C/ SC232/422B, all made by Hottinger Baldwin Messtechnik GmbH, were used. This force transducer arrangement has better sensitivity than the sensitivity of one force transducer with the same range. The measurement accuracy is also better than the accuracy achieved by the conventional use of one transducer.
Force sensor arrangement and parallel wiring connection.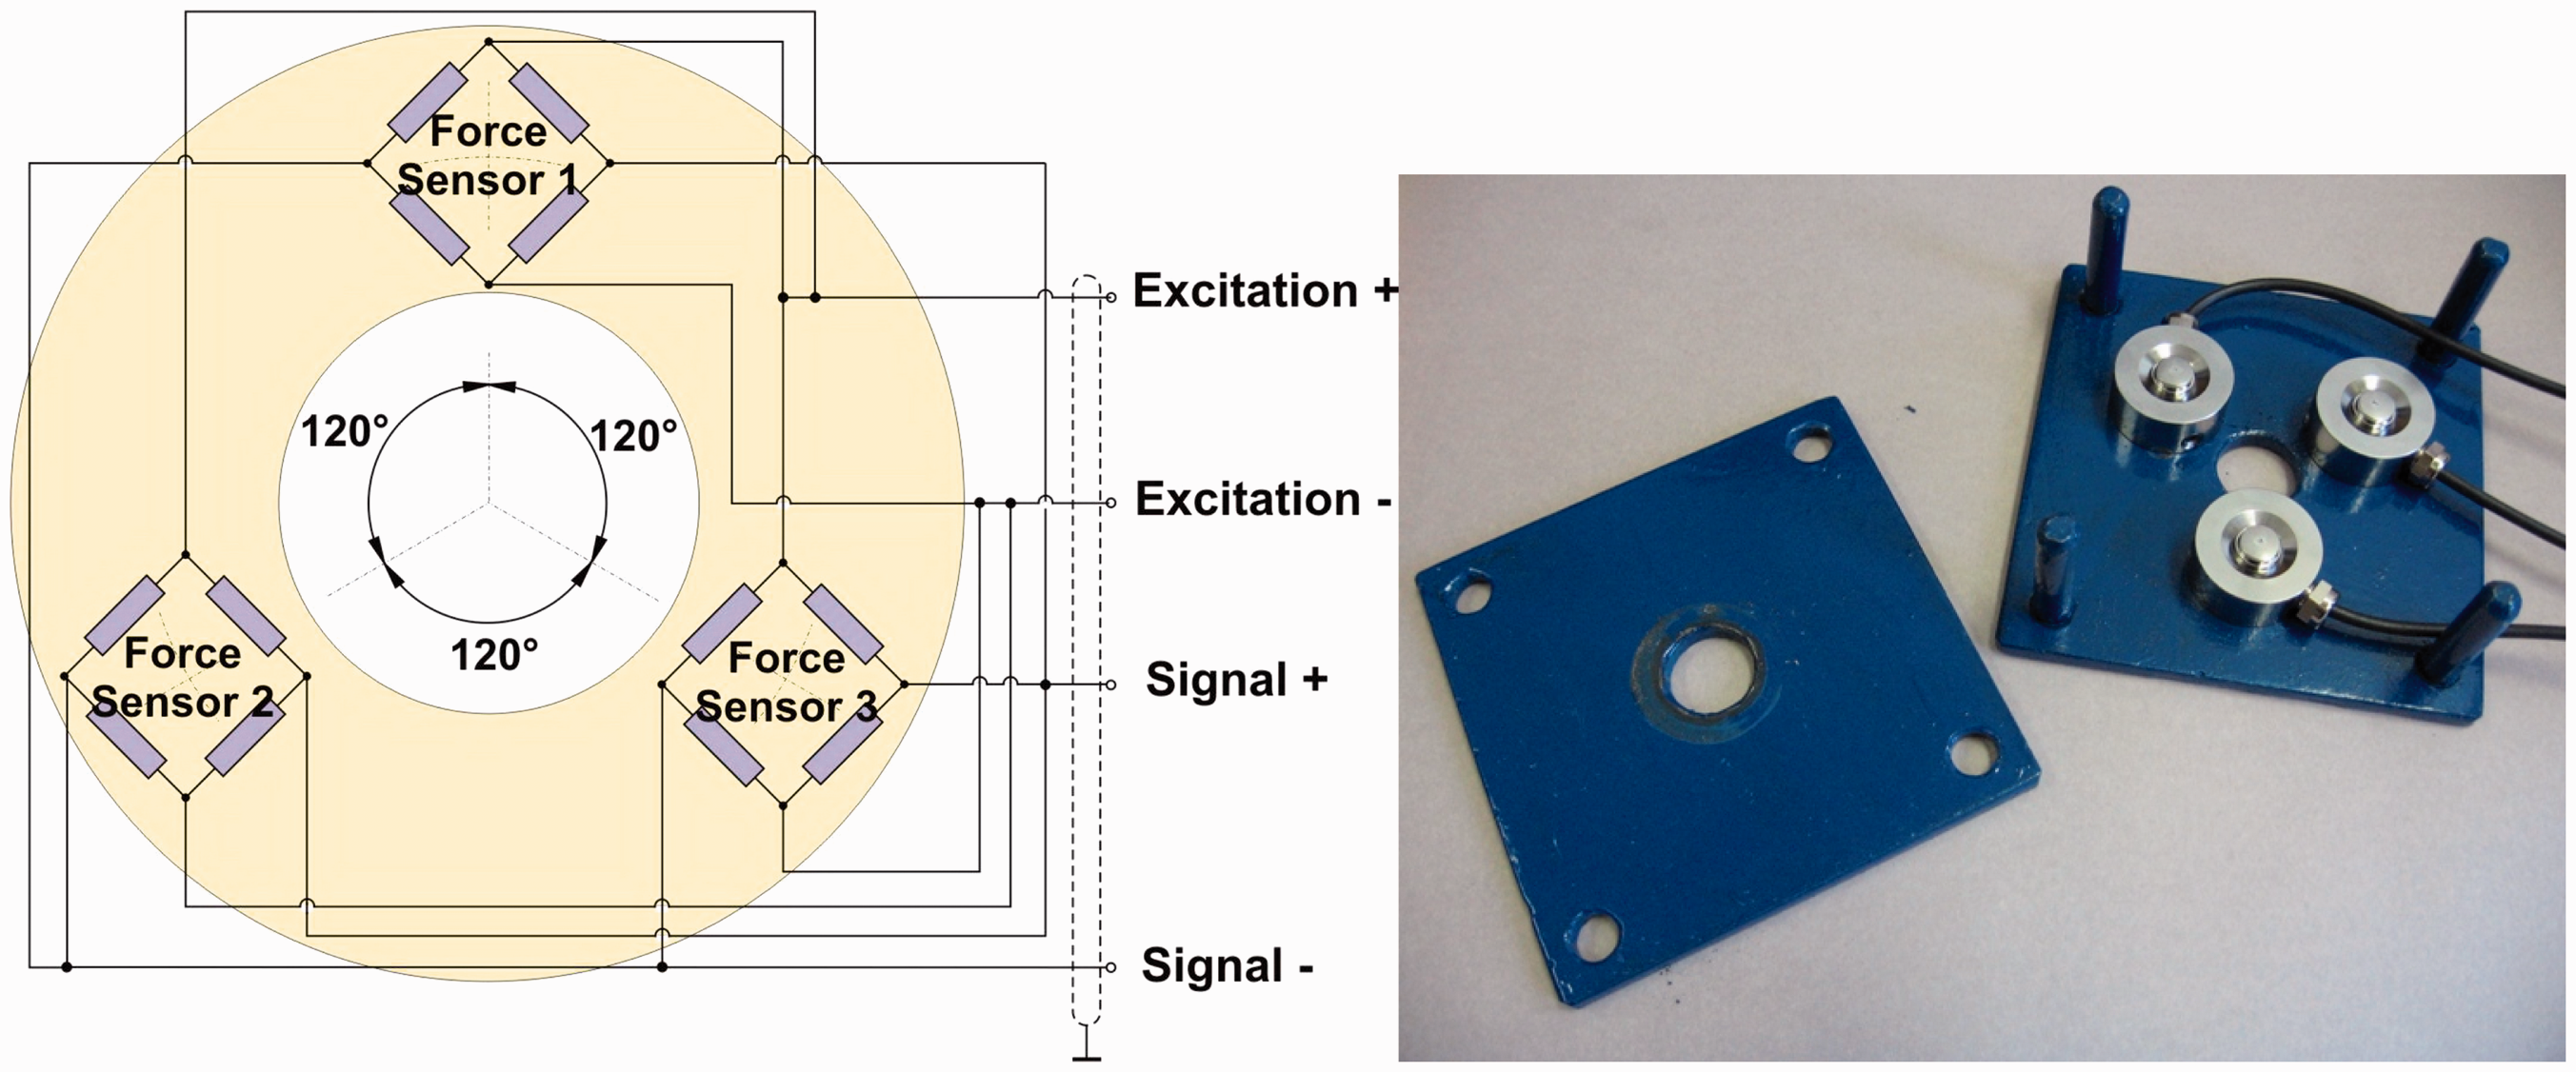
The sample of the conveyor belt was gradually loaded by pulling with a preset initialization force (Figure 6). From the course of forces, we can see that the force gradually decreased at the beginning and stabilized after 45 min of loading. The progressive loading process was repeated until sample broke during force adjustment.
Sample loading over time.
Relaxation time has been selected according to stability of the deformation value. If the difference between two deformation values (per 10 min) is less then 1%, the relaxation time has passed. Longer relaxation time does not impact the results. End of relaxation time is important for the metro-tomographic scanning of the sample, i.e. the sample structure no longer moves during the scanning and blurry scanned images are prevented. From the course of deformation of the sample over time (Figure 7), the progressive elongation after load by force is evident. The dependence of the force on the deformation of the sample (Figure 8) shows initial loading of the sample and subsequent gradual relaxation of the sample. The force to be applied for breaking the sample slightly exceeds the force required to break the sample in the tensile testing machine. This is due to different nature of the load.
Sample deformation over time. Dependence of force impact on sample deformation.

Design of experiment – test methodology to determine the behavior of the belt sample material during the gradual loading of the samples and their subsequent relaxation
The test sample is cut out of the conveyor belt and, under normalized conditions, it is subjected to tensile strain and elongated in the tensile testing equipment until the moment it breaks. The test was run 24 h after the sample was prepared at the earliest and after it had been conditioned over 8 h to the ambient temperature of (20 ± 2)℃ with the relative humidity of (65 ± 5)%.
A sample of the belt material is clamped in a special loading device (Figure 4) while being subjected to uniaxial stretching stress in the longitudinal direction of the fibers of the material. For this kind of material, it is typical that relaxation occurs in the sample while the strain gradually increases with a time delay at constant deformation of the material. The material response was detected by force transducers, while the scanning of the material structure itself was accomplished after the relaxation process was completed.
Test sample is preloaded by prestress, which is less than 0.5% of nominal tensile strength of the sample. The entire loading device is then inserted into a metro-tomograph (Figure 9), where it is possible to monitor the change in the dimensions of the sample after loading and also the internal structure of the loaded sample.
Measurement chain for testing conveyor belt samples with sample structure monitoring.
The first experiments showed that in the sample subjected to the load, the relaxation process occurred, i.e. a movement within the sample structure. Stabilization of the internal structure of the sample was particularly important for the metro-tomographic scanning of the sample, i. e. so that the sample structure should not move during the scanning, causing the blurry scanned image.
For this reason, sample testing was carried out with gradual loading and relaxation of the sample. After each set up of loading, the relaxation effect on the test material was observed in the form of a drop in load force indicated on the force transducer. Consequently, the loading of the sample was carried out gradually, considering the relaxation of the loaded sample (Figure 10). This means that the sample was loaded in the first step with the selected force value and the process of relaxation of the loaded sample was monitored. Upon completion of the relaxation process, the load is stabilized in the sample, the sample is monitored in a metro-tomograph to determine the behavior of the sample material, especially the internal structure of the sample.
Loading process of tested sample.
Then the sample is reloaded and the process of relaxing is monitored. This process is repeated until the sample is damaged (Figure 11). The relaxing process occurred over a 24-h period at 20℃.
Broken sample – torn in testing device (Figure 4).
Results and discussion
The results of the examination of the conveyor belt samples progressively loaded by pulling with subsequent relaxation
Initial experiments showed the effect of relaxation after sample loading. Figure 12 is a cross-section of the middle part of an undamaged sample loaded with 3922 N. This is the first tensioning. The load value after 24 h stabilized and dropped to 1863 N.
Cross-section of the middle part of an undamaged sample loaded with 3922 N. 1 – textile frame, 2 – rubber filling, 3 – bottom cover layer, 4 – top cover layer.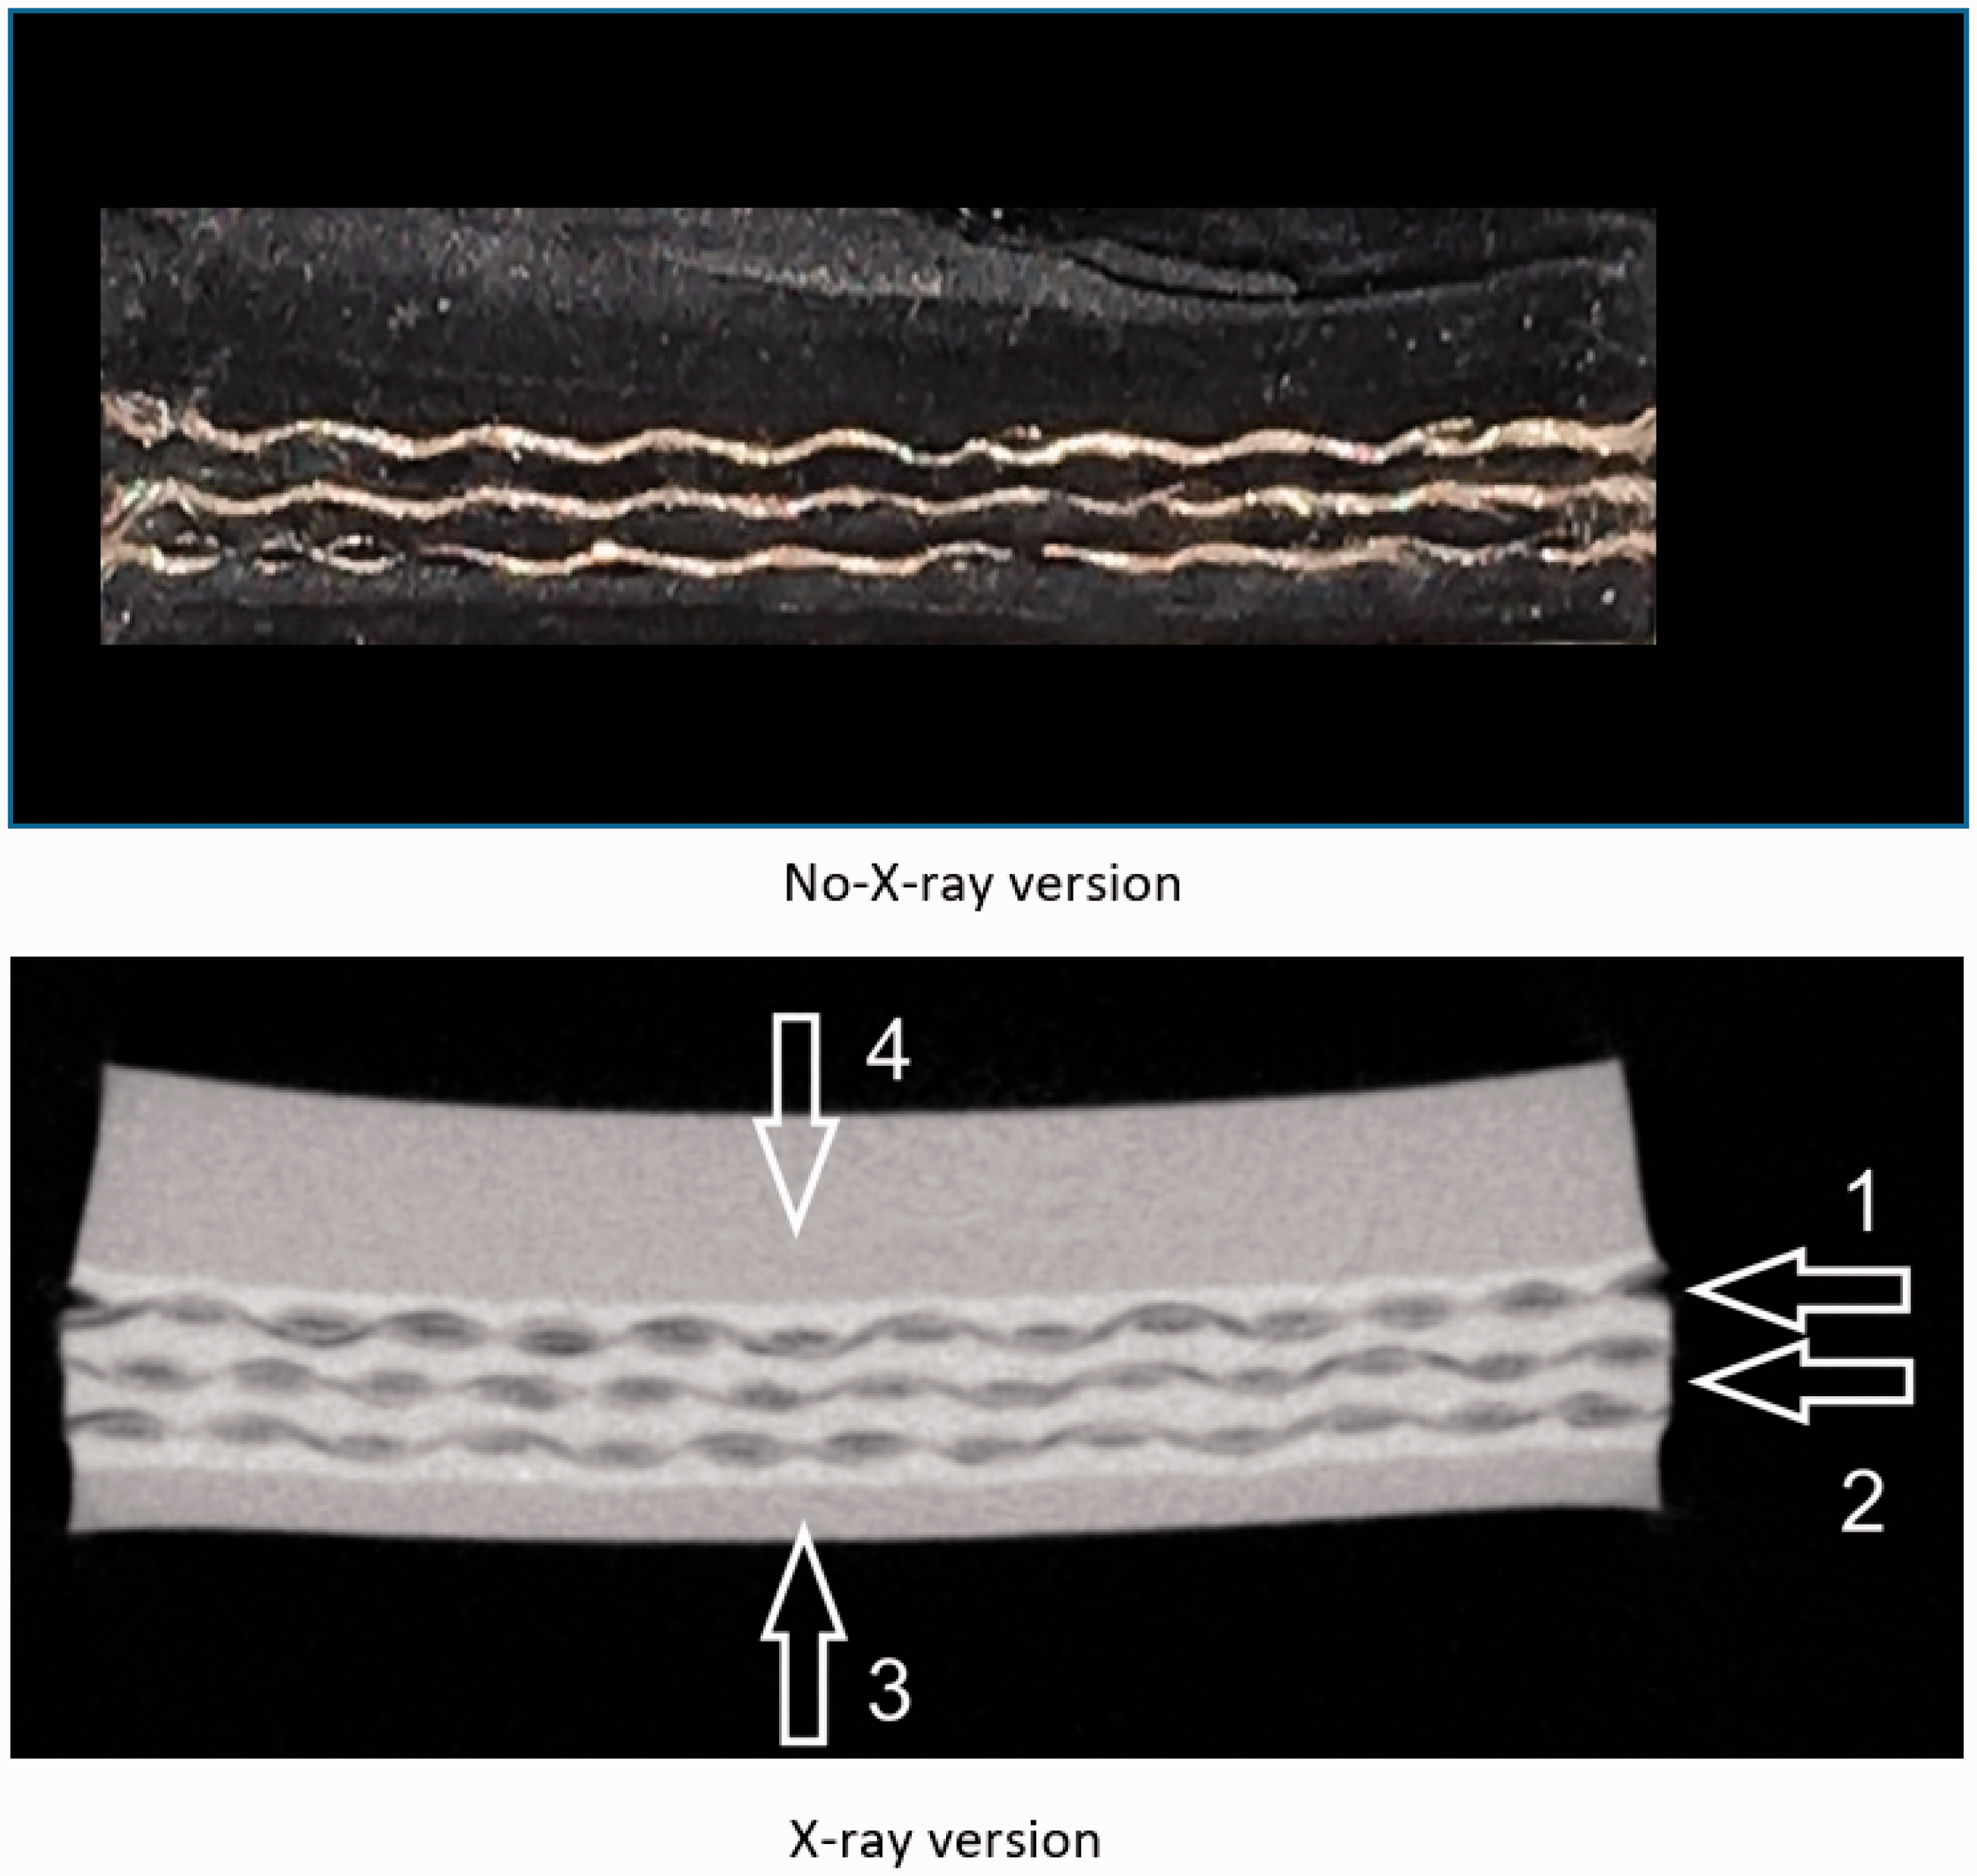
During the third tensioning of the sample, the first tears appeared on the reconstructed image. The load value after relaxation is 2157 N.
Figure 13 shows the area in which the first changes in the shape of the sample’s cross-section are detectable. The image does not show significant damage to the sample’s internal structures. However, there are tears on the right side of the sample (marked with an arrow) and a tear running along the fiber (indicated by a rectangle).
The areas in which the first changes of the shape of the sample’s cross-section are detectable.
Figure 14 shows the largest damage of the observed sample. There is a visible change in the cross-section of the sample. Evidently, it can be seen that this is not only superficial damage. This damage runs deep. In the case of this section, the continuous damage depth is 4.8 mm.
Largest damage to the observed sample.
Upon further tensioning of the sample, a massive deformation of the conveyor belt sample occurred. The force after relaxation stabilized at 1588 N. Figure 15 is a sectional view of the sample at the site of damage. Significant shifting of the pattern, as well as destruction of the textile insert, is visible.
Section view of the sample’s damaged area.
The sample suffered damage approximately in its middle area (Figure 16); therefore, a damage caused by clamping jaws can be ruled out.
Damage that the sample suffered in its middle area.
The damage spreads gradually and decreases towards the center of the sample, with all the inner layers being damaged (Figure 17).
Damage gradually spreading towards the center of the sample.
Figure 18 represents a 3D reconstruction of the sample surface, with observable overall sample deformation.
3D reconstruction of the sample surface.
The next subsequent loading resulted in complete destruction of the sample throughout its cross-section.
The rectangle shown in Figure 19 on the left (TOP section) marks the area from which the threads have been drawn or torn. Figure 19 in the center shows the RIGHT plane, with the circle marking the area of interest, and the arrows pointing to the areas with the threads missing. Figure 19 on the right shows a view of the FRONT plane, where the arrows point to the areas of interest in the TOP plane. The view of the section is distorted because the sample has been bent.
Section of the sample outside the major damage area.
Figure 20 is a cross-sectional view of a sample in the affected area. Textile fiber residues are visible. However, their presence is minimal when compared to the undamaged part. Unlike previous measurements, only a slight change in the shape of the sample occurs due to the assumption of tension relaxation.
Cross-sectional view of the sample in the affected zone.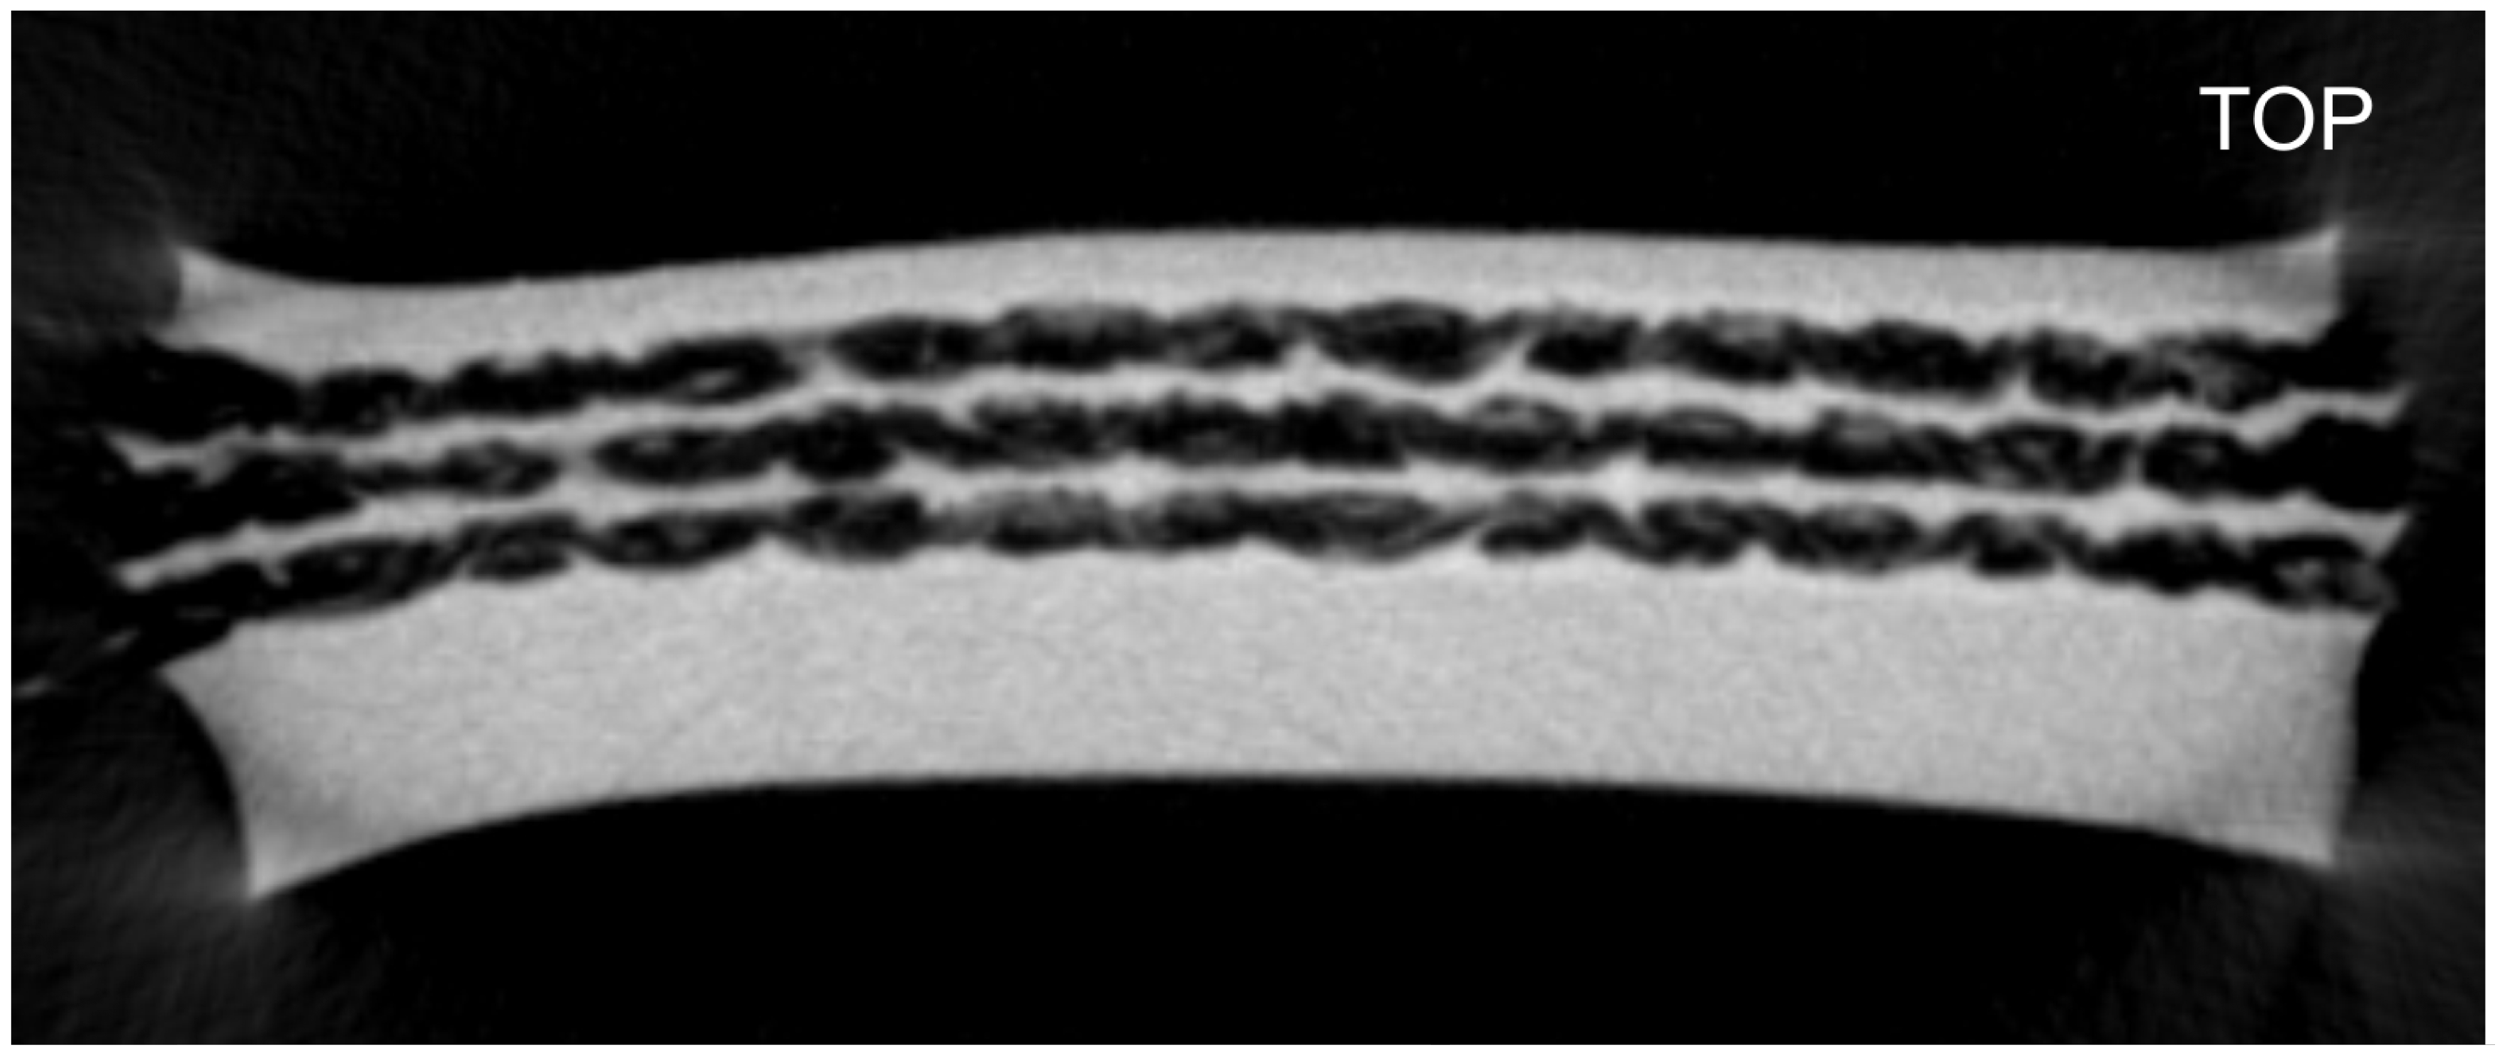
Figure 21 shows views of the entire sample from various directions. Destruction of the sample is visible across the entire cross section; the length of the damage cannot be determined as the sample is tensioned in the jaws.
Views of the whole sample from various directions.
Figure 22 shows a 3D view of the sample. Sample deformation is visible, i.e. the extent of narrowing at the site of damage.
3D view of a sample with observable deformation.
Possibilities of further research direction
To monitor the internal structure of the sample by metro-tomography, it was also necessary to leave the sample relaxed so that the sample structure was already stabilized at the time of scanning. The behavior of the internal structure of the sample was evaluated after the loading and the subsequent sample breakage.
By markings on the surface, it was possible to evaluate the stretching of individual layers of material. The sample is scanned after marking but before stretching, and then the tension is gradually increased until the sample tears. In the end, the deformations were evaluated as the change in the distance between reference points before, after and during the measurement.
Further research can continue in two basic steps: The first is to test the pulling device on multiple samples with different structure, thickness, etc. The limits of the device will thus be determined. The second step is the analysis of displacement of individual layers with respect to each other during the tensile test. In this case, it will be necessary to design the placement and tagging methodologies. A limiting factor will be the sample material, because higher density materials can create noise and thus cause local degradation of the CT image.
Conclusion
The result of the research is a mechanical tensile belt conveyor test combined with industrial computed tomography, which provides information on changes to the internal structure of the evaluated sample. For this purpose, a device for exertion of the desired tensile force optimized for use in a computer tomography (CT) was designed. The obtained and presented data show that the use of a CT facilitates detection of the mechanism through which the conveyor belt sample damage formed and spread. Based on this, a better prediction of the occurrence of damage to the observed sample can be made. The presented research is unique because it allows to capture real-time damage of the transport belt sample. The methodology described in the paper is an original idea and a result of work by the team of authors. Its establishing opens up other opportunities for research of this issue and can be a potential starting point for further scientific work.
In accordance with standard ISO 283-1:2000, tensile tests were performed to experimentally identify the strength limit of the conveyor belt sample. This test was carried out at a constant velocity, which affects the carrying capacity of the belt sample.
Gradual loading of the sample showed higher resistance of the sample than the standard ISO 283-1:2000 test. The method of loading the conveyor belt influences the load-carrying capacity of the belt, which is related to the phenomena occurring within the structure of the conveyor belt. For further investigation of the conveyor belt behavior, it is necessary to monitor the behavior of the inner structure of the conveyor belt during loading. It is clear from the experiments that the behavior of the sample is significantly influenced by the sample relaxation. After the sample was loaded, the inner layers of the sample continued to deform.
Footnotes
Declaration of conflicting interests
The author(s) declared no potential conflicts of interest with respect to the research, authorship, and/or publication of this article.
Funding
The author(s) disclosed receipt of the following financial support for the research, authorship, and/or publication of this article: This work is a part of these project nos. APVV-15-0149, VEGA 1/0224/18, VEGA 1/0063/16, VEGA 1/0403/18, KEGA 006 STU-4/2018, KEGA 063TUKE-4/2016.