
Abstract
In this work, a new bimodal fiber diameter distributed structure composed of polyurethane (PU) and poly (2-acrylamido-2-methylpropane sulfonic acid) (PAMPS) hybrid nanofibers was synthesized and used as a breathable-windproof membrane (BWM). Graphene oxide (GO) was compounded with AMPS through polymerization process to increase the membrane performance. Water vapor permeability (WVP), air permeability (AP), and tensile strength at break were evaluated as BWMs performance. The effects of PU and PAMPS fiber density and GO loading on the membrane performance were modeled and analyzed using the response surface methodology (RSM). The results show that when PU fiber density declined and GO loading increased, WVP of membranes improved. Also, an increase in PU and PAMPS coverage density led to a decrease in AP. Tensile strength at break increased as PU fiber density and GO loading rose. RSM also predicted that with using 6.07 g/m2 PU fiber density, 2.40 g/m2 PAMPS fiber density, and 2% GO loading, the optimum performance of BWM, that is, the maximum order of tensile strength (18.45 MPa) and WVP (848.22 g/m2/day) and the minimum order of AP (15.66 lit/m2/s), can be obtained. The results of experimental tests are in good agreement with predicted values by RSM.
Introduction
Electrospun nanofibrous membranes (ENMs) have potential applications in protective clothing (PC) [1–3]. Once applied, the membranes should protect the wearer against wind penetration while providing good breathability. The conflict between protection performance and comfort feature is one of the main problems in designing and engineering of protective clothing [4]. Using fiber with different diameters (bimodal nanofiber) [5, 6], electrospinning of polymers with different properties and employing graphene family nano-additives are some of promising solutions to this problem. To the best of the author’s knowledge, previous research has primarily focused on the electrospinning of hydrophobic polymers to fabricate ENMs for PC applications, while hydrophilic polymers have been used in the form of dense membranes in protective clothing by some researchers [5–8].
Hydrophobic polyurethane (PU) nanofibers as well as super absorbent poly (2-acrylamido-2-methylpropane sulfonic acid) (PAMPS) nanofibers were reinforced with graphene oxide (GO) and in this study they were fabricated to obtain a desirable performance, that is, good breathability, wind proofing, and tensile strength. Thanks to such unique features as good tensile strength, hydrophobicity, and excellent hydrolytic stability, PU ENMs make good candidates for use in protective clothing applications [9,10]. The PU electrospun nanofibers have been synthesized with diameters in the range of 200–500 nm. PAPMS as a hydrophilic and ionic polymer have been used in protective clothing [11–13]. Kim and coworkers reported fiber with average diameter of 60 nm in optimum process parameters. In spite of super hydrophilicity of PAMPS, the dimensional stability and strength of these polymers are poor. To solve this problem, GO is used [14, 15]. With regard to their excellent mechanical, thermal, and electrical properties, GO have found wide applications as fillers in polymeric composite structures. Because of their hydrophilic groups like hydroxyl and carbonyl group on their surface, GOs can improve the water vapor permeability (WVP) of nanocomposites [16, 17]. The use of graphene family for enhancing physical and mechanical properties of ENMs has been considered by different research groups [18–21].
In order to describe and identify the individual and interactive effects of material parameters on membrane performance, response surface method (RSM) [22–24] was used in this study. This method helps to save costs and time by reducing the overall number of required tests. RSM has been successfully used by researchers to investigate the effects of electrospinning parameters on nanofiber diameters [25–30]. Chieng et al. [28] optimized the tensile strength of poly (lactic acid)/graphene nanocomposites using RSM. They stated that RSM model was able to accurately predict the response of tensile strength with a margin of error of less than 2%. The empirical model and surface counter provided by RSM represent the influence of electrospinning parameters in a simple and systematic way [29, 30].
The aim of this study is to identify the optimum combination of PU surface density, PAMPS surface density, and GO content in order to produce breathable-windproof ENMs with the maximum order of tensile strength and WVP and the minimum order of air permeability (AP). Using RSM, the experimental condition was designed based on Box–Behnken designs (BBD) and the test was conducted. Based on the obtained results, some empirical regression models were proposed and the optimum production parameters were obtained. To validate the model, prediction values and experimental measurements of the samples, which were produced according to the optimum parameters, were compared.
Materials and methods
Materials
2-Acrylamido-2-methyl-1-propanesulfonic acid (AMPS, monomer) and potassium per sulfate (KPS, initiator) were purchased from Sigma–Aldrich (St Louis, MO, USA). N,N-di methyl formamide (DMF), tetra hydro furan (THF), concentrated sulfuric acid (H2SO4), hydrochloric acid (HCL), hydrogen peroxide (H2O2), sodium nitrate (NaNO3), and potassium permanganate (KMnO4) were purchased from Merck (Germany). Graphite was obtained from Daejong Co. (South Korea). PU was also obtained from Bayer (Germany).
GO and P(AMPS-GO) synthesis
GO nanosheets were prepared according to the modified Hummer method. In brief, graphite powder (2 g) and NaNO3 (1 g) were added into H2SO4 (46 mL) and stirred in a three-neck flask placed in an ice bath for 2 h. Then, KMnO4 (6 g) was added gradually under stirring and the temperature of the mixture was kept below 20℃. The solution was heated to 35℃ and kept for 2 h. After that, distilled water (92 mL) was slowly added and the temperature was kept below 100℃. After 15 min, an adequate amount of distilled water and 5 mL of 30% H2O2 solution were added to wash the residual KMnO4. Finally, the mixture was filtered and washed with 5% HCl aqueous solution and water until the PH value of the upper layer suspension reached 7. Furthermore, sonication with a cylindrical tip was used for exfoliation of graphite oxide to GO. The sonication process was carried out in room temperature (25℃) for 20 min.
PAMPS was synthesized according to the procedure reported previously [26]. In brief, AMPS (17.031 g) and DMF (40.623 g) and a desired amount of GO were placed into a three-necked round-bottomed flask (100 mL). Then, 0.190 g of initiator (KPS) was added under dry nitrogen atmosphere and the mixture was stirred for 10 h at 80℃ in water bath to form a 30% (w/w) PAMPS solution with different GO loading.
Electrospinning
Electrospinning conditions for PU and P(AMPS-GO).

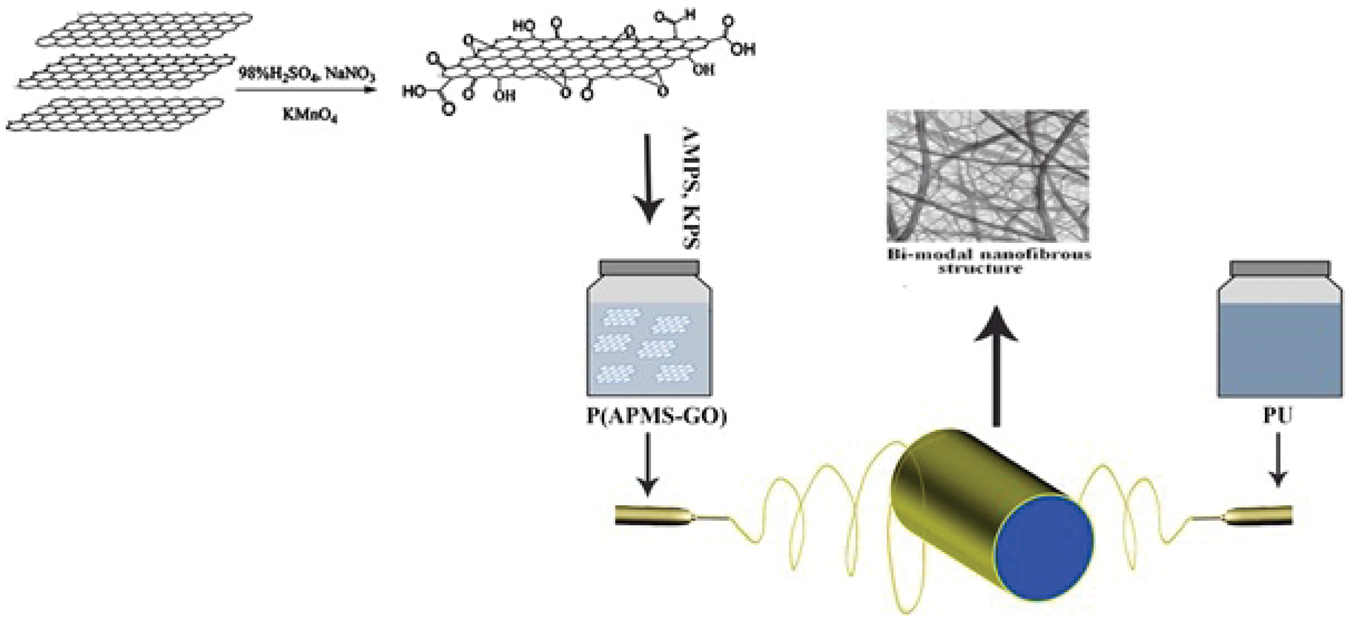
Schematic of synthesizing of P(AMPS-GO), electrospinning set up, and the resultant membrane.
Characterization
In order to determine the phase structure of the graphite and GO products, the X-ray diffraction (XRD) patterns were recorded using an INEL (Equinox3000, France) X-ray diffractometer with a Cu-Kα radiation (λ = 1.5418 Å) source. Transmission electron microscopy (TEM, Zeiss-EM10C) was used to study the morphology of the prepared GO, with an accelerating voltage of 80 kV. The morphology of the electrospun nanofibers was characterized using scanning electron microscopy (FEM-SEM, Mira3-XMU; SEM, Seron Technology, AIS2100; SEM, KYKY, EM3200). The mean fiber diameter and the diameter distribution were measured drawing on the SEM images. Using Image J software (National Institute of Health, Bethesda, MD), 100 spots in each sample were measured and reported.
WVP was measured using a tester M261 (Atlas, England) according to ASTM E 96-00.The ENMs were sealed into the mouth of cups with a 10 cm diameter containing 60 g of water. After 7 days, the WVP (g/m2.day) was calculated from the change in the cup weight according to equation (1)

Design of experiment by RSM

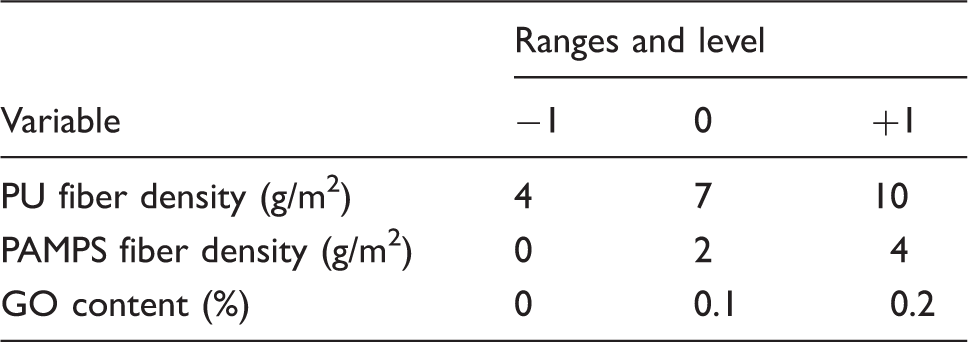
The range and code levels of variables for BWM.
The performance of the BWMs has been evaluated by parameters of WVP, tensile strength at break, and AP. On this basis, the optimum performance of BWMs has been defined with regard to maximum WVP and tensile strength at break and the minimum of AP. The regression analysis was performed to obtain optimum conditions as a second-order polynomial (equation (3))

Results
Analysis of P(AMPS-GO)nanocomposite
Figure 2 shows the XRD patterns of graphite, GO, and PAMPS-GO before and after electrospinning. The (002) diffraction peak of graphite appeared at 2θ = 26.61°, corresponding to a lattice spacing of 0.33 nm. After oxidization, the (002) diffraction peak of GO shifted to 2θ = 8.670, indicating an interlayer spacing of 1.01 nm. The increasing lattice spacing in GO compared to that of graphite indicates exfoliation of graphite during the chemical modification process [29]. In order to better demonstrate the morphology and dispersion of GO, TEM measurements were performed. Figure 3 shows TEM images of GO with different magnifications. According to TEM images, the GO nanosheets are transparent which indicating that the GO nanosheets are fully narrow. In general, GO nanosheets tend to assemble with each other and form a multilayer agglomerate. However, different TEM images of GO nanosheets reveal that the sheets were completely dispersed and isolated in water.
XRD patterns of graphite and GO. TEM images of GO with different magnifications (a, b) and FESEM of GO which is embedded in a nanofibrous. mat.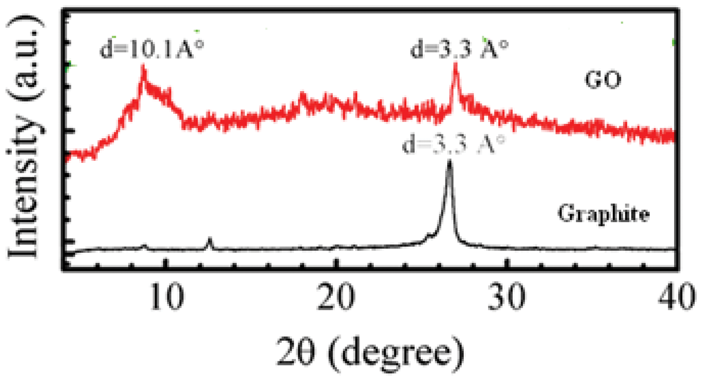

Morphology of ENMs
Figure 4 shows the SEM images and distribution of the electrospun PU nanofibers, PAMPS nanofibers and simultaneous electrospun PU and PAMPS nanofibers. The bimodal fiber diameter distributed PU/P (AMPS-GO) nanofibrous mats were produced successfully. According to the images, the mean diameter of PU nanofibers did not change significantly, but the mean diameter of PAMPS nanofibers dropped from 125 nm to 87 nm, when electrospinning was performed at the same time. The presence of PU network, which prevents the deformation of PAMPS nanofibers, accounts for the drop in the mean diameter of PAMPS nanofibers.
The morphology of nanofibers (left) and corresponding fiber diameter distribution (right). (a) PU, (b) PU/PAMPS, (c) PAMPS.
BWMs performance functions
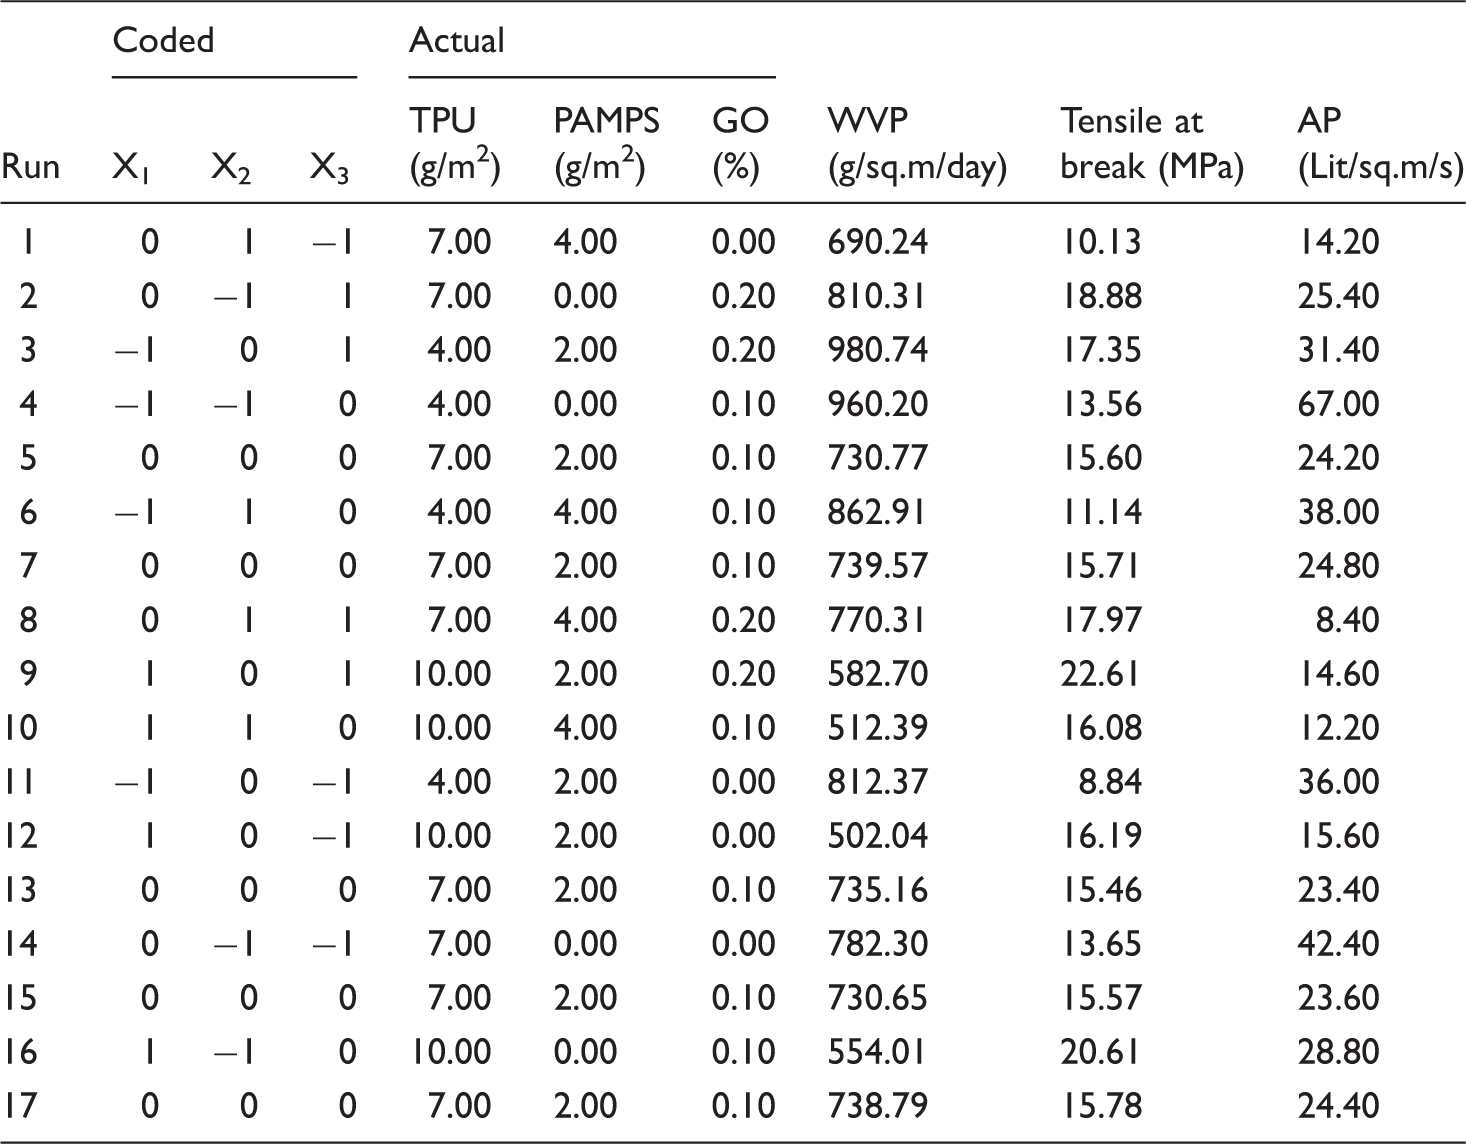
RSM test plan and corresponding BWMs performance features.
With regard to equation (3), the primary quadratic regression model for WVP (Y1) in terms of coded factors is given by equation (4)


As shown in equation (5), the WVP of membranes (Y1) is largely affected by PU coverage density (x1). A plot of experimental results and RSM predicted values is shown in Figure 5. The gradient of 1.0 for WVP reveals that the quadratic model successfully predicted the WVP of BWMs with high accuracy.
The predicted versus actual response for WVP.
The primary empirical models for tensile strength at break and AP (containing significant and insignificant terms) are provided in the online supplementary information, equations (S1) and (S2). The regression models for tensile strength at break (Y2) and AP (Y3), considering the significant terms, is given by equations (6) and (7):

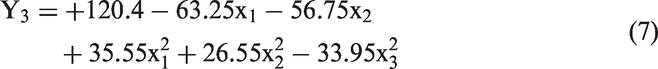
From equation (6), it can be inferred that as PU fiber density (x1) and GO loading (x3) increase, so does tensile strength at break (Y2). Unlike WVP, it was found that interaction effects are also significant terms in tensile strength at break. As shown in equation (7), PU (x1) and PAMPS (x2) coverage density are the dominant factors in AP (Y3) of membranes. Because of the small amount of GO loading (smaller than 0.2%), the effect of GO (x32) can be dismissed as insignificant.
Also plots of experimental and RSM predicted values for tensile strength at break and AP (Figure 6) suggest that the quadratic model successfully predicted the response.
Plot of the predicted versus actual response for (a) tensile strength at break and (b) air permeability.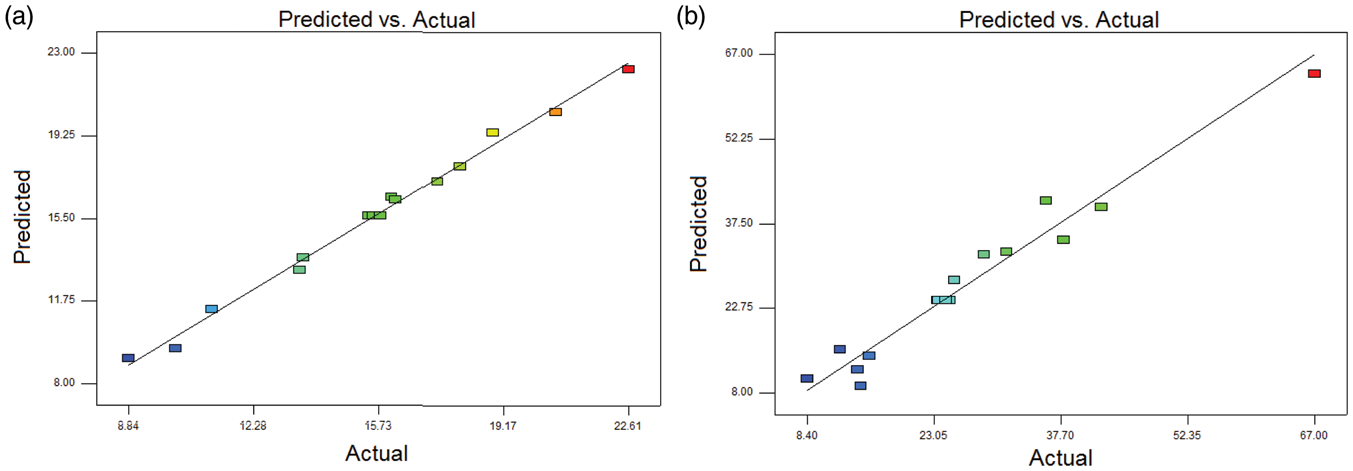
Discussion
The macro physical and mechanical behaviors of electrospun nanofibrous structures are determined by a composition consisting of their microstructures. The obtained empirical models (equations (5), (6), and (7)) help us better understand how membrane features (WVP, AP, and tensile strength at break) are affected by independent variables (PU coverage density, PAMPS coverage density, and GO loading). Figure 7 shows the WVP fluctuations with regard to the variation of PU fiber coverage density (A), PAMPS fiber coverage density (B), and GO loading (C). This plot can be used for comparing the effect of a variable on the WVP when one variable changes while the others remain constant.
Perturbation plot for water vapor permeability (g/sq.m/day).
As shown in Figure 7, the WVP of the membranes declined as PU and PAMPS fiber density increased. This finding is in complete agreement with the finding reported by Hajiani et al. [31], according to which an increase in the thickness of nonwovens leads to a reduction in WVP through the pores. PAMPS fiber density has less effect on WVP variations than PU fiber density. The fiber diameters play a key role in transport properties of ENMs. This can be attributed to the hydrophilic-hydrophobic property of two different fibers. The hydrophobic body of a PU nanofiber mat acts as barrier in the way of water vapor molecules, impeding their free movement and progress, changing their course into convoluted pores and finally preventing and delaying water vapor permeations. Furthermore, thanks to their hydrophilicity, PAMPS nanofibers have the ability to absorb water vapor molecules and pass them via a solution diffusion mechanism [32]. Therefore, PAMPS density does not play a significant role in effectively alleviating water vapor transfer. It has been seen that as GO loading increases, so does the WVP of the membranes. During the synthesizing of GO from graphite parents, many hydrophilic groups like epoxy, hydroxyl, and carbonyl are formed on the surface of GO nano sheet [17]. These hydrophilic groups accelerate the movement of water vapor molecules.
From Figure 8, it can be inferred that the PU fiber density has a positive synergic effect on tensile strength at break when coupled with GO loading. However, PAMPS nanofiber density has a negative effect on membrane strength. The strength of ENMs is mainly influenced by point bonding between adjacent monofibers. Enhancing the PU fiber density led to an increase in the number of point bonding, which in turn reduces the weak point of the structure and subsequently improves its strength. Large aspect ratio of GO nanogalleries, good dispersion of GO in the PAMPS matrix and the strong interaction between GO and PAMPS chains enhanced the tensile strength at break of the ENMs. Adding only 0.2% of GO into membranes increased the tensile strength at break from 11.75 to 19.25 MPa, causing a 65% improvement of tensile strength at break. As previous studies report, GO is a good filler for increasing tensile strength [33]. PAMPS nanofiber has a high transition temperature and is classified as a breakable polymer. As PAMPS fiber density increased, elasticity of the structure decreased, the structure got more brittle and its tensile strength dropped. The PAMPS nanofibers with smaller fiber diameters in comparison with PU ones reduced the contact interface of adjacent nanofibers which led to a reduction in membrane strength. This finding is in complete agreement with those reported by Amini et al. [4].
Perturbation plots for tensile at break (MPa.)
It can be seen from Figure 9 that as both PU and PAMPS fiber density increased, AP reduced. The reduction in the AP of membranes immediately after an increase in fiber coverage density can be put down to the reduction of mean pore diameter and the subsequent rise in the tortuosity of the membranes. The result is in good agreement with previous works [5,9], which reported that as nanofiber surface density increased and/or as pore diameters decreased, AP decreased. GO loading affects the AP of the membranes. It appears that as GO loading increased, the fiber diameters decreased, in turn causing a reduction in pore diameters and subsequently in the AP of nanofibers.
Perturbation plot for air permeability(Lit/sq.m/s).
The desirability curves are plotted to determine the optimum level of variables for maximum response. The desirability function was applied to obtain the optimum values of the tree variables that provide the maximum performance of BWMs. During the optimization analysis, the responses, including the WVP and the tensile strength at break, were set at the maximum and AP was set at the minimum, then the values of the tree independent variables were set in the investigated range. The coexistence of 6.07 g/m2 of PU fiber coverage density, 2.40 g/m2 of PAMPS fiber coverage density and 0.2% of GO loading, causing the best performance of BWMs with the highest desirability of 0.76, can be defined as the optimum condition. The three-dimensional (3D) response surface plots, as shown in Figure 10, are graphical representations of the maximum BWM performance.
3D surface (left) and 2D (right) plot of desirability for the conditions found via numerical optimization (GO loading adjusted at the constant value of 2%).
Comparison between the prediction and the experimental measurements of parameters in the optimum condition.

Conclusion
In this paper, a response surface model based on the BBD technique was used for modeling and predicting BWM performance including AP, WVP, and tensile strength at break. Three independent variables, that is, PU, PAMPS fiber coverage density, and GO loading, were analyzed at three different levels. Regarding statistical analysis, ANOVA showed R2 = 0.99 for WVP, R2 = 0.99 for tensile strength at break and R2 = 0.96 for AP, which ensures an excellent validity of the model with experimental data. The results show that PAMPS nanofibers can prevent air while enabling WVP. For BWMs to perform at their best, numerical optimization was performed. Therefore, the region in design space was obtained considering the desirability function. Based on the results, the optimum conditions means the coexistence of PU fiber coverage density of 6.07 g/m2, PAMPS fiber coverage density of 2.40 g/m2, and GO loading of 0.2%, created with desirability of 0.76. The developed RSM model can be used for designing of BWMs for different atmospheres conditions.
Footnotes
Acknowledgements
The authors would like to acknowledge Dr Soghra Ramazani for plotting some figures and also they thank Mrs Zahra Tafazoli for drawing schematic images of this paper.
Declaration of Conflicting Interests
The author(s) declared no potential conflicts of interest with respect to the research, authorship, and/or publication of this article.
Funding
The author(s) received no financial support for the research, authorship, and/or publication of this article.