
Abstract
Amorphous carbon fiber from polyamide 6 (PA6) precursor was produced using a multi-step procedure consisting of oxidative stabilization in air at 180℃ in the presence of cupric chloride impregnation, pre-carbonization at 250℃ and carbonization at temperatures ranging from 500℃ to 1000℃ in nitrogen. The results obtained from thermal analysis data suggested that cupric chloride impregnation enhanced thermal stability. During the oxidative stabilization process, a polymorphic structure consisting of α- and γ-phases was eliminated due to the decrystallization process. The pre-carbonization step was found to be necessary to enhance the thermal stability of oxidatively stabilized PA6 fiber prior to carbonization. The results suggested that the pre-carbonization step improved the aromatization and crosslinking reactions. The results obtained from the experimental data suggested that the carbonization temperature had an effective role on the molecular structure and properties of the resulting carbon fibers. The carbon fibers obtained from stabilized and pre-carbonized PA6 fibers showed physical and structural changes with rising temperature. They were characterized by a reduction in fiber diameter, linear density, carbon fiber yield, hydrogen and nitrogen content values due to the removal of non-carbon elements together with increases in the values of density, crystallite thickness, carbon content, C/H ratio and electrical conductivity values. The results obtained from X-ray diffraction, IR spectroscopy and elemental analysis suggested that the crystalline structure was totally lost and converted to a carbonized structure at 500℃ and above due to the formation of an amorphous carbon structure during carbonization reactions.
Keywords
Introduction
Carbon fiber is nowadays regarded as a new generation of high performance material due to its highly desirable properties such as low density, high specific strength, high stiffness, dimensional stability, low coefficient of thermal expansion, biological compatibility and fatigue resistance [1–3]. It is also an ideal material of choice in today’s world of high fuel consumption and environmental pollution concerns [4].
During the last few decades, an ever increasing interest was observed in the research and development of carbon fibers manufactured through the chemical pretreatment of precursor fibers with metal salts. For example, Cobalt (II) sulfate [5] pretreatment of PAN precursor fibers is reported to cause a 20℃ reduction of the temperature during cyclization reactions and also an enhancement in the mechanical properties of the final carbon fiber. It seems that cobalt sulfate acts as a catalyst by accelerating the formation of ladder structure.
The interaction between metal salts and the amide groups of polyamides provided new opportunities to improve their structure and properties. The functional amide groups of polyamides demonstrate a considerable capability to form complexation with metal ions [6].
Several transition metal and alkali metal salts were reported to form coordination bonds with the amide group of aliphatic polyamide 6 [7–10]. The formation of complexation was reported to result in major structural changes such as the melting temperature, crystallization [7,8], glass transition point [9] and electrical conduction [10].
Electrospun nanofibers of PA6 [11] prepared in the presence of cupric chloride (CuCl2) showed the formation of complexation behavior. It is shown that by doping higher concentration of cupric chloride up to 40%, the DC resistance decreased to 42.3 MΩ indicating increased conductivity. The researchers in the USA [12] reported the preparation of porous PA6 nanofibers in the presence of gallium trichloride (GaCl3) using electrospinning method. Porosity seems to be obtained by removal of GaCl3 after soaking the electrospun PA6 nanoweb in water for 24 h. It seems that the average surface area increased by more than a factor of 6 for the regenerated fibers [12]. Wei et al. [13] reported the preparation of PA6 fibers with improved mechanical properties by blending calcium chloride (3 wt.% optimum) in the polymer melt prior to extrusion and stretching.
Recently, studies on the complexation of polyamide 66 (PA66) with gallium trichloride (GaCl3) were reported with the aim of improving the mechanical properties. Complexation of gallium trichloride with PA66 fibers resulted in the loss of hydrogen bonds between the polymer chains. The complete elimination of hydrogen bonds allowed high draw ratios between 7 and 13 under low strain rate stretching. Using this procedure, PA66 fibers acquired a tensile modulus of up to 13 GPa compared to a tensile modulus of 5 GPa for commercial PA66 fibers [14–16].
Aromatic polyamide (aramid) fibers were also taken into consideration by several investigators for the formation of carbon fibers [17–21]. The idea behind using aramid fibers was to bypass the thermal stabilization step normally applied for fibers with low thermal stability and low melting temperatures. Direct carbonization is only needed to prepare carbon fibers from such aramid precursors. Poly(p-phenylene terephthalamide) fiber with a high thermal stability has been utilized for preparing carbon fiber through direct carbonization process [17–19]. Poly(meta-phenylene terephthalamide) fiber has also been used to prepare carbon fiber [20] and activated carbon fiber [21] by going through the direct carbonization step without thermal stabilization. In the case of activated carbonization process, phosphoric acid was employed as chemical activation agent after the carbonization stage [21].
Aliphatic polyamide [22–25] fibers were also utilized as precursors for the preparation of carbon fibers. Aliphatic polyamides (PA6 and PA66), due to their low thermal stability, must go through the thermal stabilization and carbonization steps for manufacturing carbon fiber. Irradiation crosslinking of polyamide 6 (PA6) fibers in the presence of trimethallyl isocyanurate (TMAIC) and trimethyolpropane trimethacrylate (TMPTMA) was performed. The results suggested crosslinking of PA6 fibers efficiently. The highest gel content was obtained with a high dose rate of 10 kGy/h [26]. Electron beam-promoted crosslinking of PA6 in the presence of triallyl cyanurate was reported to improve thermal stability [27]. Improvement of the thermal stability of PA6 was also reported by utilizing biphenol monoacrylate in combination with a hindered phenolic antioxidant system [28].
Butanetetracarboxylic acid (BTCA) and sodium hypophosphite were used to crosslink PA6 knitted fabric resulting in increased thermal stability [29]. Electron beam irradiation of PA66 at different doses caused an increase in the degree of crosslinking together with the formation of chain scission [30,31]. Chemical crosslinking in the presence of formaldehyde and thiourea for PA66 filaments was also reported [32].
At present, commercially produced carbon fibers are too expensive for wide-scale applications in the automobile and construction industries. It seems that the precursors contribute to the largest proportion of the total cost of carbon fiber manufacturing. In the case of PAN-based carbon fiber cost breakdown, precursor is reported to contribute as much as 50% of the total cost of the production [33]. As a result, new low cost carbon fiber precursurs are urgently needed with the aim of reducing the carbon fiber manufacturing cost.
In the present work, textile grade polyamide 6 fiber is suggested as an alternative precursor for the production of carbon fiber, due to its relatively high carbon content (theoretical carbon content of 63.7%), ready availability in world markets, lower cost, recyclability and easy processability. According to the latest published figures [34], the latest polyamide fiber world production in 2012 stood at 4.0 million tons per annum for filaments and staple fibers. This figure is considered to be much higher than the annual production rate of polyacrylonitrile fibers. By the end of 2012, acrylic production of filaments and staples stood at 1.9 million tons per annum [34].
Apart from the studies mentioned above, no further research seems to have been carried out so far regarding the influence of cupric chloride impregnation on the thermal stabilization and carbonization behavior of polyamide 6 fibers. Therefore, a detailed research work was performed on the use of cupric chloride pretreatment with the aim of performing the thermal stabilization and carbonization steps. During the course of the present study, the use of PA6 fiber is suggested as a possible new precursor for the production of carbon fiber.
The aim of the present investigation was to study the carbonization behavior of stabilized PA6 fibers impregnated with cupric chloride solution. The structure and properties of stabilized, pre-carbonized and carbonized samples were characterized using a combination of fiber diameter, linear density, carbon fiber yield, volume density, elemental analysis, X-ray diffraction, IR spectroscopy and electrical conductivity measurements with the aim of monitoring and following the structural changes taking place as a function of carbonization temperature.
Experimental
Preparation of stabilized and carbonized samples
PA6 multifilament yarn was produced for textile applications with a linear density of 8.53 tex per 68 filaments. Single filament is produced with a circular cross section by the filament manufacturer (SIFAŞ AŞ, Bursa, Turkey). Untreated PA6 multifilament yarn has undergone a treatment with a 5% (v/v) aqueous ethanol solution for 30 min at 50℃ to remove the impurities present on the surface of the fibers followed by a thorough washing under running water for 30 min to remove the final remains. Chemical impregnation was performed by impregnating the samples in a 3% (w/v) cupric chloride solution at 90℃ for 1 h. This temperature is used improve the wetting and absorption. The pretreatment solution showed a pH value of 2.38 at 90℃. Cupric chloride (99% purity) was bought from Merck (Germany). Following the immersion of the samples, each sample was taken out and the excess solution was removed with a towel and dried at 50℃ for 24 h. The pretreated PA6 contained 7.7% (w/w) cupric chloride on a dry basis. The samples were wound onto stainless steel rectangular frames with the aim of constraining the samples to prevent the loss of molecular orientation and also to prevent physical shrinkage. Stabilization was subsequently performed at an isothermal temperature of 180℃ for various periods of time in an air circulating atmosphere. Thermal stabilization at 180℃ was chosen to prevent thermal damage due the the fact that PA6 melts at 219℃. Thermal stabilization was performed at a heating rate of 1℃/min. Slower heating rate will increase the time and the cost of the experiment. Pre-carbonization was performed in nitrogen atmosphere at 250℃ for 0 h, 2 h and 4 h, respectively. Carbonization was performed in a tubular furnace (PROTHERM, ANKARA) with a 50 mm diameter. Under normal circumstances, nitrogen gas (99.999% purity) flow rate was adjusted to 200 mL/min. Carbonization was performed at temperatures between 500 and 1000℃ in steps of 100℃ for a residence time of 15 min in each case.
Data collection
Measurement of the diameter of the stabilized, pre-carbonized and carbonized fibers was carried out with the help of a polarizing microscope (Nikon ME600L, Japan) containing a calibrated eye piece. Twenty filaments were utilized for the diameter measurements. Fiber diameter was measured at 20 points along the length of each filament.
Determination of the linear density was performed by measuring the weight in grams per unit length of a multifilament bundle. In the present study, tex is used as a linear density defined as the weight of a multifilament bundle in grams per 1000 m. The linear density values listed in Table 2 are the average of five readings.
The volume density was measured using a density gradient column working at 23 ± 1℃ using perchloroethylene (ρ = 1.61 g/cm3) and isopropyl alcohol (ρ = 0.77 g/cm3). Density column was utilized for the measurement of the density of the original PA6 fiber, the sample stabilized at 180℃ for 12 h and the samples pre-carbonized at 250℃. The solution prepared from ethylene dibromide (ρ = 2.91 g/cm3) and perchlorethylene (ρ = 1.61 g/cm3) was used for the volume density measurements of the carbon fiber samples prepared between 500 and 1000℃. Volume density values listed in Table 2 are the average of five readings.
Elemental analysis for C, H, N and C/H ratio was performed by combustion in a LECO® TruSpec Micro Elemental Analyzer (Leco Corp., USA). The samples were combusted in the heated, oxygen-rich environment. Acetanilide was used for the calibration of the carbon, hydrogen, nitrogen and C/H content measurements.
The wide-angle X-ray diffraction data (XRD) were acquired using a Bruker® AXS D8 Advance X-ray diffractometer system employing nickel filtered CuKα radiation (wavelength of 0.15406 nm). XRD data were acquired at 10 steps per degree. The equatorial X-ray diffraction data for the carbon fiber samples were obtained in reflection mode in the 5–35° 2θ range, respectively. The X-ray diffraction data of pure PA6, oxidatively stabilized, pre-carbonized and carbonized samples were obtained in the 5–35° 2θ range, respectively. Correction for the Lorentz and polarization factors was performed for the collected XRD data [35].
Seiko DSC-6200 EXSTAR system was employed for differential scanning calorimetry (DSC) work. A typical sample weight of approximately 5 mg was used during the collection of DSC thermograms. A heating rate of 10℃/min and an upper temperature range of 500℃ were employed. Indium (m.p. 156.6℃ and ΔH = 28.45 J/g) and zinc (m.p. 419.51℃) standards were employed for the calibration of heat flow and temperature measurements. A nitrogen flow rate of 50 mL/min was employed during the collection of DSC thermograms.
A Perkin Elmer Diamond Thermogravimetric/Differential Thermal Analyzer (TGA/DTA) was employed for the Thermogravimetric Analysis (TGA) work. Typical sample weights used were around 4–6 mg. A heating rate of 10℃/min and an upper temperature range of 1200℃ were utilized during the experimental work. TGA work was performed under a nitrogen flow rate of 200 mL/min.
Infrared measurements were performed utilizing a Perkin Elmer® Spectrum 400 FT-IR spectrometer using a single reflection diamond based GladiATR® model ATR attachment in absorbance mode. Fifty interferograms were collected, averaged and transformed with a medium Norton-Beer apodization function. A 2 cm−1 resolution and 4000–400 cm−1 mid-IR range were selected during the experimental work.
A DC four-point probe method was used for all the electrical measurements of the samples. A four-point probe measurement is carried out by positioning four electrical probes onto the sample surface area. Two of the probes are employed to provide current and the other two probes are utilized in the measurement of voltage. The advantage of using this method is that this removes the measurement errors due to probe resistance, the spreading resistance, and the contact resistance between each metal probe and the material [36,37]. The measurements were always performed at room temperature [37]. The average electrical properties were based on at least 15 measurements.
Experimental data analysis
Determination of DSC crystallinity
The degree of DSC-crystallinity is calculated from the melting enthalpy values employing equation (1)
Determination of stabilization index from DSC experiments
The DSC-based stabilization index is calculated using equation (2) [39]

X-ray data-curve fitting
All the X-ray diffraction profiles acquired from the stabilized and carbonized samples were resolved according to a curve fitting procedure developed by Hindeleh et al. [35] to separate the complicated overlapping profiles. Each curve is assumed to contain combination of Gaussian and Lorentzian functions. Curve fitting of the X-ray diffraction profiles was performed using a linear baseline. The region below the baseline is assumed to be based on an instrumental background signal which may consist of air and incoherent scattering.
Calculation of apparent crystallite size
The peak widths at half-height were corrected according to a deconvolution precedure developed by Stokes [40]. The apparent crystallite size, for a given reflection, was determined using the Scherrer equation (3)
Results and discussion
Our previous study [41] reported the impregnation of PA6 precursor fiber with cupric chloride solution followed by oxidative stabilization in air at 180℃. Figure 1 shows the procedure used during the preparation of PA6-based carbon fiber. In the present study, we have repeated the oxidative stabilization of PA6 in air at 180℃ with stabilization times of 1/4, 4, 8 and 12 h, respectively (Table 1) for the sake of completeness. In the present study, it was found that the cupric chloride impregnation followed by oxidative stability at 180℃ for 12 h caused a reduction in the melting temperature of pure PA6 from 219℃ to 196.4℃ (Table 1, Figure 2(b)). This sample was also characterized by a DSC stabilization index of 91% (Table 1). When the sample stabilized in air at 180℃ for 12 h was carbonized at 500℃, it was found to be extremely thin and fragile. However, although the DSC stabilization index of oxidative stabilization was high (i.e. 91%), it was found that stabilization at 180℃ for 12 h was not sufficient on its own, in terms of thermal stability, to resist high carbonization temperatures. This result suggested that a further heat treatment in a nitrogen atmosphere was necessary to prepare the stabilized sample for high carbonization temperatures without too much weight loss. The second heat treatment was carried out in an ultra pure nitrogen atmosphere at 250℃ for 0 h, 2 h and 4 h, respectively, with a heating rate of 1℃/min. To make a final decision on the residence time for the samples prepared during the pre-carbonization step, the fiber diameter, linear density and volume density of the resulting samples were measured and compared in Table 2.
Flow chart for the production of polyamide 6-based carbon fiber. DSC thermograms of (a) untreated PA6; (b) oxidatively stabilized sample at 180℃ 12 h, (c) pre-carbonized sample at 250℃ 4 h and (d) carbonized sample at 500℃ 15 min. Thermal properties obtained from DSC scans for the untreated and oxidatively stabilized polyamide 6 fibers.


The results listed in Table 2 show that the fiber diameter and linear density values at 250℃ decrease with rising residence time from 0 to 4 h, whereas the volume density values first decrease from 1.303 to 1.270 g/cm3 when the residence time was increased from 0 to 2 h. In addition, the volume density of the sample with the residence time of 4 h was found to be increased from 1.27 to 1.35 g/cm3. This suggests that the samples went through a loss of density due to the ongoing decrystallization effects, whereas the increase of density at 250℃ for 4 h to 1.35 g/cm3 suggests that densification due to crosslinking and possibly aromatization reactions took place. It has been reported in the published literature that density values between 1.34 and 1.39 g/cm3 should be obtained to produce PAN-based carbon fibers with high tensile strength. It has also been claimed that densities higher than 1.39 g/cm3 appear to introduce excessive microvoids into the carbon fibers, leading to decreased tensile strength [42]. The results suggest that the volume density value of 1.35 g/cm3 obtained from the pre-carbonization sample at 250℃ for 4 h appears to be the right value for further carbonization studies.
The DSC thermogram presented in Figure 2(c) shows that the melting endotherm of the pre-carbonized sample at 250℃ for 4 h completely disappears indicating the completion of decrystallization reactions and the acquisiton of full thermal stability. In terms of thermal stability, the sample which went through stabilization in air at 180℃ for 12 h followed by pre-carbonization at 250℃ for 4 h appeared to be the most suitable for further carbonization work.
In the carbonization step, the heating rates are crucial. The first region between 250 and 500℃ requires a low heating rate (i.e. less than 5℃/min) so as to make the mass transfer slow. A faster mass transfer at higher heating rates may cause surface irregularities in the form of pores due to the diffusion of gases [2]. In the second temperature region between 500 and 1000℃, higher heating rates can be used because of the reduced possibility of damage due to exothermic reactions or the evolution of volatiles since such reactions have already been completed by 500℃ in the case of the present study. Since a major weight loss occurs between 250 and 500℃ (Figure 3), a slow heating rate of 2℃/min was used to make mass transfer slow with the aim of avoiding excessive weight loss (Figures 1 and 3). Finally, carbonization between 500 and 1000℃ was carried out in steps of 100℃ at a heating rate of 5℃/min (Figures 1 and 3).
TGA thermograms of untreated (a) and cupric chloride pretreated and thermally stabilized PA6 fibers at 180℃ 12 h (b). Heating rate for the regions A, B and C is 1, 2 and 5℃/min, respectively.
To make a final decision on residence time for the carbonization study, the pre-carbonized sample was carbonized at 500℃ for residence times of 0 min, 15 min and 30 min, respectively. The carbonized sample was tested for linear density and volume density. Table 2 shows that the values of linear density decreased with rising residence time, whereas the volume density values increased from 1.585 to 1.635 g/cm3 when the residence time was increased from 0 to 30 min suggesting further densification and aromatization reactions. From this point onwards, an average value of 15 min was used as the residence time for the carbonization samples. The DSC thermogram presented in Figure 2(d) for the carbonization sample at 500℃ for 15 min suggests the completion of decomposition and intramolecular crosslinking reactions. As the temperature rises above 500℃, further atomatization and intermolecular crosslinking reactions are expected to take place.
Fiber diameter, linear density, carbon fiber yield, volume density
Figure 4(a) illustrates the relationship between carbon fiber diameter and carbonization temperature. The diameter of the carbon fibers decreases gradually with increasing carbonization temperature. The most significant reduction in the fiber diameter was recorded after a carbonization temperature of 1000℃ with approx. 51% loss in fiber diameter (Table 3) which occurred with respect to the untreated PA6 sample. The main reason for the severe reduction in fiber diameter is attributed to the weight loss which takes place due to the loss of non-carbon elements in the form of volatile products such as H2O, CO and CO2 during the oxidative stabilization, pre-carbonization and carbonization steps, respectively.
Variation of carbon fiber diameter (a) and percentage yield (b) as a function of carbonization temperature. Physical properties of oxidatively stabilized and pre-carbonized polyamide 6 fibers pretreated with 3% cupric chloride solution. Properties of carbonized polyamide 6 fibers as a function of carbonization temperature. Carbonization was carried out in nitrogen with a residence time of 15 min.

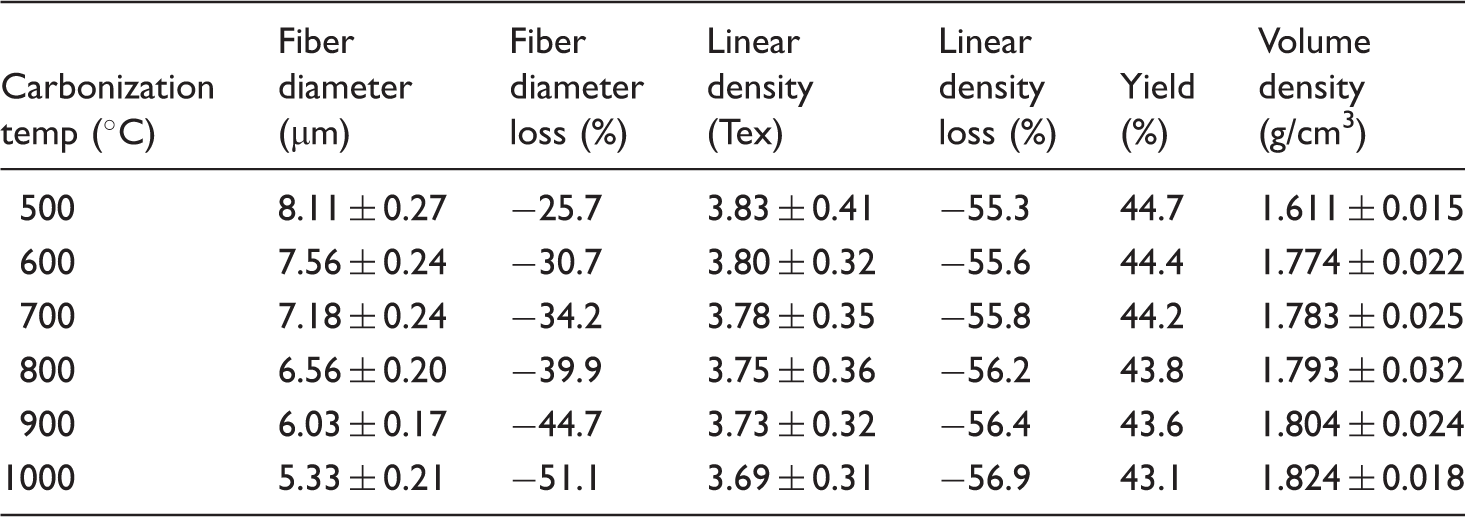
Table 3 summarizes the values of the linear density as a function of carbonization temperature. The linear density of the carbon fibers was reduced from 8.55 to 3.69 tex with a corresponding loss of 56.9% with respect to the untreated PA6 fiber when the carbonization temperature was increased from 500 to 1000℃ (Table 3). The reduction of linear density with carbonization temperature is related to the elimination of water, CO and CO2 occurring during the dehydrogenation reactions.
The values of carbon fiber yield taking account of the weight changes per unit length through the carbonization steps are listed in Table 3. The theoretical carbon yield is 63.7% for pure PA6. The results presented in Table 2 suggest that the carbon fiber yield is 96.4% for the oxidatively stabilized sample at 180℃ for 12 h. In the case of the carbonized samples, carbon fiber yield decreases from 44.7% to 43.1% with increasing temperature (Figure 4(b)).
Volume density is believed to be a good indicator of the extent of stabilization and carbonization reactions. Tables 2 and 3 show the volume density values of the oxidatively stabilized, pre-carbonized and carbonized samples as a function of carbonization temperature. The density of pure PA6 fiber was determined to be 1.139 g/cm3. The density of the oxidatively stabilized sample at 180℃ for 12 h was found to be 1.331 g/cm3. The density values of the carbonized samples increased from 1.611 to 1.824 g/cm3 when the temperature was increased from 500 to 1000℃ (Table 3). The increase in density values with temperature is due to the formation of carbon basal planes in the fiber during the carbonization reactions. In the case of PAN-based carbon fibers, when the stabilized fiber is composed completely of ladder polymers, the density was reported to be near 1.6 g/cm3 [42]. Therefore, the formation of carbon basal planes in the stabilized/pre-carbonized fiber during the carbonization process will cause increases in the density values of the resulting carbon fibers [43].
It seems that a similar carbonization mechanism seems to take place in the case of the carbon fibers produced from the oxidatively stabilized and pre-carbonized PA6 fibers. The increase in density with increasing temperature also confirms the condensation of molecular chains, caused by the formation of extensive intermolecular crosslinks or the evolution of a highly aromatic structure in the carbonized fibers. The increase in density values with progressing temperature is also attributed to the loss of non-carbon elements from the samples as a result of aromatization reactions taking place as well as the broadening and lengthening of the carbon basal planes.
Elemental analysis
Elemental analysis was performed to evaluate quantitatively the change in concentration of carbon, hydrogen and nitrogen elements and carbon to hydrogen (C/H) ratio as a function of carbonization temperature. The results of the analysis of elemental composition of the carbon fibers during the carbonization stage are presented in Figure 5(a) to (c). The carbon content of the carbon fibers increased gradually from 62.3% to 72.9% as the carbonization temperature rose, as shown in Figure 5(a), whereas the content of hydrogen and nitrogen gradually decreased with a rise in carbonization temperature, as shown in Figure 5(b) and (c). The C/H ratio was also found to increase from 23 to 77.5 with rising temperature.
Elemental composition of carbon fibers (a) carbon content (%); (b) hydrogen content (%); (c) nitrogen content (%).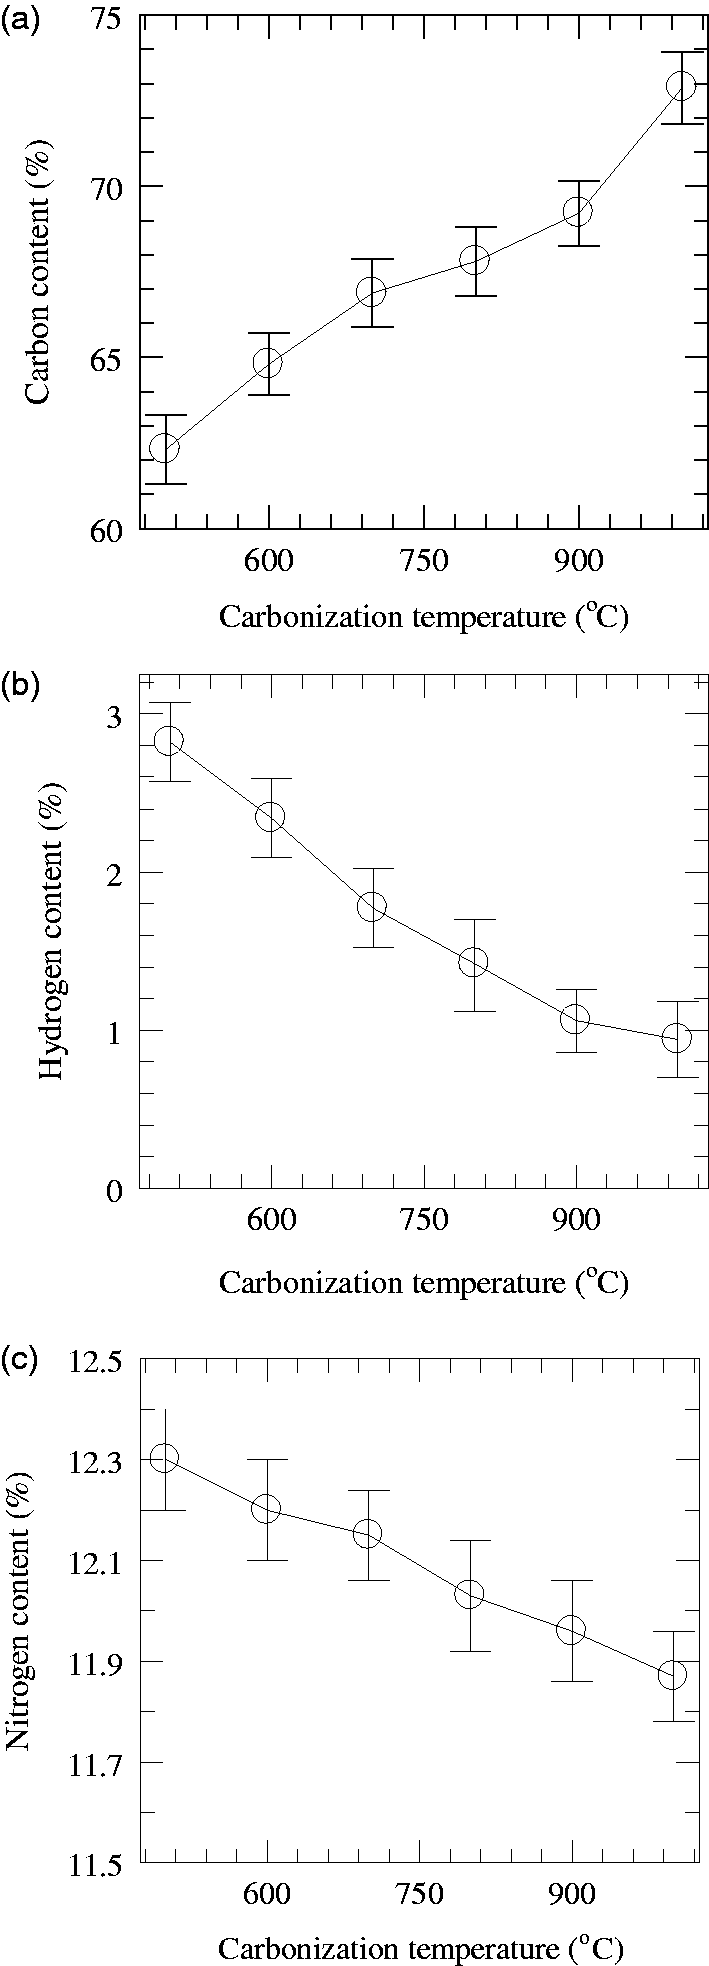
As shown before from the measurements of linear density, weight loss occurs during the carbonization reactions. The non-carbon elements are eliminated as volatile products, such as H2O, CO, CO2, and H2, to give a carbon fiber yield of 43.1% at 1000℃ (Table 3). At carbonization temperatures of 500–1000℃, the hydrogen content shows a gradual decrease, due to extensive dehydrogenation reactions, as shown in Figure 5(b). After the carbonization temperature of 1000℃, the hydrogen content decrease becomes less significant. During carbonization reactions, hydrogen content decreased from 2.8% to 0.9% when the temperature increased from 500℃ to 1000℃.
It is suggested that at the carbonization temperature of 500℃ and above, the carbon basal planes incorporating intermolecular and intramolecular crosslinked chains after oxidative stabilization at 180℃ for 12 h and pre-carbonization at 250℃ for 4 h appear to be crosslinked further and resulted in the formation of volatile products in the form of H2O, CO, CO2 and H2. Elimination of non-carbon elements resulted in the lengthening, broadening and thickening of the carbon basal planes formed from ladder polymers. The formation of such a structure enhances the formation of more basal planes, which is expected to eventually result in the improvement of the tensile properties of the final carbon fibers.
X-ray diffraction
The curve-fitted equatorial X-ray diffraction trace of untreated PA6 fiber presented in Figure 6(a) demonstrates the presence and coexistence of a polymorphic structure containing α and γ-crystalline forms along with an amorphous phase. Qualitative inspection of the equatorial X-ray diffraction trace of PA6 fiber shows three strong and well-defined reflections with d-spacings of 0.436, 0.413 and 0.378 nm which can be indexed as the α-form (200), γ-form (200) and α-form (002/202) reflections (Figure 6) [41].
Equatorial X-ray diffraction traces of untreated PA6 (a), 3% CuCl2 impregnated PA6 sample oxidatively stabilized in air 180℃ for 12 h (b) and oxidatively stabilized sample pre-carbonized in nitrogen at 250℃ for 4 h (c).
Cupric chloride impregnation followed by stabilization in air at 180℃ for 12 h seems to have a significant effect on the crystal structure of the PA6 fibers in terms of the degree of apparent crystallinity. The qualitative inspection of equatorial X-ray diffraction traces (Figure 6(b) and (c)) showed the loss of apparent crystallinity in terms of the loss of lateral order with stabilization in air at 180℃ for 12 h. It seems that a typical decrystallization (i.e. amorphization) process caused by the loss of hydrogen bonds occurred during the oxidative stabilization process [41].
The results demonstrated that a typical decrystallization (i.e. disordering) process seems to have occured during the stabilization and pre-carbonization processes. The X-ray diffraction trace of the sample pre-carbonized at 250℃ for 4 h in nitrogen atmosphere (Figure 6(c)) was characterized by a broad scatter indicating total loss of order.
Figure 7 shows the equatorial X-ray diffraction traces of carbonized PA6 fibers as a function of carbonization temperature. The X-ray diffraction traces presented in Figure 7 show characteristic broad diffraction peaks suggesting the presence of amorphous carbon basal planes. The peak position moves to higher scattering angles and becomes slightly narrower with increasing carbonization temperature indicating the growth of disordered graphene layers. These layers are similar to graphitic crystallites but are not stacked in any particular sequence; they are known as turbostratic carbon crystallites forming amorphous carbon structure [44]. The X-ray diffraction traces plotted in Figure 7 are resolved to obtain precise peak parameters in terms of peak position, peak intensity, and half-height width. A typical peak resolution is shown in Figure S1 for the sample carbonized at 1000℃ for 15 min.
Equatorial X-ray diffraction traces of carbonized fiber samples as a function of carbonization temperature. (a) 500℃; (b) 600℃; (c) 700℃; (d) 800℃; (e) 900℃ and (f) 1000℃.
Analysis of equatorial X-ray diffraction traces of carbonized polyamide 6 fibers pretreated with 3% cupric chloride solution as a function of carbonization temperature.
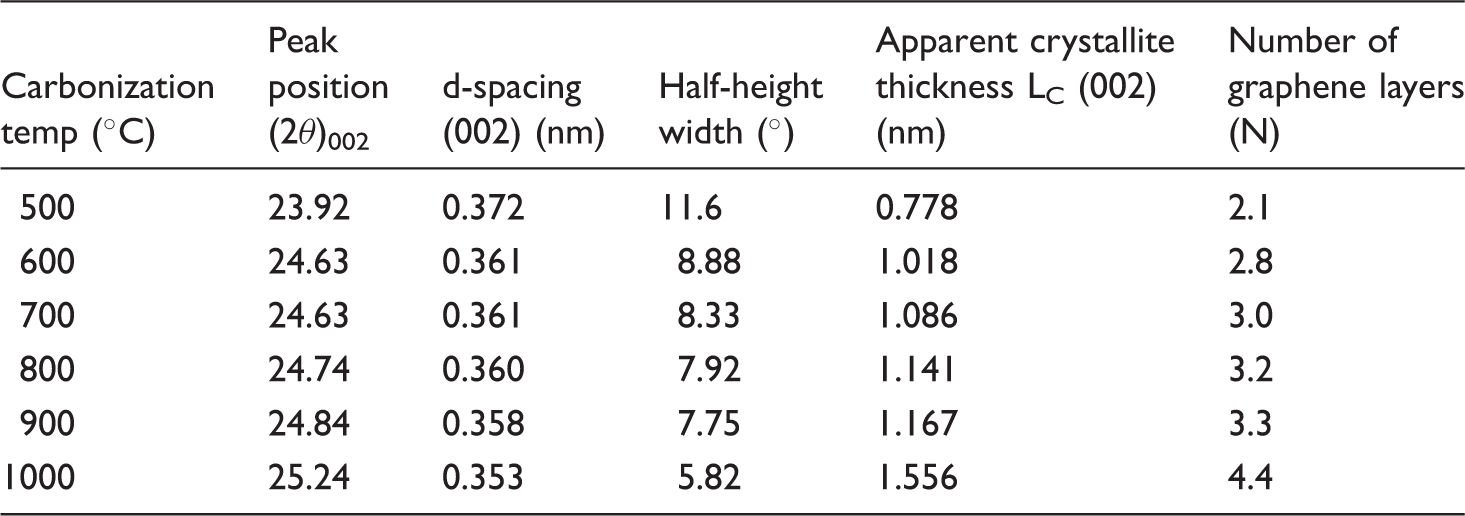
The half-height width of the same peak after instrumental correction was used to evaluate the apparent crystallite thickness (Lc). The results indicate that the apparent crystallite thickness grows from 0.778 to 1.556 nm with increasing carbonization temperature. Growing crystallite thickness (Lc) corresponds to an increase in graphene layers (Lc/d002) from 2.1 to 4.4 when the carbonization temperature of 1000℃ was reached (Table 4).
Infrared spectroscopy
During the present investigation, mid-IR spectroscopy was employed to follow and monitor the structural changes occurring during the oxidative stabilization, pre-carbonization and carbonization steps. The IR spectra of untreated (pure) and cupric chloride impregnated PA6 fibers stabilized in air at 180℃ for 12 h are presented in Figure 8(A) and (B) in the 4000–850 cm−1 range. Following the cupric chloride impregnation and oxidative stabilization in air atmosphere, the IR spectra of the stabilized samples showed detectable intensity transformations, especially the bands associated with the hydrogen bonded NH and methylene (CH2) stretching vibrations in the 3400–2800 cm−1 region (Figure 8(A)). The IR spectra of the stabilized PA6 fibers exhibited the formation of a broad ‘free NH’ band between the 3600 to 3350 cm−1 region. The presence of free N–H bands is attributed to the complexation of cupric ions with the carbonyl (C = O) oxygen atom of the amide group (Figure 9).
Infrared spectra of untreated (a) and cupric chloride-impregnated PA6 fibers stabilized in air at 180℃ for 12 h (b). The 4000–2500 cm−1 region (A) and 2000–850 cm−1 region (B). (a) Hydrogen-bonded sheet structure in polyamide 6 and (b) non-hydrogen bonded structure of the polyamide 6-cupric chloride complex.

When the cupric ions form complexation with the carbonyl oxygen, hydrogen bonds between the polymer chains become loose and the NH bonds become free [45]. Following the stabilization in air at 180℃ for 12 h, the intensities of the NH and methylene (CH2) vibrations at 3309, 2931 and 2861 cm−1 weakened significantly but did not disappear completely (Figure 10(A-b)). The bandwidths of these bands were also broadened. The weakening of the intensity of the methylene bands is a clear indication that dehydrogenation reactions occurred during the stabilization process. Weakening of the hydrogen bonded NH band at 3309 cm−1 is attributed to the effect of decrystallization arising from the loss of hydrogen bonds between polymer chains in agreement with the results obtained from the X-ray analysis. The band attributed to free NH bonds became stronger and broader indicating the near completion of disappearance of the hydrogen bonds.
Infrared spectra of (a) cupric chloride impregnated PA6 fibers stabilized in air at 180℃ for 12 h and (b) the sample pre-carbonized at 250℃ for 4 h in nitrogen atmosphere. The 4000–2500 cm−1 region (A) and 2000–850 cm−1 region (B) .
The IR spectra of untreated and stabilized PA6 fibers in the 2000–850 cm−1 region are presented in Figure 8(B). This region contains several bands including amide I, amide II and amide III vibrations. The IR spectrum of the stabilized sample showed a broad band at 1720 cm−1 attributed to carbonyl (C = O) stretching of ketones, aldehydes, aliphatic carboxylic acids and esters [46] as a result of oxidative reactions. As mentioned before, pure PA6 fibers contain a polymorphic structure consisting of α- and γ-phases. The spectrum of PA6 containing the α-phase is characterized by crystalline bands located at 1200 and 928 cm−1 [47] (Figure 8(B-a)), whereas the γ-phase is characterized by the band at 973 cm−1 [47]. Following the stabilization in air at 180℃ for 12 h, these characteristic crystalline bands disappeared altogether suggesting the disappearance of crystalline order due to the decrystallization process. Figure 8(B) shows that most of the characteristic amide bands weakened in intensity suggesting the partial loss of hydrogen bonds between polymer chains.
Figure 10 shows the comparison of the IR bands corresponding to PA6 fiber stabilized in air at 180℃ for 12 h and pre-carbonized at 250℃ for 4 h in the presence of nitrogen atmosphere in the 4000–2500 (Figure 10(A)) and 2000–850 cm−1 regions (Figure 10(B)). Figure 10(A) shows that pre-carbonization at 250℃ caused further loss in intensity of the hydrogen bonded NH band at 3309 cm−1. Near disappearance of the methylene bands at 2931 and 2861 cm−1 indicated that dehydrogenation reactions neared completion. The results shown in Figure 10(B) indicate that the IR spectrum of the pre-carbonized sample exhibits a further decrease in the intensities of the major bands. In particular, the IR band attributed to carbonyl (C = O) vibration weakened considerably and shifted from 1720 to 1700 cm−1 indicating that major reactions such as crosslinking took place. The considerable decrease in the intensity of the carbonyl band also suggests that a significant amount of oxygen was released during the pre-carbonization reactions containing carbonyl functional groups. A similar behavior was also observed in the case of the amide bands. The amide I band shifted from 1640 to 1624 cm−1, whereas the amide II band shifted from 1540 to 1524 cm−1 indicating that complexation between cupric ions and carbonyl oxygens took place during the heat treatment. The IR spectrum of the sample stabilized in air at 180℃ did not show the presence of C = C bonds normally found at 1600 cm−1 (Figure 10(B-a)), but the IR spectrum of the sample heat-treated in nitrogen at 250℃ showed the presence of a shoulder at around 1600 cm−1 attributed to the formation of C = C and or C = N bonds [48–50] (Figure 10(B-b)). It is possible that a C = N (nitrilo) bond may form between the C-atom of the CH2 (methylene group of the skeletal chain) and the N-atom of the NH group through the release of a hydrogen atom from the N–H of the amide group (NH–C = O) as the direct result of dehydrogenation reactions.
After the oxidative stabilization and pre-carbonization stages, the samples were carbonized from 500 to 1000℃ in steps of 100℃ for 15 min in each case. Carbonizing the pre-carbonized sample (250℃ for 4 h) at 500℃ and above caused the total disappearance of hydrogen bonded NH and methylene (CH2) vibrations in the 3700–2500 cm−1 region due to the total loss of hydrogen bonds between polymer chains and completion of dehydrogenation reactions (Figure 11(A)). The intensities of the IR absorption bands containing carbonyl (C = O) and several amide vibrations corresponding to the carbon fibers in the 2000–850 cm–1 region (Figure11(B)) were found to totally disappear indicating the total removal of oxygen and hydrogen containing groups. These results suggest that the structures were totally transformed to a carbon fiber. It seems that the pre-carbonized (i.e. partically carbonized) structure formed at 250℃ was totally transformed to a carbonized structure at the carbonization temperature of 500℃ and above.
Infrared spectra of carbonized samples (a) 500℃ 15 min; (b) 600℃ 15 min; (c) 800℃ 15 min; (d) 1000℃ 15 min. The 4000–2500 cm−1 region (A), 2000–850 cm−1 region (B).
Electrical properties
Elongated carbon layer strips containing aromatic carbon basal planes (graphene planes) are known to be formed during the carbonization reactions. The structures of these aromatic carbon basal planes are in accord with graphite but are found to be less ordered. These structures are called turbostratic graphite and are usually characterized by disordered graphene layers with poor orientation along the fiber axis. Along the direction of the fiber axis containing graphene planes, electrical conductivity may be generated by the movement of π-electrons [51].
The results presented in Table 5 suggest that the electrical resistivity values of the resultant carbon fibers obtained decrease with rising temperature. The resistivity values decreased from 3.3 × 10⁶ to 7.2 × 101 Ω−1 cm−1. The temperature dependence of the electrical conductivity of the carbon fibers at various temperatures is illustrated in Figure 12. Electrical conductivity at room temperature showed strong dependence on carbonization temperature and was found to rise with increasing temperature, as shown in Figure 12. The highest electrical conductivity was obtained for the sample carbonized at 1000℃. The electrical conductivity values presented in Figure 12 and in Table 5 were found to vary between 3.02 × 10⁻⁷ and 1.4 × 10⁻² S/cm. The electrical conductivity increased by five orders of magnitude as carbonization temperature increased from 500 to 1000℃, resulting in a non-metal to partially metal transition.
Variation of electrical conductivity of carbon fiber samples as a function of carbonization temperature. Electrical properties of carbonized samples as a function of carbonization temperature.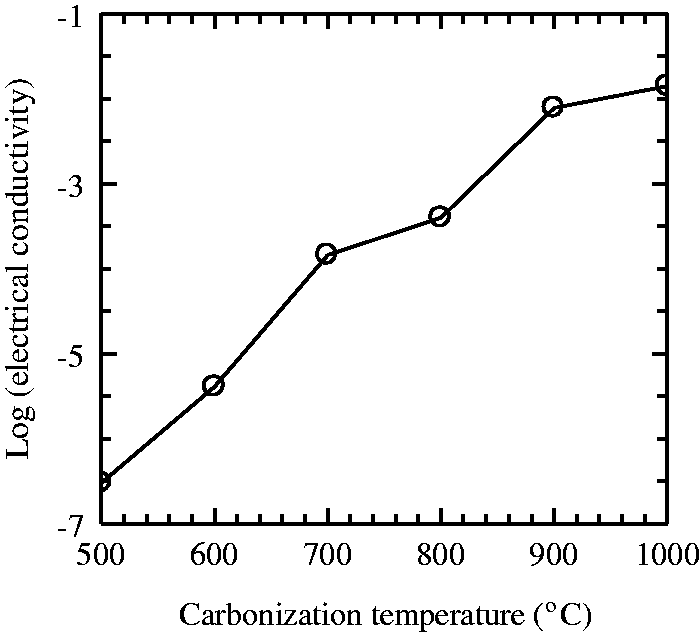

As a result of the removal of non-carbon elements during the carbonization process, which took place between 500 and 1000℃, the proportion of carbon content increased gradually and a conductive graphite-like structure tended to form causing an increase in electrical conductivity.
As mentioned before during the analysis of X-ray diffraction data, the apparent crystallite size (Lc) of carbon fibers was found to rise and the interplanar d-spacing was found to decrease with increasing temperature. The results suggest that the growth of the carbon basal planes is possibly responsible for the observed increases in electrical conductivity. As the temperature is progressively increased from 500 to1000℃, the electrical conductivity is dominated by the formation and growth of conducting carbon clusters containing graphene planes. Carbon nano-sized clusters begin to form at 500℃ and above. The concentration and the size of these conducting clusters grow with the rise in temperature from 500 to 1000℃, explaining the overall increasing trend of conductivity with rising temperature [52].
Electrical conductivity of pure PA6 is reported to be 7.8 × 10⁻¹⁰ S/cm [53]. Electrical conductivity of PA6 carbonized at 1000℃ is 1.4 × 10⁻² S/cm (Table 5). This is comparable to the conductivity of activated rice husk carbonized at 900℃. Conductivity of rice husk carbonized at 900℃ is reported to vary between 3.28 × 10⁻⁴ and 2.02 × 10⁻³ S/cm [54]. Conductivity of rice husk carbonized at 1000℃ is expected to be even higher. Since rice husk is activated carbon fiber, conductiviy is expected to be lower than the sample carbonized in the absence of activation.
As a result of the turbostratic nature of carbon fibers produced in the present study, the electrical conductivity values were much less than that of pure graphene (105 S/cm) [55]. To enhance the electrical conductivity of carbon fibers to much higher values, carbonization temperatures must also be increased significantly to well above 1000℃ or possibly to 2500 or even to 3000℃ under tension.
Conclusions
A two-stage procedure was used to completely stabilize polycaproamide (polyamide 6) precursor fibers prior to carbonization. In the first stage, oxidative stabilization was performed in air at 180℃ in the presence of cupric chloride pretreatment. The second stage included pre-carbonization in nitrogen atmosphere at 250℃. The carbonization procedure was carried out in nitrogen atmosphere at temperatures varying from 500 to 1000℃. The results obtained from thermal analysis data indicated that cupric chloride pretreatment improved thermal stability. During the oxidative stabilization stage, the polymorphic structure containing α- and γ-phases was removed due to the decrystallization reactions. The pre-carbonization stage was found to be essential to improve the thermal stability of oxidatively stabilized PA6 fiber prior to carbonization. The results indicated that the pre-carbonization step improved cyclization and crosslinking reactions prior to carbonization. The results suggested that the carbonization temperature had an influential role on the structure and properties of the resulting carbon fibers. Carbon fibers obtained from stabilized and pre-carbonized PA6 fibers showed physical and structural transformations with rising temperature. They were characterized by a decrease in fiber thickness, linear density, carbon fiber yield, hydrogen and nitrogen content values due to the elimination of non-carbon elements together with increases in the values of volume density, carbon content, C/H ratio and electrical conductivity. The results obtained from linear density measurements indicated a carbon fiber yield of 43% at the carbonization temperature of 1000℃. X-ray diffraction analysis revealed that the interplanar d-spacing (d002) decreased and the apparent crystallite thickness (Lc) increased with rising temperature. In agreement with the elemental analysis, infrared spectroscopy showed the loss of hydrogen bonded NH, methylene (CH2) and carbonyl (C = O) groups due to the removal of oxygen and hydrogen atoms caused by the totally completed dehydrogenation and decrystallization reactions and the formation of a turbostratic carbon structure during high temperature treatment. The results obtained from X-ray diffraction, IR spectroscopy and elemental analysis indicated that the crystalline structure was totally lost and converted to a carbonized structure at 500℃ and above due to the formation of an amorphous carbon structure during the carbonization process. Owing to the turbostratic nature of carbon fibers produced in the present study, the electrical conductivity values were found to be much less than that of pure graphene (105 S/cm).
Footnotes
Acknowledgements
The assistance and cooperation of SİFAŞ AŞ (Bursa) is gratefully acknowledged for providing the polyamide 6 multifilaments. Thanks are also extended to Prof Dr Mehmet Ari (Department of Physics, Erciyes University) for the electrical conductivity measurements.
Declaration of Conflicting Interests
The author(s) declared no potential conflicts of interest with respect to the research, authorship, and/or publication of this article.
Funding
The author(s) disclosed receipt of the following financial support for the research, authorship, and/or publication of this article: The authors acknowledge the financial support from the University of Erciyes Research Fund via project no. FCD-2012-4005.