
Abstract
The conversion of poly (hexamethylene adipamide) or polyamide 66 precursor fiber to carbon fibers was accomplished through thermal stabilization and carbonization processes. Thermal stabilization was conducted of cupric chloride (CuCl2)–ethanol-impregnated polyamide 66 (PA66) fibers in the air. To determine the influence of heating rate on the fiber structure and properties of the resultant carbon fibers, carbonization experiments were performed at selected temperatures of 500, 700, 900, and 1100°C using 2.5 and 5 °C/min heating rates with no dwelling. The results conclusively revealed that the volume density and tensile properties of the PA66 fiber were higher at 2.5 °C/min heating rate. After fixing the heating rate as 2.5°C/min, further carbonization experiments were conducted at temperatures from 500 to 1100°C, using increments of 100°C with no dwelling time. Linear density, volume density, fiber diameter, carbon yield, elemental composition, tensile, and electrical properties exhibited a strong dependence on the carbonization temperature. After taking into account the effects of structural defects (i.e., microvoids), tensile strength, and tensile modulus of the carbon fibers increased to 794 MPa and 92.4 GPa, respectively, when carbonized at 1100°C. X-ray diffraction analysis of the carbon fibers further revealed the existence of a greatly disordered (i.e., amorphous) structure, which developed during the carbonization process. FT-IR analysis confirmed the formation of highly aromatic carbon clusters at temperatures of 500°C and higher. The outcomes of electrical conductivity in this study confirm that the PA66 precursor was converted into a semi-conducting state once it was carbonized.
Introduction
Carbon fibers are now broadly applied as a reinforcing constituent in structural composites, including carbon fiber reinforced ceramics, carbon fiber reinforced plastics, carbon fiber reinforced metals, and carbon–carbon composites due to their high specific strength and modulus,1–3 leading to improved mechanical and thermal properties.2,3 As woven and knitted structures, carbon fibers are used as part of carbon fiber reinforced plastics in airplanes, high-grade sports materials, automobiles, civil engineering, machine parts, pressure vessels, wind power blades, etc. 2
Commercially produced carbon fibers have higher tensile properties, about 2–7 GPa tensile strength, 200–965 GPa tensile modulus, 1.75–2.18 g/cm3 density, around 3 GPa compressive strength, excellent thermal and electrical conductivity, and good thermal and chemical resistance properties.4,5 A number of precursors, including polyacrylonitrile, 6 mesophase pitch, 7 and viscose rayon, 8 are used to manufacture carbon fibers commercially. Now, polyacrylonitrile (PAN) is used as the foremost precursor in carbon fiber manufacturing, occupying about a 90% share of the total carbon fiber production.2,9 PAN fibers are usually employed to manufacture high-strength carbon fibers; however, mesophase pitch is used to obtain high modulus carbon fibers. At present, the volume of regenerated cellulose-based carbon fibers constitutes approximately 1–2% of the total carbon fiber produced worldwide. 10
Carbon fibers produced from cellulose are not commonly employed in high-strength applications because of their lower carbon yield percentage and lower mechanical properties. Cellulose-based precursor fibers are used to produce activated carbon fibers (ACF). 11 ACF has a noteworthy role in both the medical and industrial sectors, such as in the controlled release of drug supply, in filtering water to make it drinkable, in gas separation for different industrial purposes, and in the wastewater treatment plant. 12 Activated carbon fibers are often used for removing pollutants (i.e., pesticides) from wastewater,13,14 for noise insulation and absorption,15,16 for shielding electromagnetic interference, 17 for adsorbing metal ions, 18 for gas storage (i.e., hydrogen 19 and methane 20 ), for manufacturing personal protective clothing, 21 for producing electric double-layer capacitors, 22 etc.
There exists a new trend towards using smaller diameter carbon fibers. 4 It is clear that smaller diameter fibers exhibit higher tensile strength. Currently, the diameters of commercial carbon fibers are reported to be within 5–10 μm. 4 Producing continuous precursor fibers using conventional technology with diameters below 10 μm, resulting in carbon fibers with a diameter of 5 μm, is reported to be difficult. However, smaller diameter precursor fibers with diameters in the 10 nm–1 μm range can be produced by an electro-spinning technique. 4 Carbon fibers with distinctive diameters, between 100 nm and 4 μm, are reported to be produced by carbonization of electro-spun PAN,2,23,24 cellulose, 25 and polyvinyl alcohol 26 nanofibers. The resulting PAN-based carbon nanofibers are reported to have the values of tensile strength within the 300–600 MPa range and tensile modulus within 40–60 GPa range. 23 In the case of cellulose-based carbon nanofibers carbonized at 1500 and 2200°C, the tensile moduli values were found to vary between 60 and 100 GPa, respectively. 25
The production of carbon fiber (Figure 1) from a polymer precursor involves (a) the creation of oriented fibers by different spinning techniques, (b) thermal stabilization of the precursor fibers at a temperature of 200–350°C in air atmosphere, (c) carbonization in an inert atmosphere (commonly up to 1600°C in a nitrogen environment, and at higher temperatures in an argon environment),
27
and (d) graphitization as an optional stage at temperatures >2500°C to improve the mechanical properties (Figure 1). Thermally stabilized precursors are characterized by infusibility, intractability, and non-flammability.
28
Production flow chart of polyamide 66-based carbon fiber.
In the last few decades, there has been a steady growth in the use of metal salts during the processing of carbon fibers. The use of metal salts is stated to change the fiber structure and speed up the stabilization reactions. Impregnation of PAN precursor fibers with various metal salts has been the subject of various research studies.29–32 The use of metal salts in polyacrylonitrile fiber pretreatment lowers the stabilization time, offers better controlling of heat flux in the stabilization process, and finally helps to enhance the tensile properties of the resultant carbon fibers. 30
The amide groups of polyamide chains have an interesting ability to form complexation with metal salts. 33 The interactions between amide groups of polyamide chains and metal ions offer new prospects to modify the processing and performance of polyamides. The alkali metal and the transition metal salts were admitted to produce complexation with polyamide 6 (PA6) chains.34,35 The thermal stabilization of PA66 against thermal damage was performed with Ni, Co, Cu, and Zn chlorides alone or combined with potassium iodide. 36 Copper salts were admitted as one of the most effective stabilizing components. Starkweather and Avalian 37 showed that the electrical conductivity of PA66 films could be increased by up to 150 fold after immersion in metal halide and alkali metal salts, including LiCl, NaBr, CuCl2, and ZnCl2. La Mantia et al. 38 declared the manufacturing of polyamide six fibers with enhanced amorphous orientation by incorporating lithium salts in the polymer melt. These investigations suggested that the introduction of lithium halide salts into polyamide six systems could improve the mechanical properties of PA6 fibers.38,39 A comprehensive research study on the inclusion of gallium ions with polymer chains was mentioned to improve the tensile properties of polyamide 66 fibers. 40 The addition of gallium ions with polyamide 66 results in the loss of hydrogen bonding. Complete loss of hydrogen bonds from the polymer chain allows higher draw ratios (about 7–13) with lower strain rates.41–43
Aromatic polyamide (i.e., para- and meta-aramid) fibers such as Kevlar®/Twaron® and Nomex®/Conex® can be used in the manufacture of carbon fibers without performing thermal stabilization.44,45 However, because of low thermal stability, aliphatic polyamide (PA6 and PA66) fibers need to have thermal stabilization46–50 for processing carbon fibers. The thermal stability of polyamide six was reported to be obtained in the presence of biphenol monoacrylate along with a hindered phenolic antioxidant system. 51 Polyamide six pellets containing 0.1–2 wt% of purified (p-MWCNT) and amino-functionalized (f-MWCNT) multi-walled carbon nanotubes (MWCNTs) showed improved thermal stability under the air atmosphere. 52 Thermally stable PA6 knitted fabric was obtained after crosslinking in the presence of sodium hypophosphite and butanetetracarboxylic acid without the formation of a yellow color. 53 Electron beam irradiated polyamide 66 with different doses led to a rise in the number of crosslinks along with chain scission forming. 54 Formaldehyde alone and formaldehyde in the presence of thiourea-based chemical crosslinking with polyamide 66 was also mentioned in the published literature. 55
In this study, a comprehensive analysis was carried out of cupric chloride-ethanol impregnation in the absence of water for carrying out thermal stabilization and carbonization reactions. Integration of cupric chloride with PA66 was noticed to significantly accelerate the thermal stabilization and carbonization process with minimum tensile strength loss. During the experimental work, the effects of processing parameters in terms of carbonization temperature, heating rate, and structural defects on the fiber properties of the resultant carbon fibers were explored. These effects were characterized by means of volume density, linear density, fiber diameter, X-ray diffraction, elemental analysis, FT-IR, carbon yield, tensile testing, and electrical conductivity to observe the structural deviations that occurred in the carbonization experiments.
Experimental
Preparation of stabilized and carbonized samples
A polyamide 66 yarn with a linear density of 16.37 tex per 68 filaments, manufactured for textile applications, was used during the course of this study. The PA66 single filament cross-sectional shape is circular, as confirmed by the yarn manufacturer (POLYTEKS AŞ, Turkey). The original polyamide 66 yarn was pretreated with 10% (v/v) ethanol–water solution at 50°C for 40 min to get rid of the surface impurities of the fibers. Following the removal of surface impurities, the sample was left to dry overnight at room temperature and then dried again in an air oven at 80°C for 5 h until constant weight.46,56
Chemical pretreatment was accomplished by soaking the PA66 yarn in a solution of 1% (w/v) cupric chloride–ethanol for 24 h at room temperature. The chemical solution displayed a pH value of 2.5 ± 0.1 at 22 ± 2°C. The cupric chloride (purity 99.0%) was purchased from Merck (Germany) and was used without further purification. Following the chemical soaking pretreatment, the samples were taken out and dried at 50°C for 24 h after using a cotton fabric to remove the excess liquid. The impregnated PA66 yarn was loaded with 6.05% (w/w) cupric chloride on a dry basis.46,56
The thermal stabilization process was performed by using a two-phase heating procedure in the air atmosphere. The first heating phase was accomplished between 175 and 205°C using a 1°C/min heating rate. The next heating phase was performed at 250°C at a 0.3°C/min heating rate. Both heating phases employed a heating time varying between 0 and 2 h (Figure 2). Two-step procedure used during the thermal stabilization of PA66 precursor fibers.
In normal conditions, the nitrogen gas flow rate was 200 mL/min. Prior to the carbonization step, a purge of 2 h with a 150 mL/min flow rate was accomplished to eliminate the air trapped inside the carbonization oven. A tubular furnace (PROTHERM, ANKARA) was used to perform carbonization, employing a 700 mm long ceramic tube with a 50 mm diameter. Carbonization was performed at temperatures between 500 and 1100°C with 100°C steps without any dwelling period. In the present study, a cooling rate of 2 °C/min was also used before removing the sample from the furnace.44,45,57
Data Collection
Diameter measurement of the samples was performed by employing a polarizing microscope (Nikon ME600 L, Japan) containing a calibrated eyepiece. Twenty diameter measurements were taken for each sample.44–46
The linear density was evaluated by taking the weight of the samples in grams per unit length. In this work, the unit “tex” is considered for linear density measurement, which can be expressed by the ratio of the weight of yarn (in g) per 1000 m.47,56,57 The linear density values were evaluated by taking the mean value of five measurements.
The volume density of the samples was determined by employing a density gradient column, where isopropyl alcohol (ρ = 0.79 g/cm3
Elemental analysis for carbon, hydrogen, nitrogen, and C/H ratio was completed using a LECO® TruSpec Micro Elemental Analyzer. In this analysis, the combustion of the PA66 samples was performed in an oxygen-rich environment. Acetanilide was employed in this process for the calibration of the components, that is, C, H, N, and C/H.44,45,57
To get wide-angle X-ray diffraction profiles, a Bruker® AXS D8 X-ray diffractometer employing nickel filtered CuK radiation (λ= 0.15,406 nm) was employed.44,45,58 The X-ray diffraction profiles of the original, stabilized, and carbonized PA66 fibers were achieved in the 10–40° 2θ scattering range, respectively. Lorentz and polarization corrections were executed for the obtained X-ray diffraction profiles. 59
Infrared spectra were collected employing a Perkin Elmer® Spectrum 400 FT-IR spectrometer utilizing a single reflection diamond-based GladiATR® model ATR attachment. In the present work, the 4000–400 cm−1 range was used with a characteristic resolution of 2 cm−1.44,45,57
The tensile properties of the carbon fiber samples were evaluated by employing a PROSER tensile testing machine. The testing standard followed in this study was DIN EN ISO 2062:2010–04. 60 The values were determined by utilizing 10, 20, and 40 mm gauge lengths and 1 mm/min speed.44,45 Mechanical properties by means of tensile strength and modulus were acquired in N/tex unit. Then, by multiplying with the density values (g/cm3), the original tensile properties of the yarns were converted into MPa or GPa.61,62
For the electrical measurements, a DC four-point probe method was employed. The four-point probe characterization approach is a widely used standard method for analyzing the electrical properties of materials, especially in the semiconductor industry.63–66 This method was utilized by keeping the electrical probes on the yarn surface. Two of them were utilized to provide current, and the other two were utilized to measure voltage.44,45,57 This method has the advantage of removing measurement errors because of the contact resistance, spreading resistance, and probe resistance between the material and the metal probes.67,68 The whole process was carried out at room temperature.
An LEO 440 Scanning Electron Microscope was used to assess the surface characteristics of the fiber samples, which had an operating voltage of 10 kV and object to detector distances between 8 and 12 mm. To improve conductivity and avoid electrostatic charge, the surfaces of the samples were coated with gold. 62
Experimental data analysis
X-Ray data-curve fitting
The profiles of X-ray diffraction (XRD) attained from the stabilized and carbonized PA66 fibers were curve fitted, as stated by the technique established by Hindeleh et al. 59 The curves are supposed to be a combination of Lorentzian and Gaussian functions. By using a linear baseline, the curve fitting was carried out for the XRD profiles. The area under the baseline is ascribed to an instrumental background signal that might be due to air and incoherent scattering effects.
Evaluation of stacking height (Lc)
The half-height widths acquired from the curve fitting procedure were adjusted by following a deconvolution method established by Stokes.
69
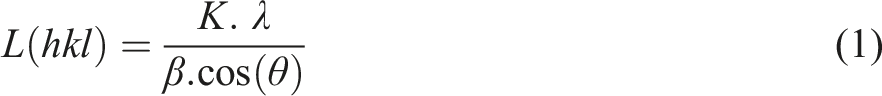
For a particular reflection, the apparent crystallite size (i.e., the stacking height) was determined by applying the Scherrer equation (1).
The d-spacing was evaluated by employing Bragg’s equation (2)

Evaluation of porosity
According to the published literature, microvoids (i.e., micropores) can be introduced during the fiber extrusion, stabilization, and carbonization stages of precursor fibers.
70
By utilizing the density values of the carbon fibers and pure graphite, the amount of porosity was determined70,71 by employing equation (3).

where the density and d-spacing of the carbon fibers are ρ and d002, respectively. For graphite, ρg indicates density (2.26 g/cm3) and dg indicates d-spacing of the (002) reflection (0.3354 nm).44,45
Correction of experimental tensile modulus
Tensile modulus values should be corrected due to the influence of microporosity.
71
The tensile modulus values were corrected by employing equation (4).

Results and discussion
Thermal stabilization of PA66 fibers was accomplished in an air atmosphere with 1% CuCl2 solution pretreatment using a two-step heating profile. Preparation of the cupric chloride solution was carried out in the presence of ethanol. In this sense, ethanol had a dual role of acting as a solvent for cupric chloride and as a swelling agent for the PA66 fibers. Alcohols including ethanol, methanol, benzyl alcohol, and ethylene glycol are typical swelling agents 72 for aliphatic polyamides, including PA66. Ethanol as a swelling agent was found to be extremely useful to open up the rigid structure of the PA66 chains by reducing the interchain forces operating between hydrogen bonds to enhance the rate of diffusion of cupric ions (Cu+2) into the polymer structure.73,74 During the course of this work, the use of water as a swelling agent was avoided due to the fact that the moisture destroys the intermolecular hydrogen bonding network caused by thermal energy release in the stabilization phase, resulting in the decrease of tensile properties and Tg.73,74 The first step of thermal stabilization was performed between room temperature and a temperature interval of 175–205°C. Trials were conducted at 175, 190, and 205°C using a dwelling time of 0 and 2 h at each temperature. The second heating step was fixed at a temperature of 250°C for dwelling times varying between 0 and 2 h (Figure 2).
Experimental data obtained from the two-step stabilization procedure of PA66 precursor fibers.

In an earlier study, polyamide 6 (PA6) precursor fiber was thermally stabilized at 180°C in an air atmosphere pretreated with cupric chloride. Unfortunately, the thermal stabilization of PA6 precursor fiber on its own was not sufficient to proceed to the carbonization step. In order to develop the thermal stability of the stabilized polyamide 6 fiber, pre-carbonization at 250°C in an inert atmosphere was performed prior to carbonization. 57 In fact, two-step thermal stabilization was sufficient on its own without the necessity of proceeding to the pre-carbonization step for the PA66 precursor prior to carbonization.
The values of density and tensile properties of the thermally stabilized polyamide 66 fibers are presented in Table 1. The tensile testing outcomes reveal that increasing the first step temperature from 175 to 205°C with a dwelling time of 2 h, while keeping the second step temperature at 250°C with no dwelling, resulted in the highest tensile strength value of 124 ± 5 MPa at 190°C. The tensile strength value of the first step temperature of 205°C was the lowest at 116 ± 10 MPa. This clearly shows that the first step temperature should be adjusted at 190°C. In the second set of experiments, the first step temperature was set at 190°C with no dwelling period. The second step temperature was already set at 250°C, but the dwelling period was not clear. To find the best dwelling period, experiments were conducted by varying the dwelling times between 0 and 2 h at 250°C. The outcomes showed that the first step temperature of 190°C with no dwelling and a second step temperature of 250°C with no dwelling, resulted in the highest tensile strength of 127 ± 4 MPa. In the case of 2 h dwelling time at 250°C, the results showed a tensile strength value of 91 ± 14 MPa. These results clearly confirmed that the second heating step should be performed at 250°C with no dwelling.
To summarize, the tensile testing outcomes presented in Table 1 clearly demonstrate that the heat stabilization process of PA66 fiber before the carbonization phase should be performed using a two-step heating profile employing the first step temperature of 190°C with no dwelling at a 1 °C/min heating rate and the following step temperature of 250°C with no dwelling at a 0.3°C/min heating rate, respectively. Thermally stabilized sample 4 (Table 1) was exposed to a flame test. The flame test proved that this sample was flameproof, with no melting behavior observed. The density of sample 4 was found to be 1.4217 ± 0.0022 g/cm3. Sample 4, which had the highest tensile strength (Table 1), was chosen for the next stage of carbonization experiments. Sample 5 presented a density value of 1.4658 ± 0.0014 g/cm3. The tensile strength of this sample was too low (91 ± 14 MPa) to proceed to the next carbonization experiments. It seems that with the increase of density of the stabilized samples the amount of microvoid formation also increases in carbon fibers. 75 In fact, the presence of a microvoid, which is regarded as a defect, is expected to result in a reduction in the mechanical properties of the carbon fibers. 75
Tensile properties and volume density values of carbon fibers produced from thermally stabilized PA66 fibers at different heating rates.


Tensile strength (a) and tensile modulus (b) values of carbon fibers processed utilizing heating rates of 2.5 (O) and 5°C/min ().
As observed in Figure 3 and Table 2, the tensile strength and modulus values at a 2.5°C/min heating rate were found to be greater than the results of a 5°C/min. These results suggest that the 2.5°C/min rate should be used in the next set of carbonization experiments. 2°C/min was adjusted as the cooling rate in this experiment. Faster cooling rates (e.g., 27°C/min) were reported to result in inferior tensile strength and modulus values. 58
The volume density values of carbon fibers treated at 500, 700, 900, and 1100°C are represented in Figure 4. The outcomes shown in Table 2 and Figure 4 reveal that the volume density values of the carbon fibers carbonized at a 2.5°C/min rate are greater than those prepared using a 5°C/min rate. The volume density value of carbon fiber carbonized at 1100°C was 1.8643 ± 0.0206 g/cm3 at 2.5°C/min and 1.8107 ± 0.0219 g/cm3 at 5°C/min (Table 2, Figure 4). Volume density values of carbon fibers prepared from thermally stabilized PA66 fibers for different heating rates. (O) 2.5°C/min; () 5°C/min.
Following the experimental work, using two different heating rates (2.5 and 5°C/min) for comparison purposes at four different carbonization temperatures (i.e., 500, 700, 900, and 1100°C), it became apparent that detailed experimental work should be performed using the 2.5 °C/min heating rate for the set of carbon fibers prepared at the temperatures between 500 and 1100°C in increments of 100°C after performing thermal stabilization experiments using the two-step procedure as described.
Volume density, fiber diameter, linear density, and carbon yield
Figure 4 presents the volume densities of the carbon fibers for different carbonization temperatures. When the temperature was elevated from 500 to 1100°C, the values of volume density were raised from 1.6176 ± 0.0236 to 1.8643 ± 0.0206 g/cm3. The significant growth in volume density with growing temperature can be accredited to the extensive development of aromatic structures or large-scale crosslink formations in the carbon fiber structure. The rise in volume densities by increasing temperature is also accredited for the elimination of non-carbon components from the carbon fibers due to the formation of heterocyclic rings, along with the expansion and thickening of aromatic carbon clusters. The development of carbon basal planes in the fiber during the carbonization processes also causes the density values to rise with temperature. As a result, during the carbonization process, the development of carbon basal planes in the stabilized fiber causes increases in the density values of the resultant carbon fibers. 76
Properties of carbon fibers obtained from thermally stabilized PA66 fibers for different carbonization temperatures (2.5 °C/min heating rate).


Fiber diameter (a) and linear density (b) values of carbon fibers obtained from thermally stabilized PA66 precursor for different carbonization temperatures (2.5°C/min heating rate).
For different carbonization temperatures, the changes in the linear density are plotted in Figure 5(b) and presented in Table 3. As soon as the temperature was elevated from 500 to 1100°C, the linear density values displayed a severe reduction of 55.9% in comparison with the original PA66 fibers. The foremost reason for this huge loss in linear density is the evolution of volatiles in the carbonization stage.
The carbon fiber yields, considering the weight changes per unit length for different carbonization temperatures, are summarized in Table 3. The published carbon content is evaluated as 63.7% based on the chemical formula of PA66 polymer. The values tabulated in Table 3 show that the carbon yield falls from 60.4 to 44.1% as soon as the temperature was elevated from 500 to 1100°C. The difference between the theoretical carbon yield (63.7%) and the experimentally evaluated carbon yield is ascribed to the weight loss that happened in the carbonization step.
Elemental analysis
Elemental analysis of PA66-based carbon fibers for different carbonization temperatures.

The carbon content value of the carbon fiber samples enhanced steadily from 70.8 to 79.6% by the increase of temperature to 1100°C. However, the nitrogen and hydrogen content progressively fell to 2.65% and 0.97%, respectively (Table 4). The rise in carbon content recommends the formation of highly aromatic-based carbon clusters during the carbonization experiments. The formation of carbon clusters is expected to result in the rearrangement and compaction of the carbon layer planes. The ratio of carbon and hydrogen was increased from 24.9 to 82.1% in the carbonization reactions when the temperature rise was observed between 500 and 1100°C.
At the temperature of 500°C and above, it is generally expected that the extensive expansion of graphene layers will take place. In the carbonization reactions, at temperatures between 500 and 1100°C, large-scale intermolecular crosslinking reactions occur between the PA66 polymer chains, which contain highly organized aromatic ring structures. In the carbonization process, extensive crosslinking reactions result in the dimensional changes of graphene planes. The development of a carbonized structure leads to the creation of a higher number of graphene planes that ultimately results in the enhancement of mechanical properties of the carbon fibers. To increase the carbon content to 90% or more, higher carbonization temperatures should be employed.
X-Ray diffraction
By using equatorial X-ray diffraction analysis, structural characterization of the PA66-derived carbon fibers was accomplished. The profiles of the X-ray diffraction are depicted in Figure 6. These diffraction profiles scanned in the scattering angles between 10° and 40° 2θ are characterized by specifying the formation of highly disordered graphene layers. Equatorial X-ray diffraction profiles of carbon fibers produced at (a) 500°C, (b) 600°C, (c) 700°C, (d) 800°C, (e) 900°C, (f) 1000°C, and (g) 1100°C.
For the analysis of the X-ray diffraction profiles, the curve fitting technique established by Hindeleh et al.
59
was employed to achieve detailed peak parameters by means of peak intensity, peak position, and half-height width (Figure 6). In Figure 7, an example of the curve fitting technique is illustrated of the carbon fibers produced at 1100°C. Curve fitting of equatorial X-ray diffraction profile of PA66-based carbon fiber produced at 1100°C (Scattering angles between 10 and 40° 2θ).
Investigation of equatorial X-ray diffraction profiles of PA66-based carbon fibers for different carbonization temperatures (Scattering angles between 10 and 40° 2θ).

In Table 5, the structural parameters of the X-ray diffraction profiles are tabulated and were attained by using a curve fitting technique. From the half-height width of the 002 reflection, the value of Lc (stacking height of the carbon layer planes or crystallite thickness) was determined by employing the Scherrer equation (1). The Bragg equation (2) was employed to determine the d-spacing from the position of the (002) peak. In this way, the average number of graphene layer planes could be determined from Lc/d002. From the analysis of the curve fitting technique, the acquired results demonstrate that the peak position of the (002) diffraction transfers to a greater diffraction angle from 24.1 to 25.1°, by increasing temperature from 500 to 1100°C, indicating that the d-spacing drops slightly from 0.3690 to 0.3545 nm. The outcomes listed in Table 5 show that the stacking height grows from 0.826 to 1.255 nm by the rise of temperature from 500 to 1100°C. Raising the stacking height (Lc) resembles the growth in graphene layers from 2.2 to 3.5 by the increase of temperature from 500 to 1100°C.
Infrared spectroscopy
In the present work, the structural transformations that occurred in the carbonization reactions were monitored using the infrared spectroscopy technique. Our earlier investigation on the thermal stabilization of PA66 fiber with cupric chloride impregnation 56 clearly demonstrated a steady weakening and ultimate vanishing of the intensities of OH (hydroxyl) and CH2 (methylene) bands from 4000 to 2800 cm−1 because of the loss of intermolecular hydrogen bonds. While the cupric ions create an attachment with the carbonyl oxygen during cupric chloride impregnation, the hydrogen bonds from the polymer chains were completely lost after the thermal stabilization experiments. 56
The IR vibrations of the cupric chloride impregnated PA66 fiber revealed the presence of a “free NH” spectrum in the region of 3600–3350 cm−1.
56
The broadening and complete disappearance of free NH bands indicate the complete disappearance of hydrogen bonds from the PA66 polymer. Concerning the IR region located between 4000 and 2400 cm−1, the major bands related to the pure PA66 structure, including hydrogen-bonded N–H stretching, amide II, and methylene (CH2) asymmetrical and symmetrical CH bands at 3309, 2931, and 2861 cm−1 completely disappeared at carbonization temperatures of 500°C and higher confirming the completion of the dehydrogenation reactions (Figure 8). FT-IR spectra of carbon fibers in the area of 4000–2400 cm−1 for different carbonization temperatures (a) 500°C, (b) 600°C, (c) 700°C, (d) 800°C, (e) 900°C, (f) 1000°C, and (g) 1100°C.
The initial weakening and the final stage loss of the methylene band intensity is a strong sign of the dehydrogenation reaction occurrence in the thermal stabilization and carbonization reactions. The presence of free NH bands is a direct confirmation of cupric chloride complexation between the carbonyl oxygen and cupric (Cu+2) ions. Due to the dehydrogenation reactions in the thermal stabilization process, the release of hydrogen atoms from the PA66 causes the development of C=C bonds, as evidenced by the formation of an IR spectrum at 1600 cm−1. With the progress of the carbonization step, due to the extensive dehydrogenation reactions, crosslinking and aromatization reactions appear to occur, resulting in the formation of aromatic structures and crosslinking between the polymer chains containing an extensive amount of C=C bonds. 56
The IR spectrum of the untreated PA66 precursor covering the 1900-500 cm−1 region contains several bands, including carbonyl (C=O, 1714 cm−1), amide I (1634 cm−1), amide II (1530 cm−1), amide III (1270 cm−1), and amide IV (728 cm−1) together with several crystalline and amorphous bands.
56
In the advanced phases of thermal stabilization and carbonization reactions, typical PA66 IR spectra in 1900–500 cm−1 completely disappeared, as depicted in Figure 9, specifying the overall elimination of oxygen (C=O) and hydrogen (CH, CH2, and N–H) containing groups. Interestingly, the IR vibrations of the carbon fibers produced at 500 and 600°C showed the remnants of the skeletal C–C stretching bands spanning from 1200 to 1000 cm−1 (Figure 9).
56
FT-IR spectra of carbon fibers in the area of 1900-500 cm−1 for different carbonization temperatures (a) 500°C, (b) 600°C, (c) 700°C, (d) 800°C, (e) 900°C, (f) 1000°C, and (g) 1100°C.
With the rise of temperature from 700 to 1100°C, the disappearance of skeletal C–C stretching bands is seen in Figure 9. At the same time, it appears that the synthesis of aromatic structures containing heterocyclic rings seems to be initiated, as depicted by the broadening of the C=C band at 1540 cm−1 (Figure 9 c–g). 77 The remnants of the C=C stretching are only visible in the IR vibrations of the carbon fibers treated at 700°C and higher. The IR spectra are seen in Figure 9 clearly indicate that the polyaromatic structures were entirely converted into the carbon fibers at temperatures of 700°C and above.
Tensile properties
The tensile properties of the obtained carbon fibers in this work are found to be heavily dependent on the processing parameters, including carbonization temperature, heating rate, formation of microvoids, and gauge length. The tensile properties obtained for different carbonization temperatures using the 2.5 °C/min rate are illustrated in Figure 10 and Figure 11. Stress–strain diagrams of carbon fibers produced at (a) 500°C, (b) 600°C, (c) 700°C, (d) 800°C, (e) 900°C, (f) 1000°C, and (g) 1100°C. Tensile strength (a) and tensile modulus (b) of carbon fibers prepared from thermally stabilized PA66 precursors for different carbonization temperatures (2.5 °C/min heating rate).
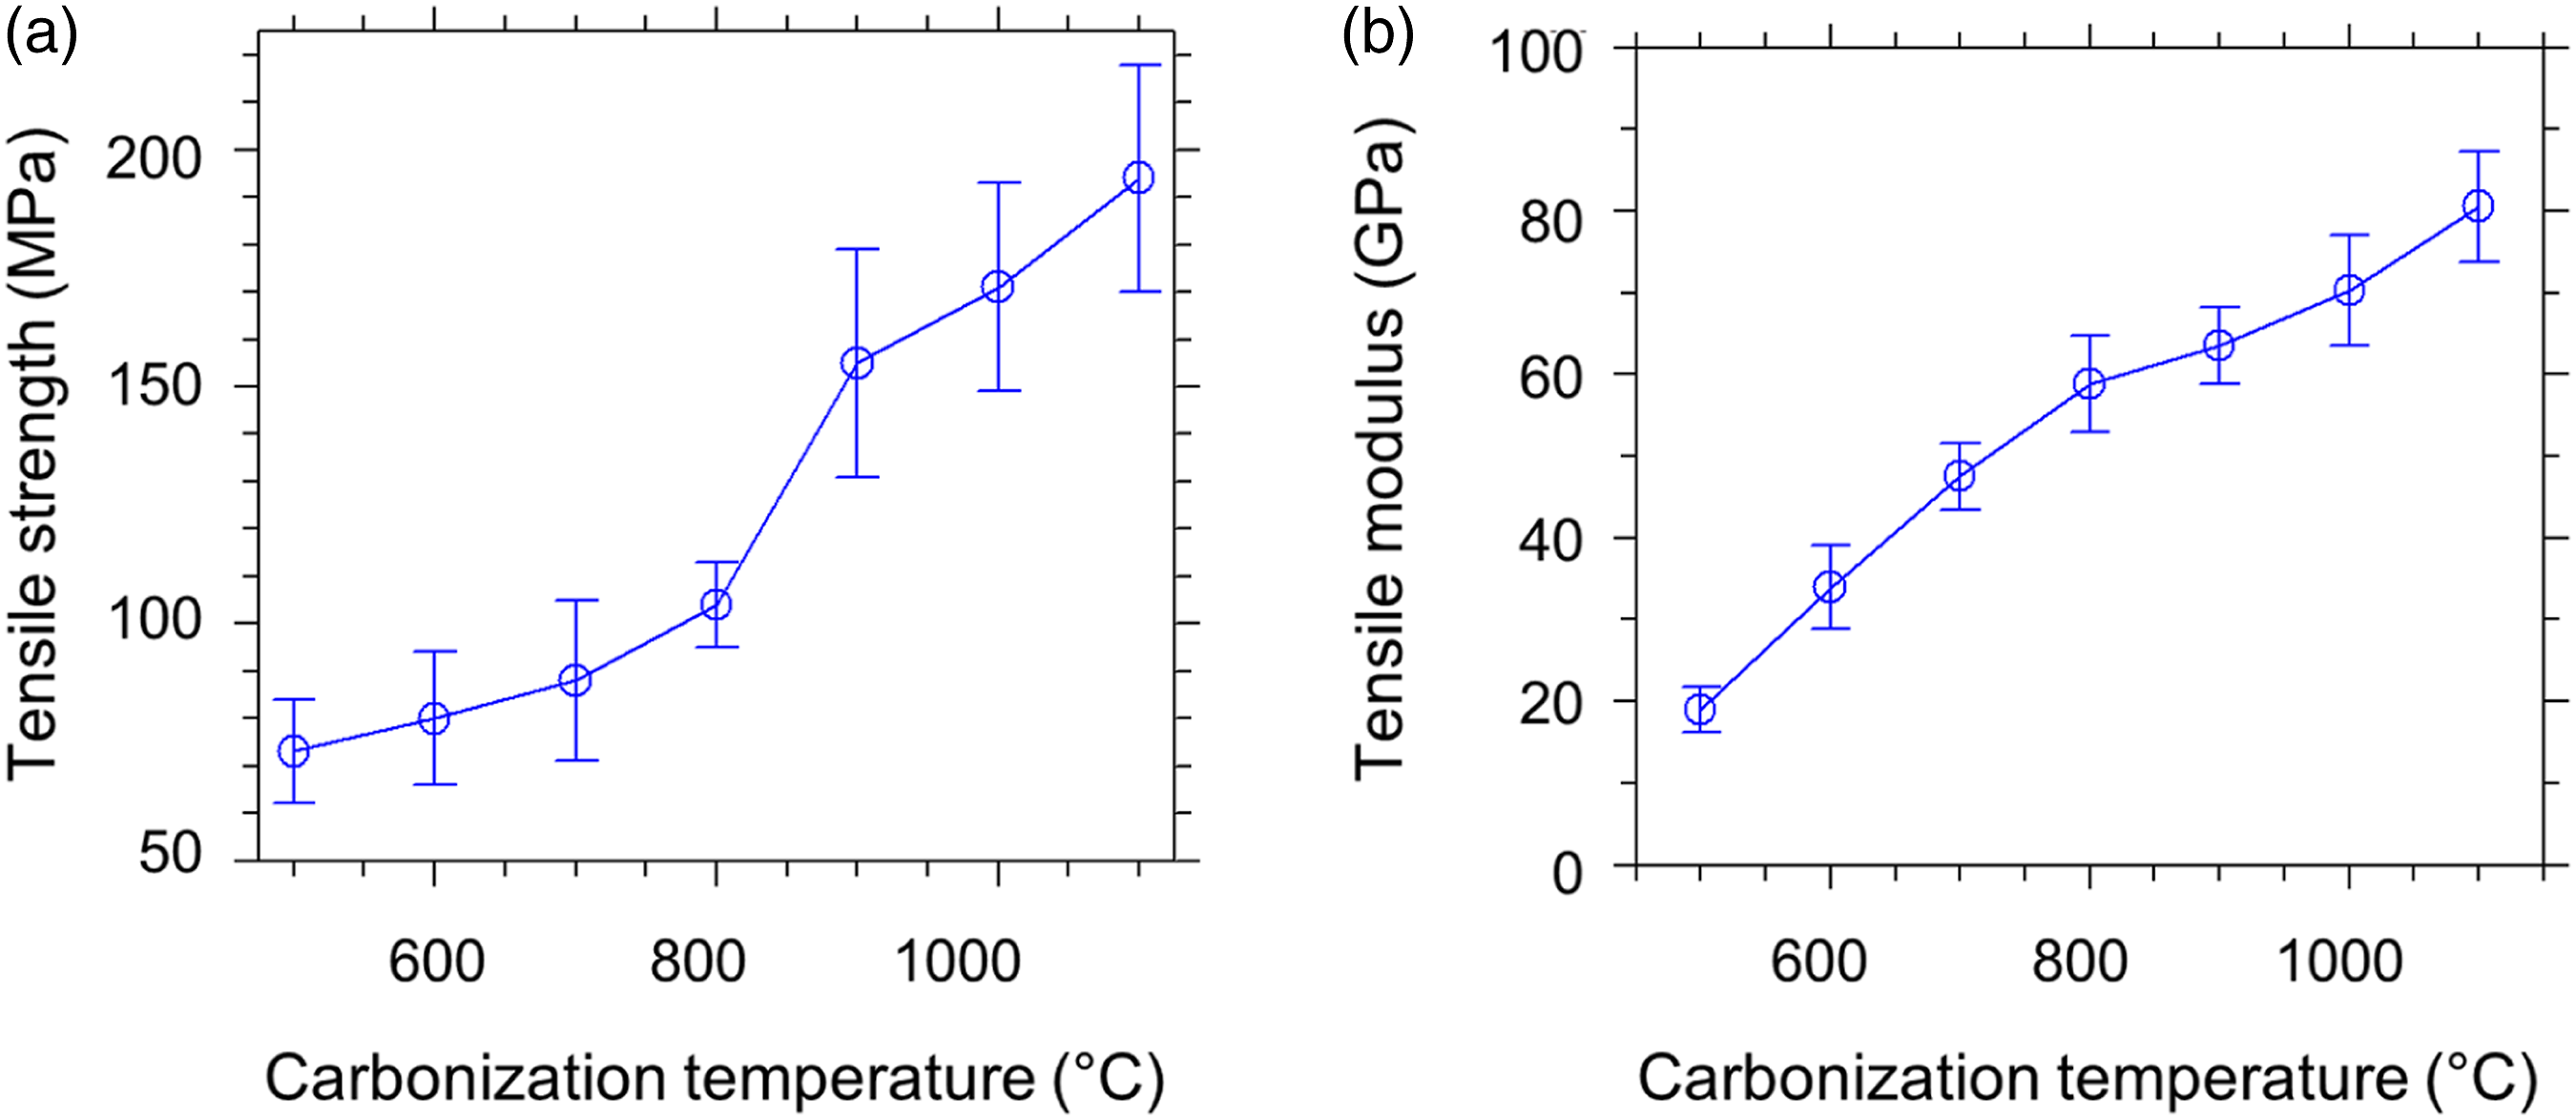
The outcomes reveal that the tensile strength and modulus values are enhanced with the increase of carbonization temperature. The tensile strength value of carbon fiber was increased from 73 ± 11 to 194 ± 24 MPa by the intensification of temperature from 500 to 1100°C. Likewise, the tensile modulus value was increased from 19.00 ± 2.83 to 80.55 ± 6.75 GPa. This shows that the effect of carbonization prompted the growth in tensile properties, owing to the positive impact of improvements in the densification of the aromatic carbon clusters.
A comparison of tensile strength and tensile modulus as a function of fiber diameter is illustrated in Figure 12. The tensile properties of carbon fibers increase with decreasing fiber diameter because of increased structural improvements. Increasing the carbonization temperature resulted in a lower number of structural imperfections, including microvoids, resulting in increa Comparison of the tensile strength (a) and tensile modulus (b) of PA66-based carbon fibers for different fiber diameters (2.5 °C/min heating rate).
The formations of structural defects such as micro or nano-sized voids, surface irregularities, cavities, and flaws are known to occur in the decrease of the experimental mechanical properties 78,79 (Figure 13). The tensile properties of the carbon fiber samples presented in Figure 11 and Figure 14 confirm the strong dependence of carbonization temperature and gauge length. Figure 14 confirms the strong dependence of gauge length of the carbon fibers produced at 500–1100°C. It shows that with the increase of gauge length, the tensile strength values are noticed to be decreased. The observed decrease with increasing gauge length in tensile strength values is attributed due to the existence of more structural defects located across the length of the carbon fibers.78–80 By the extrapolation to 1 mm gauge length, the tensile strength values showed an improvement from 144 to 794 MPa (Figure 14) when the temperature was increased from 500 to 1100°C. The observed growth in tensile strength values is accredited to the decrease of the structural defects along the length of the carbon fibers.78,79 Schematic representation of structural defects incorporated in carbon fibers.
79
The gauge length dependence of tensile strength of the carbon fibers attained at a carbonization temperature of (a) 500°C, (b) 600°C, (c) 700°C, (d) 800°C, (e) 900°C, (f) 1000°C, and (g) 1100°C. Correction of the experimental tensile modulus.

Porosity (%), experimental, and corrected tensile modulus of the carbon fibers for different carbonization temperatures (2.5 °C/min heating rate).
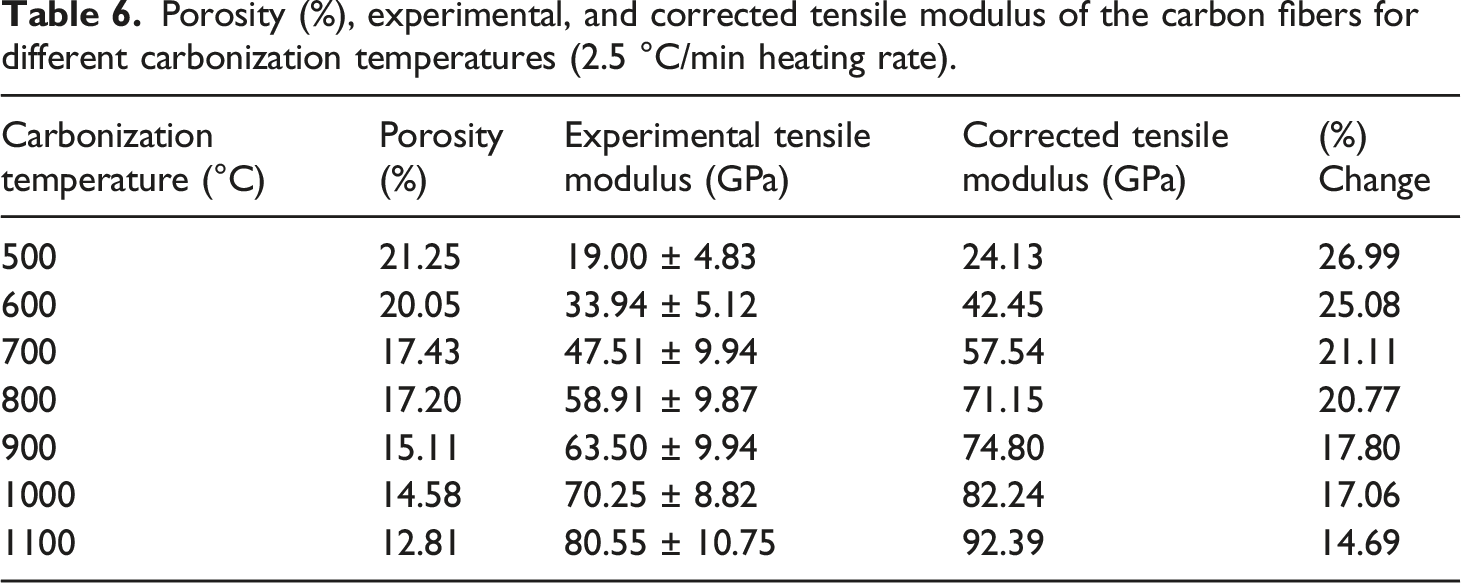
In published works, it was proven that the presence of microvoids has a negative influence on the mechanical properties of carbon fibers. The values of tensile modulus of the carbon fibers, produced at 500–1100°C, are corrected 71 to counter the negative effects of microvoid formation using equation (4). The values of tensile modulus, after correction to counter the negative effects of microvoid formation, are summarized in Table 6. This outcome demonstrates that at temperatures between 500 and 1100°C, the values of tensile modulus increase between 27 and 14.7%, respectively.
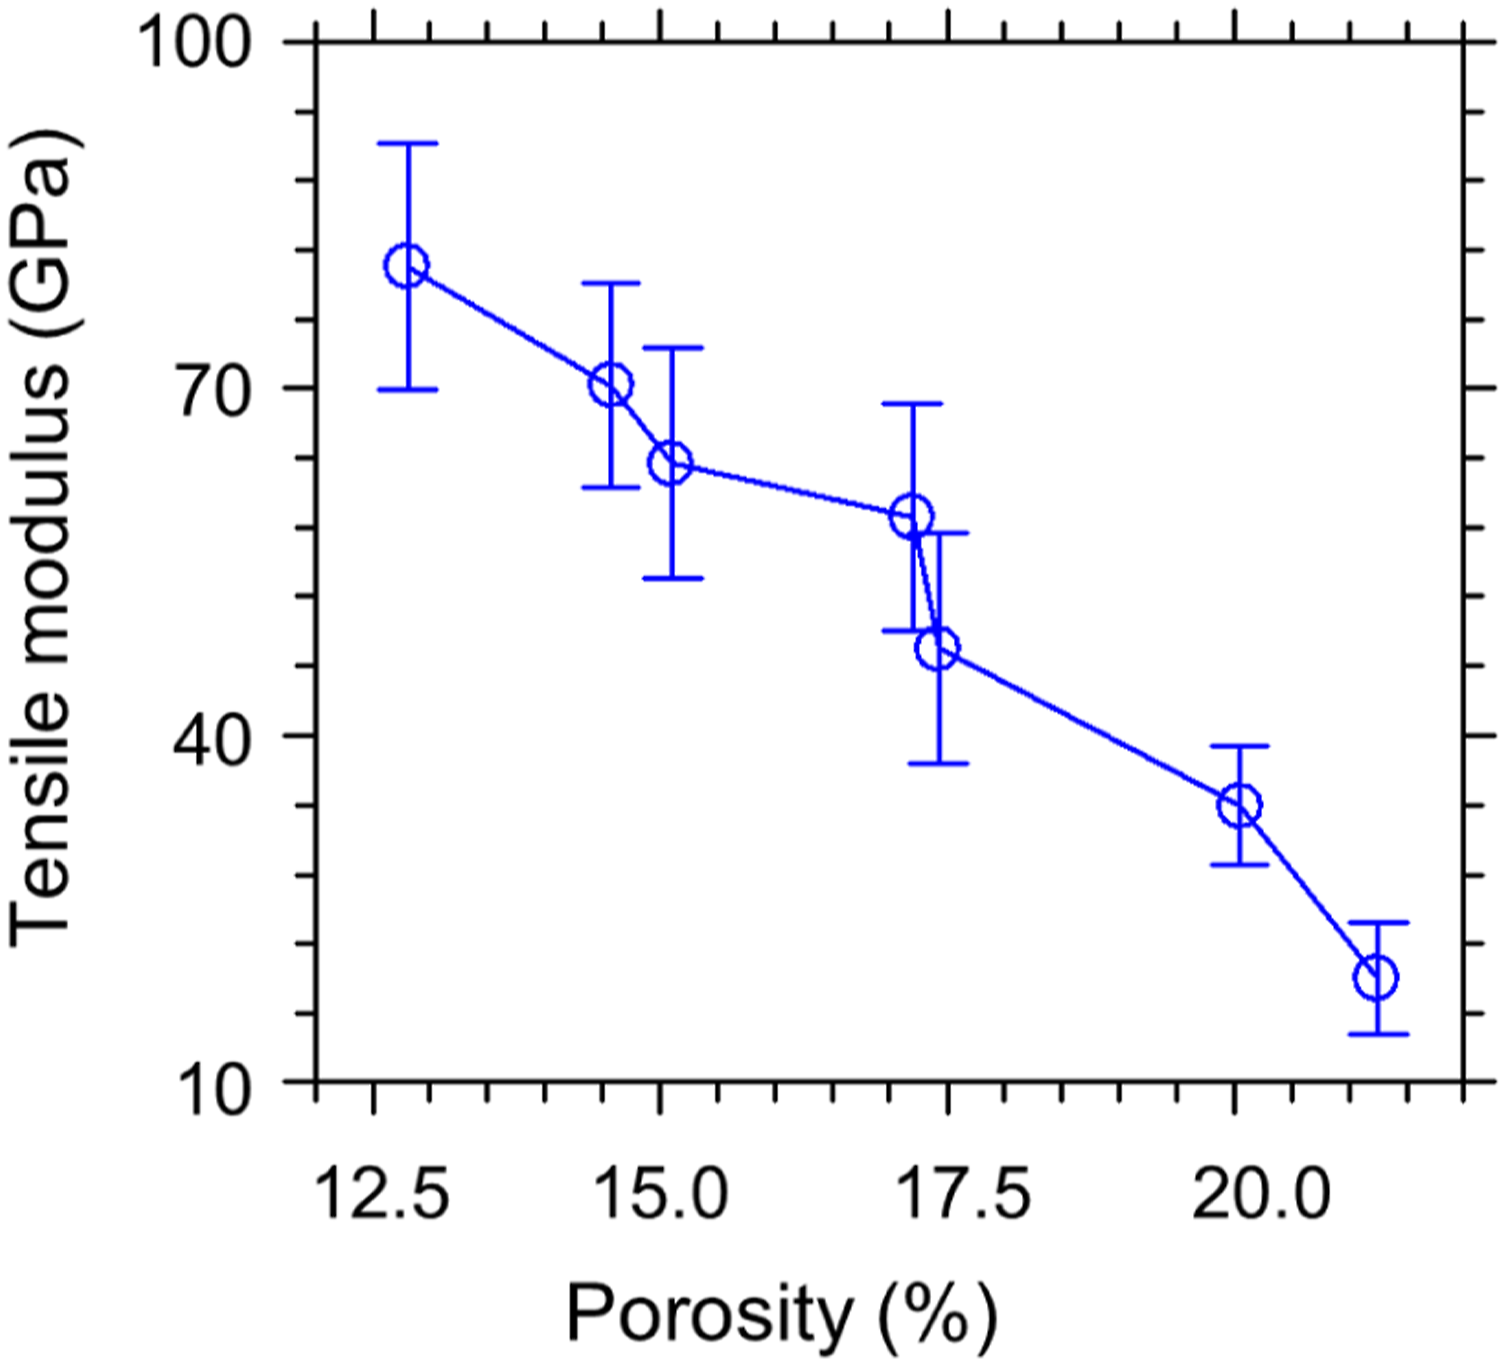
The corrected tensile modulus values show variation between 24 and 92 GPa (Table 6, Figure 15). Table 6 and Figure 16 demonstrate that the tensile modulus values decrease with the increasing porosity ratio. It appears that porosity fractions decrease with increasing carbonization temperature (Table 6, Figure 16). The results confirm that microvoid formation during the carbonization phase has a negative influence on the tensile modulus values of the carbon fibers. Comparison of the experimental (O) and the corrected () tensile modulus for different carbonization temperatures. Comparison of experimental tensile modulus values against porosity (%).
The theoretical tensile strength and modulus values of perfect graphite are stated to be around 180 and 1000 GPa, respectively.5,81 It appears that the tensile modulus value of commercial carbon fiber (Cytec Thornel pitch-based carbon fiber K-1100) is reported to be around 965 GPa. 5 Owing to the formation of structural defects, for instance, surface cracks/flaws, surface nicks, entanglements, and internal and external micropores (i.e., micro/nano voids), the values of tensile strength of the carbon fibers are reported to be an extent lesser than the theoretical tensile strength value of perfect graphite. The tensile strength value of the commercially available carbon fiber T1000 produced by Toray (Japan) is around 7 GPa. 81 According to the published literature, the values of experimental tensile strength of carbon fibers are affirmed to be around 10–20% of the theoretically estimated values. 5 Therefore, there exists a significant potential capacity for further improvement in the tensile strength of carbon fibers in the near future. 81
Electrical conductivity
Electrical properties of carbon fibers obtained from thermally stabilized PA66 fibers for different carbonization temperatures (2.5 °C/min heating rate).
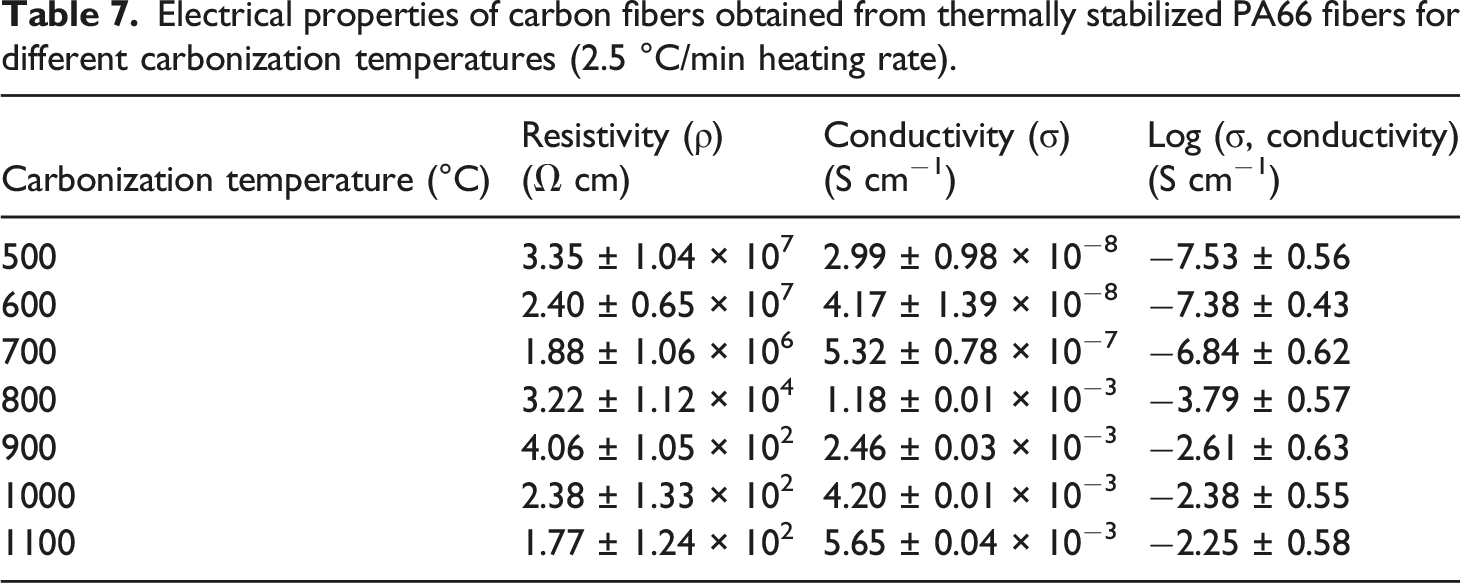
The correlation of electrical conductivity at room temperature and the carbonization temperature is illustrated in Figure 17. Owing to the removal of non-carbon components, for example, nitrogen, oxygen, and hydrogen in the carbonization process at 500–1100°C, the carbon content in carbon fibers displays an increasing trend (see Table 4), and highly conducting non-graphitizing carbon clusters appear to be generated, causing an increase in electrical conductivity. The value of electrical conductivity was found as 2.99x10⁻⁸ S cm−1 at 500°C and it increases sharply to 5.65 × 10⁻³ S cm−1 at 1100°C, that is, by about five orders of magnitude, owing to the development of polyaromatic species and the rise of hexagonal-shaped carbon layers. Comparison of electrical conductivity of PA66-based carbon fibers for different carbonization temperatures.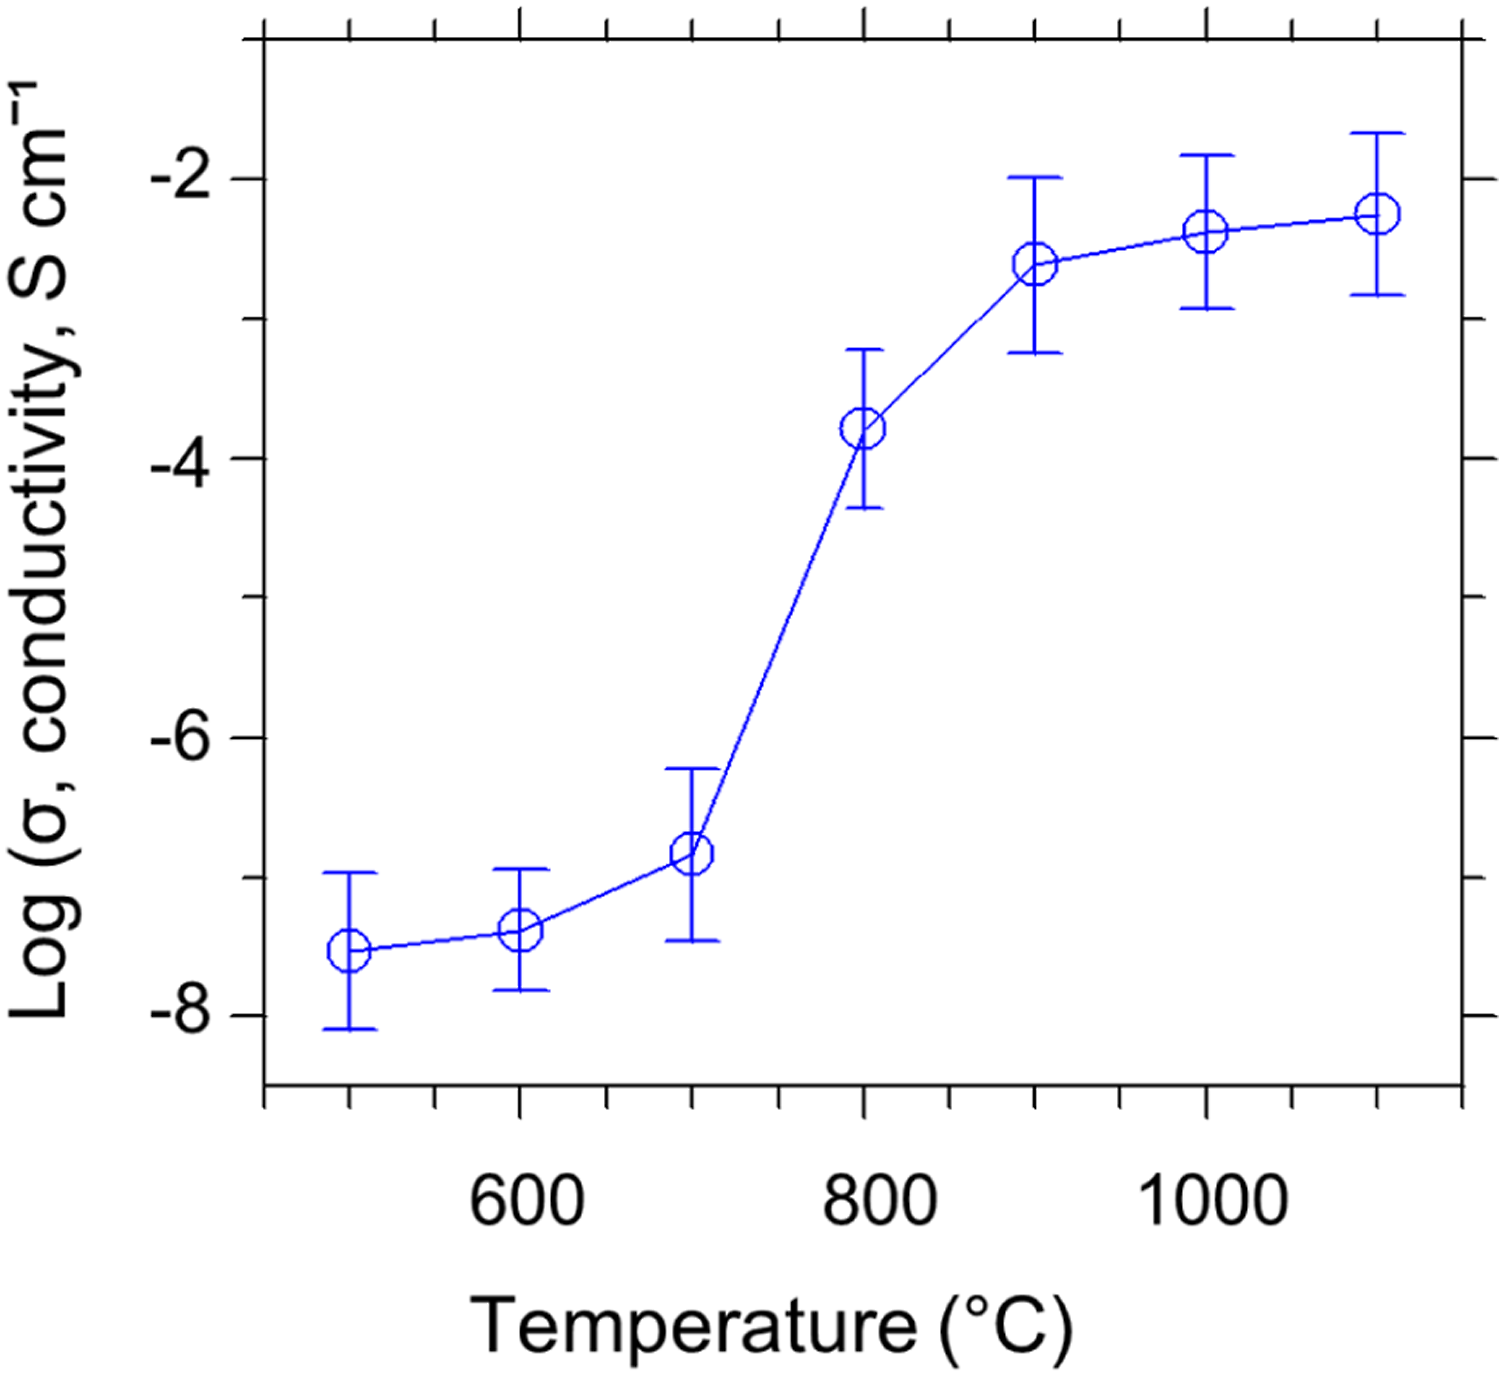
In the investigation of the equatorial X-ray diffraction results, the stacking height (Lc) of carbon layers was noticed to upsurge, and the d-spacing was seen to drop gradually by intensifying temperature. The outcomes recommend that the development of aromatic carbon clusters is most likely to be accountable for the practical enhancement in electrical conductivity. By intensifying the carbonization temperature from 500 to 1100°C, the electrical conductivity appears to be highly dependent on the development and upsurge of conducting aromatic carbon clusters comprising graphene planes. The size and concentration of the conducting aromatic planes indicate an increase with rising temperature, explaining the overall enhancement in electrical conductivity. 84
The outcomes mentioned in Table 7 recommend that the PA66 precursor fiber, being a typical insulator, becomes a semi-conducting material after thermal stabilization and carbonization reactions. The electrical conductivity of the carbon fibers was much greater than the untreated PA66 precursor fibers and much lesser than pure graphite (2.5 × 10⁴ S cm−1). The electrical conductivity of PA66-based carbon fiber carbonized at 1100°C was measured as 5.65 × 10⁻³ S cm−1, which is comparable to carbon fibers derived from rice husk [89]. The electrical conductivity of the rice husk carbonized at 900°C was mentioned to be 3.28 × 10⁻⁴ S cm−1. 85 Indeed, this value should be much higher if the carbonization is performed at 1100°C.
Scanning electron microscopy
Scanning electron microscopy was utilized to examine the surface characteristics of original and carbonized PA66 fibers in the current study. The representation of the surface morphologies of the original PA66 fibers is presented in Figure 18. Representative surface morphologies of original PA66 fibers.
Figure 19 shows the morphological images of carbonized samples for different carbonization temperatures. The SEM study revealed that surface properties do not show apparent changes up to 700°C carbonization temperature. However, the SEM images of the carbon fibers produced at temperatures of 900 and 1100°C indicate a number of tiny groove-like holes on the fiber surface, and the copper salts were excreted through the holes. Layden
86
explored the development of core segments in stabilized PAN fibers and reported that the temperature in the inner portion was greater than the temperature on the surface. Hence, it is assumed that the heat applied in the stabilization process will enhance cyclization and contribute to the development of a misoriented ladder-like polymer in the core area of the fibers. Therefore, the diffusion of oxygen from the surface area is likely to be reduced by the misoriented core region.
87
Representative surface morphologies of the carbon fibers attained at a carbonization temperature of (a) 500°C, (b) 700°C, (c) 900°C, (d) 1100°C.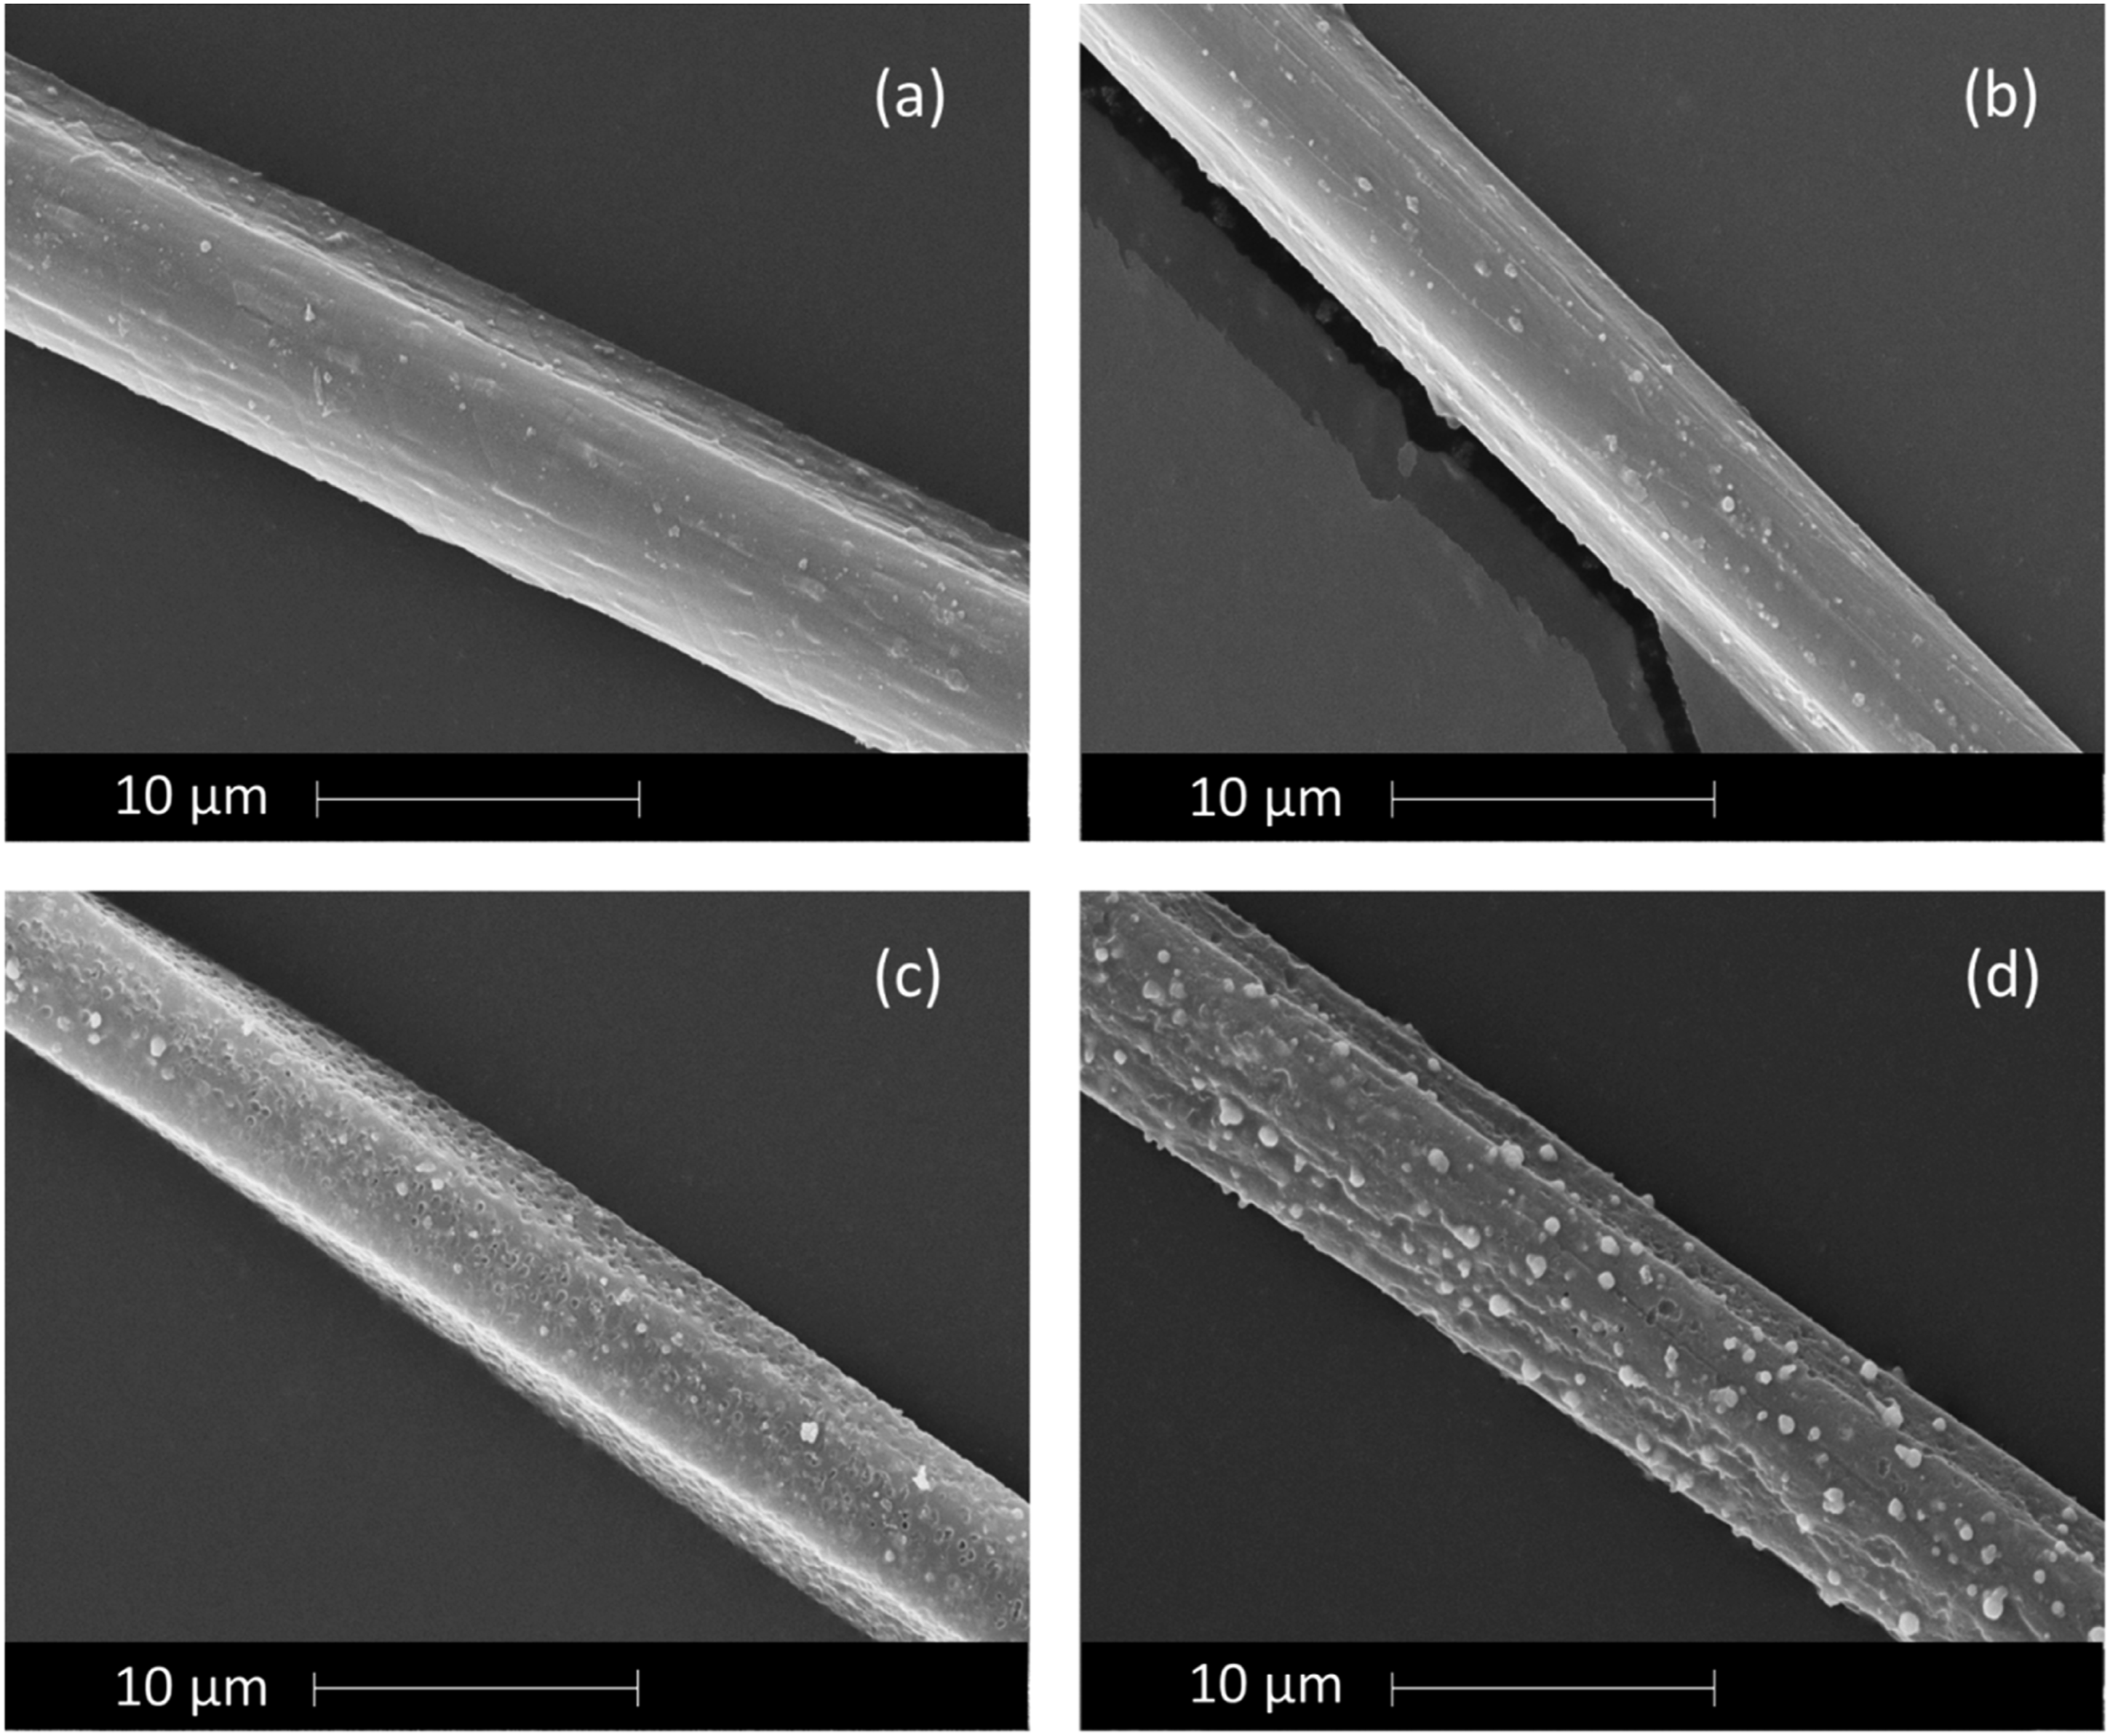
Conclusions
The main purpose of the present investigation was to understand and monitor the effects of the processing parameters and structural defects on the properties of carbon fibers derived from thermally stabilized PA66 fibers impregnated in the presence of cupric chloride-ethanol solution. A two-step stabilization procedure in an air atmosphere was employed for the heat stabilization of PA66 precursor fibers. The physical and mechanical properties of the carbon fibers were evaluated at the chosen temperatures of 500, 700, 900, and 1100°C employing the 2.5°C/min and 5°C/min heating rates for comparison purposes, and finally 2.5°C/min heating rate was decided to employ as it offers better properties in the resultant carbon fiber. The outcomes demonstrated that the linear density and fiber diameter values declined with increasing temperature due to the evolution of volatiles. The PA66 fibers had a carbon yield of 44% when carbonized at 1100°C, which is comparable to 63.7% as the theoretical value. Structural defects are supposed to occur during the fiber extrusion as well as during the thermal stabilization and carbonization steps. The mechanical properties of the carbon fibers were subjected to corrections after taking into account the effects of structural imperfections. By considering the influence of structural defects, the values of tensile strength and modulus of the carbon fibers, after carbonization at 1100°C, increased to 794 MPa and 92.4 GPa, respectively. The existence of the greatly disordered aromatic carbon structure, which developed in the carbonization process, was revealed by the X-ray diffraction analysis of the carbon fibers. FT-IR analysis confirmed the formation of highly aromatic carbon clusters at temperatures of 500°C and higher. The electrical conductivity of carbon fiber at the temperature of 1100°C was noticed to increase to 5.65±0.04x10⁻³ S cm−1. It appears that the PA66 precursor fibers acquire a semi-conducting state following the thermal stabilization and carbonization procedures.
Footnotes
Declaration of conflicting interests
The author(s) declared no potential conflicts of interest with respect to the research, authorship, and/or publication of this article.
Funding
The author(s) received no financial support for the research, authorship, and/or publication of this article.