
Abstract
Electrospinning process has been widely used over the past decades for manufacturing nanofibers. The control of the electrospinning parameters is crucial to obtain nanofibers (nonwoven mats) with optimized morphological properties. The aim of this study is to precisely define the electrospinnability of a meta-aramid solution through wire-based electrospinning setup processing. Experiments have been conducted following a design of experiment to study the influence of each parameter. Individual effects and/or combined interactions on obtained fiber diameter and general morphology (mean fiber distribution and nonfibrous area) have been investigated. The five studied process parameters are: applied voltage, relative humidity, temperature, distance between spinning electrode wire and substrate material, and airflow going through the spinning chamber. Each parameter was varied at three levels. Significant effects of parameters have been observed. The obtained results have allowed us to determine the influential factors and reduce the domain study.
Introduction
Electrospinning is a well-known technology for the production of electrospun fibers (ultra-fine fibers) whose diameter ranges from 10 to 2000 nm. Fundamental reviews for an understanding of the electrospinning process have been published. Nanofiber properties and their main application domains have been investigated by several authors, among whom those of Reneker et al. [1], Ramakrishna et al. [2], and Chronakis [3] may be the most exhaustive.
Due to their long lengths, nanoscale diameters, and large surface area per unit of mass, nanofibers have found the widest interest in filtration. The use of those materials can enhance the efficiency of conventional filters in the nonwoven industry, particularly for ultrafine filtration purpose. Since the 1990s, versatile single-needle laboratory-scale setups were sufficient to conduct the experimental research, with an average throughput around 0.1–1 g/h by fiber weight [4]. An annual laboratory-scaled production can be estimated between 300 g and 3 kg per year, which cannot be compared to the millions of tons produced by conventional spinning of fibers. The last report dated from May 2013 of BBC Research announced that the global market for nanofibers “is forecast to grow at a compound annual growth rate (CAGR) of 30.3% from 2012 to 2017, reaching a global revenue of $570.2 million by 2017” [5]. Following this increasing industrial demand, huge efforts have been made on scientific research in the last decades to enhance the electrospinning productivity.
To increase the electrospinning production, two methods have been developed based on multi-jet electrospinning: multineedle (MN) and needleless electrospinning (NE). Both methods are of interest, but for this study, only NE (also called free surface electrospinning) approach will be further developed. Concerning NE, a first method of electrospun mass production was presented by Yarin and Zussman [6], based on a combined effect of normal magnetic and electric field upon two distinct layers of ferromagnetic fluid and polymer solution. The second method was developed by Jirsak et al. [7] from the technical university of Liberec. In this needleless method, patented in 2005 under the name “roller electrospinning” and commercialized by Elmarco company under the name “Nanospider” since 2005, a slowly rotating roller is partially immersed in polymer solution. This equipment is designed for continuous nanofiber layer production. The roller is connected to a high voltage source and an upper collector is grounded or negatively charged. During the electrospinning process, polymer solution is coated on the surface of the rotating roller. When suitable voltage is achieved, numerous solution jets are simultaneously initiated on the top surface of the roller producing nanofibers that reached the collector. A study conducted by Petrik and Maly [8] in 2009, comparing MN and NE shows that the space and the number of jets set up spontaneously in their optimal configuration, which is a major advantage for this technique. By comparison in the MN systems, needle’s optimal configuration has to be precisely adjusted, and needles are submitted to clogging effects. To improve the productivity rate and decrease the free-contact zone between the solution polymer and ambient atmosphere the second generation (Gen2) of spinning electrode, the stationary wire electrode system, has been launched in 2010 for the 1.6 m wide working width NS 8S1600U industrial line [9]. The Gen2 has been adapted to NS LAB line since 2014, allowing direct transposition of the obtained results to the industrial line. Several research works in the open literature consider multiple parameters influences to achieve optimization of the process but only a few of these studies are dedicated to the high throughput device [10–12].
From an industrial point of view, the NS LAB line that we used to produce nanofibers presents a huge interest for studying the up-scaling of nanofibers production. In this study, the results on an up-scaled 500 mm wide working width wire-based electrospinning setup are presented.
The aim of our study is to give an effective method using an optimal design of experiment to investigate a new solution of polymer to be electrospun. Our interest in this study is not about what kind of polymer solution is used, but how the control of electrospinning process can be achieved for further possible industrial-scale production. In order to determine the influence of the process parameters on physical properties of the electrospun nonwoven, our experiments have been conducted following a design of experiment (DOE) to compare the influence of each studied parameter whether separately or with their interactions. A focus has been made on the influence of the environmental parameters (humidity and temperature) and the results have been confronted to a former study conducted in 2010 by Dao and Jirsak [13]. Moreover, an estimation of the capacity of production for the NS500 has been calculated for the tested meta-aramid solution.
Experimental section (methods and materials)
Materials
Polymer solution
A couple polymer/solvent of meta-aramid polymer (polyamide-imide) in a polar aprotic solvent (1,3 dimethyl-2-imidazolidinone) at 60 Pa·s in working viscosity is provided by an industrial partner (KERMEL Company). It has been highlighted through rheological study that 60 Pa·s is the best polymer viscosity to obtain good macromolecular conformation of the polyamide-imide chains while electrospinning and sufficient viscoelastic properties [14].
NS 1WS500U “Nanospider™” electrospinning setup
NS 1WS500U (NS®) “Gen2” from Elmarco Company is used to conduct all experiments on the meta-aramid solution. In this free-surface technology, needles are replaced by a wire electrode coated with the polymer solution. The spinning electrode is a stationary wire onto which the spinning solution is continuously deposited by a special carriage. The carriage, driven by a pneumatic system, is a moving tank with a calibrated metal orifice inserted through which the spinning electrode wire is drawn. The spinning solution flows out from the orifice during movement of the carriage and is applied on the spinning electrode wire surface. Furthermore, the wire is continuously rewound so neither the evaporation of the spinning solution from the free surface nor the drying of the polymer on the wire occurs. The spinning and collecting electrodes are connected to high voltage power supply. During free-surface electrospinning operation, the NS® is secured by protective components to prevent access to the spinning chamber. When the high voltage field is applied the electrostatic force overcomes the surface tension of the solution and, therefore, the polymeric solution is attracted to the area with lower electric potential and Taylor cones and jet formation are initiated. While the filament is traveling to the collecting electrode, solvent evaporates and fibers get stretched, split, and deposited onto a moving substrate material/collector adjacent to the collecting electrode. We choose to spin the meta-aramid solution on a siliconized backing paper as a collector where the adhesion is minimized in order to remove the nanofiber layer from the substrate easily for weighting and observations.
Process parameters and choice of the variables
The obtained nanofibers are expected to have thin diameters with high homogeneity of the products, i.e. low levels of beads, residual solvent or nonfibrous area, and a narrow fiber diameter distribution, in order to validate the industrial requirements. A wide range of process parameters are available with the NS® technology. The viscosity of the meta-aramid solution fixed at 60 Pa·s has been found to be the optimum one to obtain nanofibers according to a former rheological study [14]. All other process parameters are investigated in order to obtain the best quality of production.
Reservoir of polymer solution is fully filled (40 mL) for the longest processing time, standard wire diameter of 0.2 mm is used, and 300 mm is the standard width of our silicone paper substrate/collector. The smallest metal insert with calibrated orifice (0.5 mm) and the slowest spinning electrode wire speed (0.5 mm/s) are selected regarding the solution viscosity. It has been concluded that small orifice allows a better stretching and repartition on the spinning wire and a slow speed gives the polymer solution enough time to be stretched by electrostatic field. The lowest substrate speed (15 mm/min) is selected to obtain a thicker nanofiber layer. A medium value of carriage speed (200 mm/s) is chosen to continuously renew the polymer solution on the spinning wire electrode.
Temperature and humidity are controlled by air conditioner and humidifier in the laboratory working area, which are the most complex parameters to be kept at fixed values (40–50% for relative humidity and 22–28℃ for temperature). Therefore, low airflow (20–60 m3/h) and short processing time (10 min) are chosen to maintain ambient parameters at stable values. All range of distances (125–290 mm) are investigated. Voltage of 50 kV value is selected as the lower limit of voltage that initiates jet formation for a fixed distance of 290 mm, otherwise voltages from 50 kV to 100 kV are investigated.
Settings.

Characterization of nanofibers
Surface morphology analysis of the electrospun meta-aramid nanofibers was assessed by scanning electron microscopy Hitachi S-2360N (SEM) after being gold-coated. Three SEM pictures are taken on each sample. Diameter measurements of 20 to 25 are considered for each SEM pictures at 10k magnification using Image J software, in order to calculate significant fiber diameter distribution including standard deviation. The mean fiber diameter (MFD) is calculated as an average from 60 to 75 diameter measurements of randomly selected fibers, the relative standard deviation (RSD) is determined, and coefficient of variation (CV%) is calculated according to the following equation15

Nonfibrous areas (NFA) were measured on each SEM pictures at 5 k magnification (Image J software). The nonfibrous area is defined (equation (2)) as the residual solvent area (beads are also counted in that measurement) and is used as an estimation of fiber morphology or nanofiber nonwoven criterion of quality (our formula is adapted from research article of Dao and Jirsak [13]). NFA is calculated for a minimum of three different SEM pictures as the sum of all beaded or solvent area on the total area of the SEM picture

Experimental design
Levels of factors for DOE – Study domain.
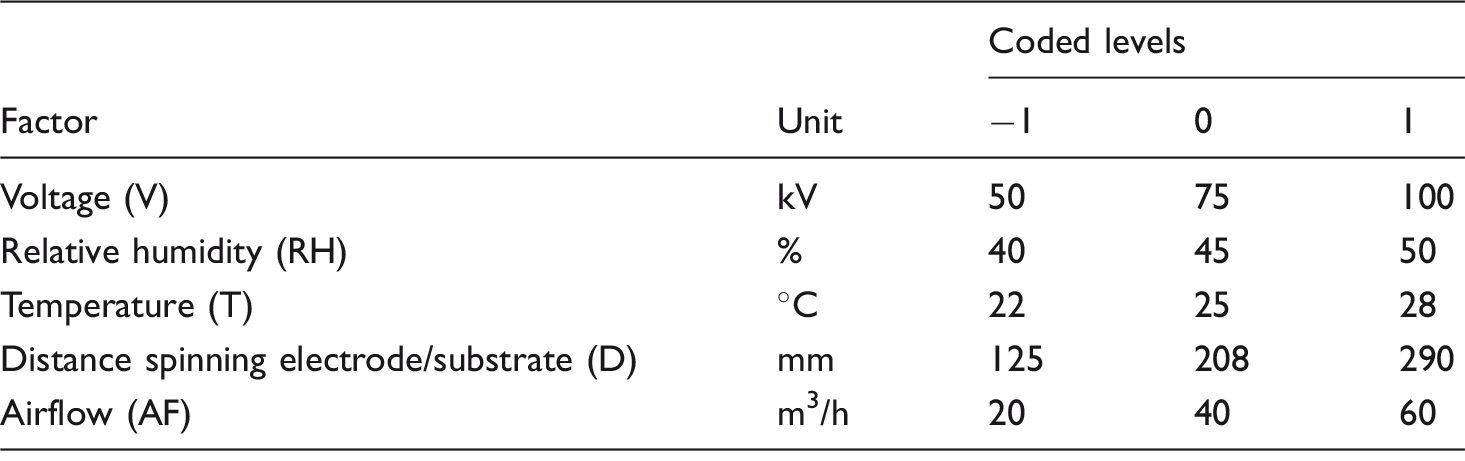
The studied responses of the DOE are: mean fiber diameter (MFD in nm), coefficient of variation (CV %), and nonfibrous area (NFA %).
Results and discussion
The main objective of this study is to obtain a qualitative index of homogeneity and quality of our electrospun production. The influence of each parameters and combination of parameters on MFD, fiber homogeneity and quality (CV and NFA) has been firstly investigated. Then, the main factors have been detected. D-Optimal DOE have been generated (thanks to Modde 6.0 Software, developed by Umetrics) and followed, for a total of 20 experiments.
SEM analysis
Fiber diameter characterization
Twenty experiments have been conducted, and each sample produced through NS® is observed on SEM. Diameters of fibers are ranged from 30 to 664 nm, MFD are ranged from 81 to 183 nm, and CV are ranged from 11% to 60%. SEM observations of three experiments, selected among the 20 are shown in Figure 1 to illustrate the differences in obtained results for the all study domain, with MFD measurement and distributions of fiber diameter histograms. Spinning conditions and obtained results of these three experiments are reported in Table 3.
SEM pictures for MFD measurement of two experiments (N1 and N8) at the edge of the domain study and one at the center (N17) + fiber diameters distribution histograms. Experimental conditions and statistics of MFD and NFA measurement. MFD: mean fiber diameter; CV: coefficient of variation; NFA: nonfibrous area.

It can be observed that fiber diameters, diameter distribution, and CV presented in Figure 1 are strongly dependent on the spinning parameters values. Histograms of fiber diameter distribution seem to indicate a Gaussian distribution for each sample.
NFA measurements
Beads and other NFA are measured on the pictures at 5k magnification (Figure 2). Ellipses are drawn to approximate the NFA zones, and are measured thanks to Image J software.
SEM pictures for NFA measurement of two experiments (N1 and N8) at the edge of the domain study and one at the center (N17).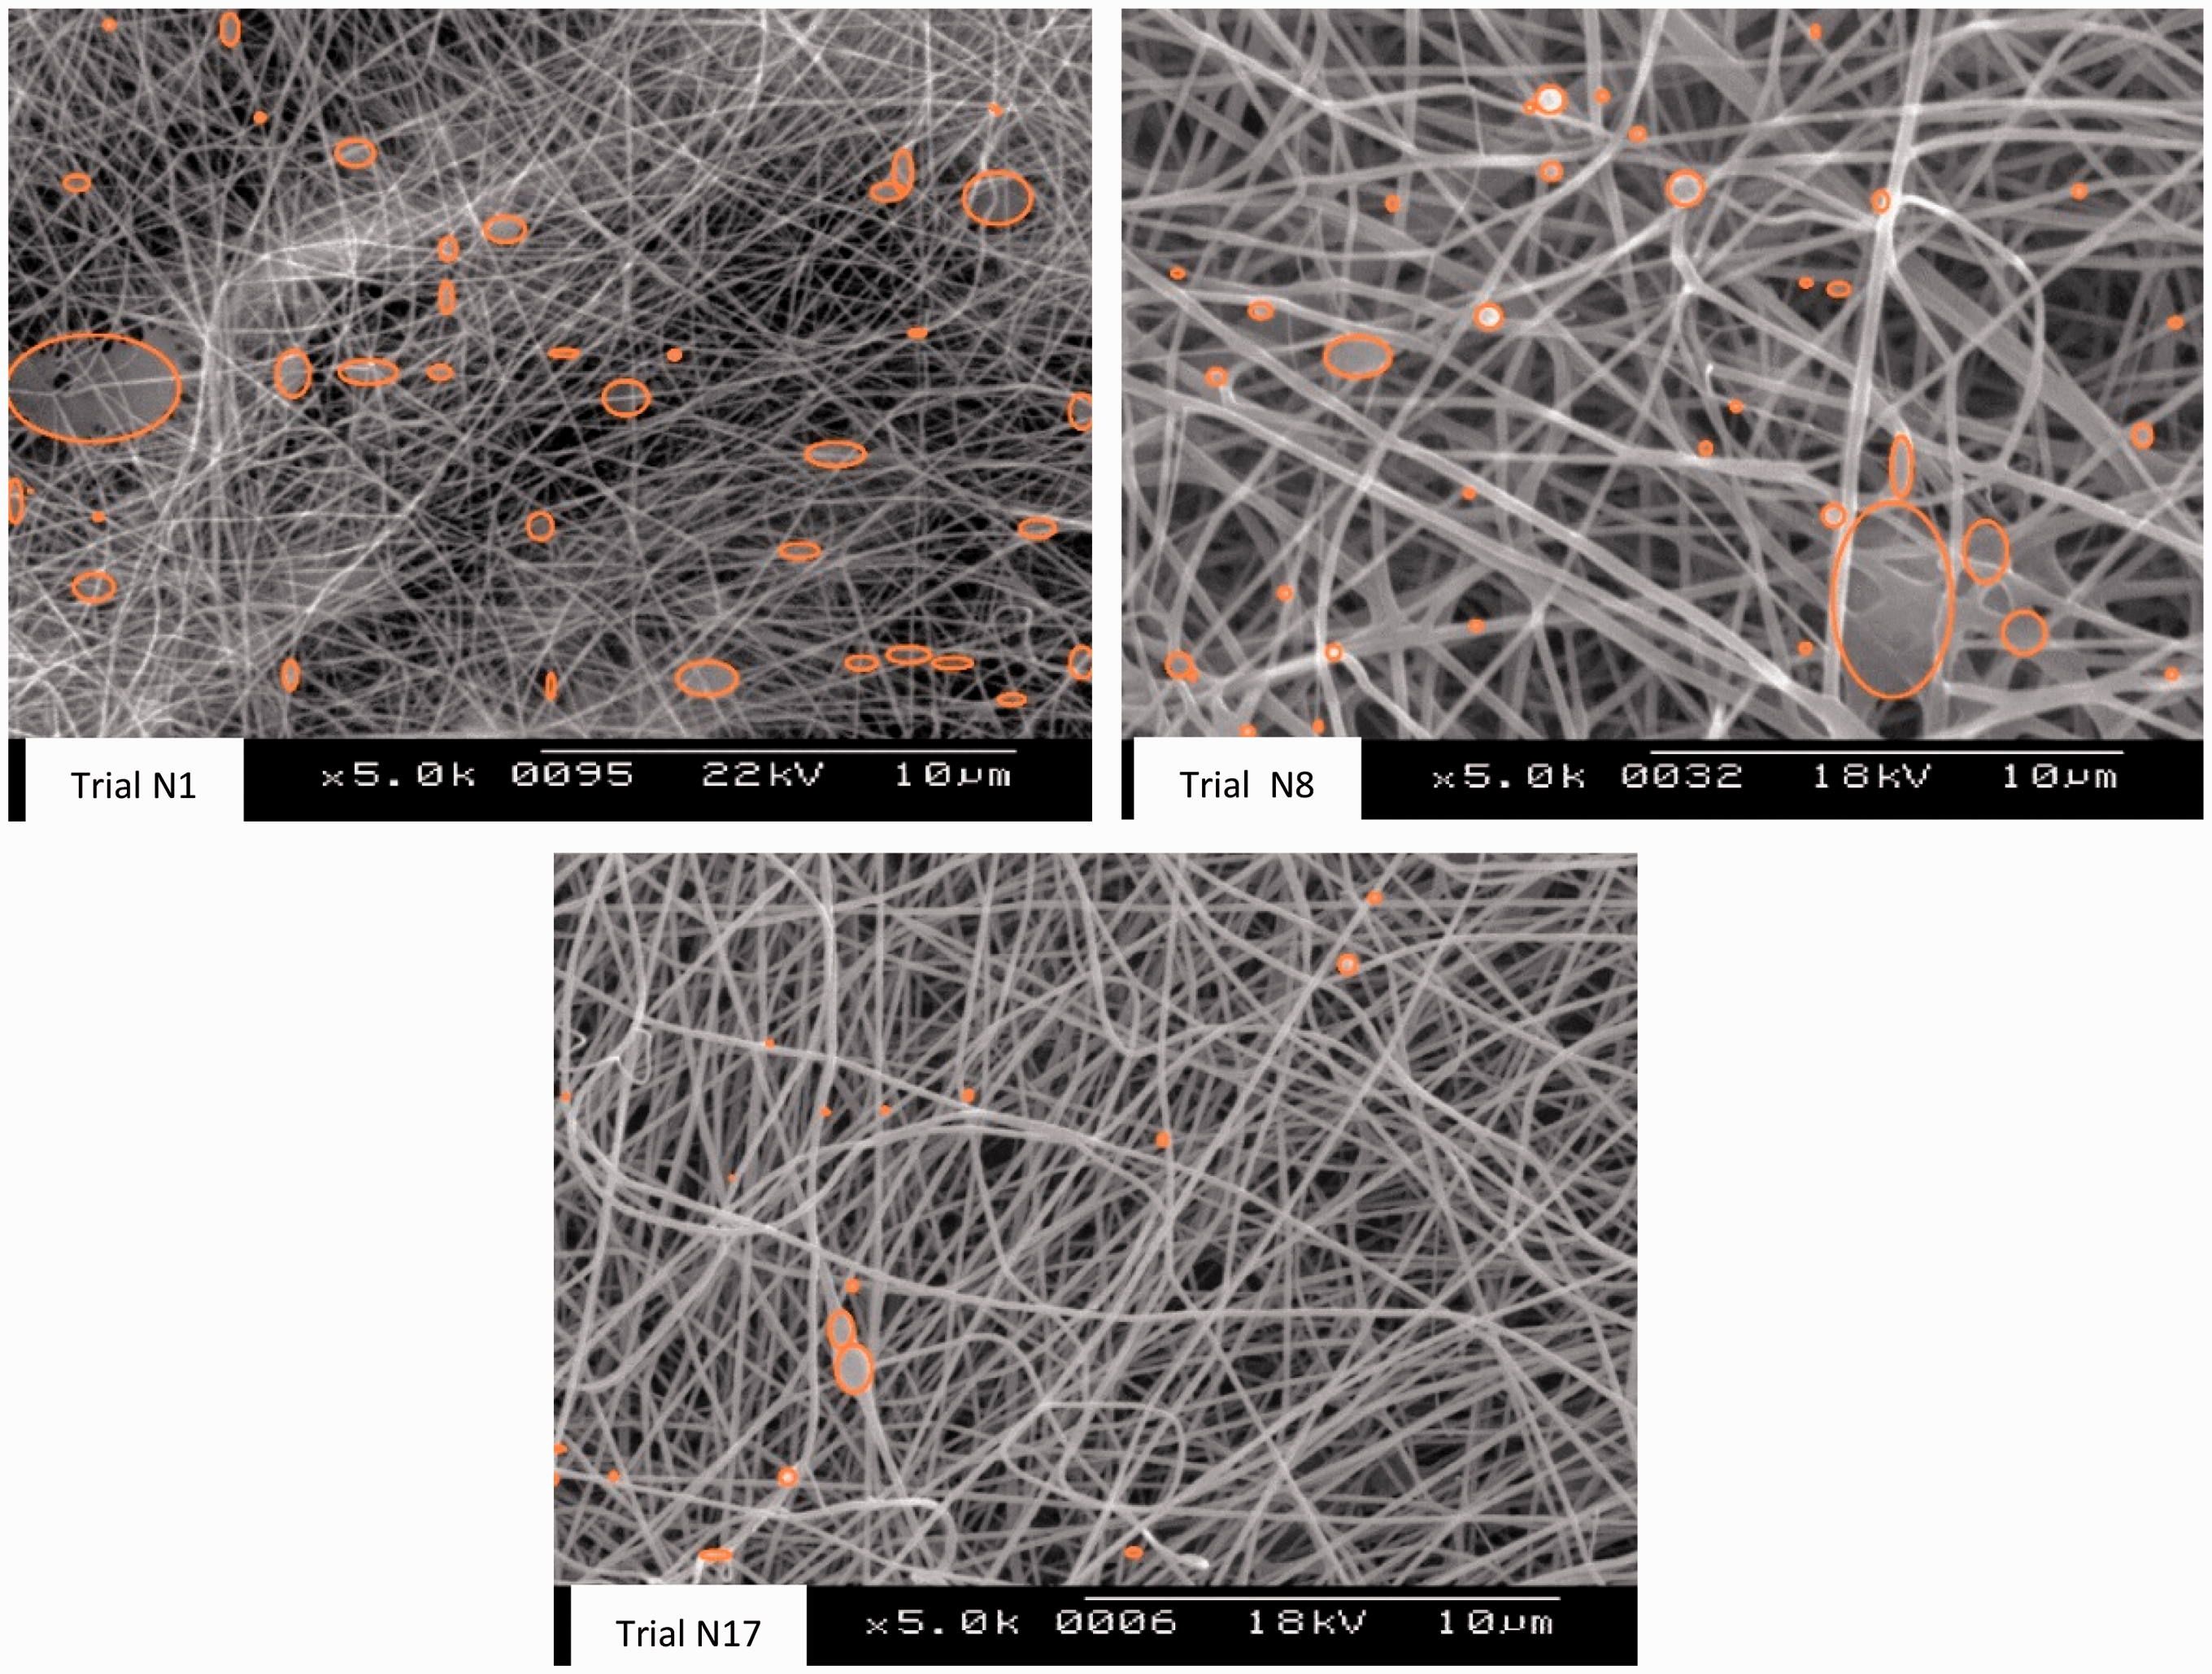
D-Optimal design
DOE factors and experiments results (highlighted lines are excluded values from the model).

MFD: mean fiber diameter; CV: coefficient of variation; NFA: nonfibrous area.
Constraints
At lower distance (125 mm) between spinning and collecting electrodes maximum voltage (100 kV) was not possible to set. We choose to minimize the high voltage value by 10 kV in order to run this experiment.
Modeling
We proceed to the calculations and principal statistics like the standard deviation, p-values, and R2. A first-degree model with interaction is generated for evaluation of the responses


Coefficients and significance of the model for MFD.

Coefficients analysis
Partial least square (PLS) linear regression is a standard approach to approximate the solutions of overdetermined systems and to compare the experimental data to the obtained mathematic model. Coefficients of the factors and significance probability (p-value) were obtained by PLS linear regression for our reduced DOE. They are reported in Table 5.
According to equation (1), the obtained first-degree model with interaction is:

Eleven coefficients have been determined in our model for the 16 experiments included. The value of the constant a0 is similar to the predicted responses at the center of the study domain (Trial nos. 18 and 19), and we can validate that first-degree model with interaction. Fisher F-test with low probability level (p model < 0.0001) also verified significance of the regression model. According to results in Table 5, MFD is significantly affected by three factors (p < 0.05): relative humidity, distance, and voltage, with relative humidity having the most pronounced effect. Several second-order interactions are significant as well: RH*AF, T*Dis, V*AF, and RH*T. As significant probability of V*RH is close to the probability level, we can assume that it also has slight influence on MFD. Graph of the effects in Figure 3, allow us to examine more precisely the importance of each coefficient.
Effects of factors and interactions at center level (standard error bar indicates confidence intervals CV at 95%).
In this display, the effects are sorted from the largest to the smallest. For process factors, the effect plot displays the change in the response when a factor varies from his low (−1) to his high (+1) level, all other factors are kept at their averages (0). Values of the effects are approximately twice the values of the coefficients, as the coefficients are the change in the response when the factors vary from the average (0) to the high (+1) level and the variation of the factors from low (−1) to average (0) levels are not taken into account. Factors or interactions where the confidence interval includes zero are insignificant. The graph in Figure 3 indicates positive effects of factors RH (relative humidity) and D (distance) and interaction T*D, while other factors and interactions have negative effects on MFD. It also shows that AF (airflow) and T (temperature) factors have no significant effects on MFD their effects could be either negative at low level or positive at high level.
Main effect plots and interaction plots of factor on MFD
The main effect plot displays the fitted values of the response with the confidence interval at the low and high value of the selected factor and at the center point while the other factors are kept at their average values. Main effect plots for all factors are illustrated in Figure 4.
Main effect plot on MFD for all factors.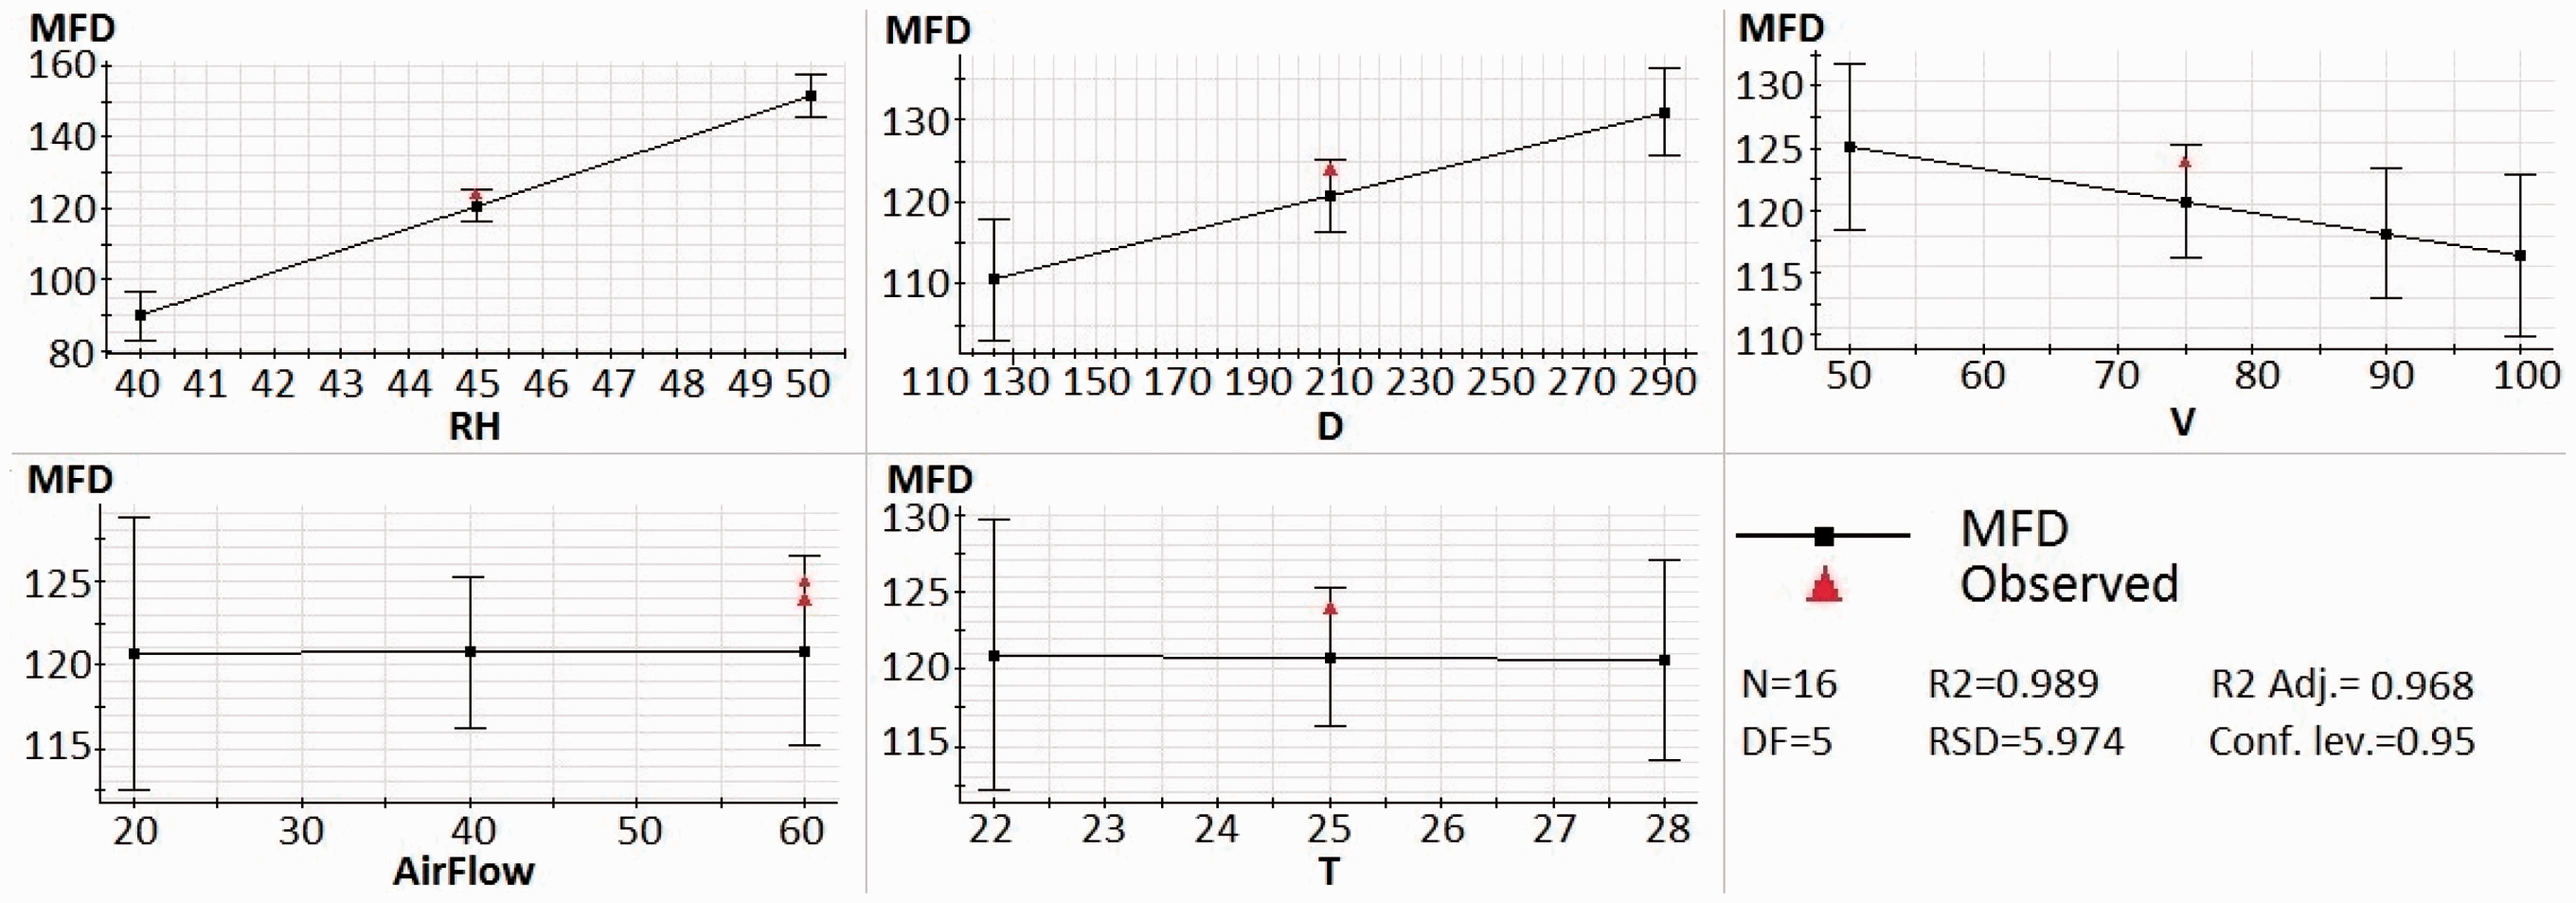
Main effect on MFD for all factors.

Interactions analysis
When we obtain an interaction between two factors, the effect of one of the factors depends on the level of the other factor. The plotting in Figure 5 displays the change in MFD when one factor varies, and the second factor is set at both its low and high level. When the two lines are parallel there is no interaction between these two factors. When the two lines cross each other there is a strong interaction.
Interaction profiles for all factors.
All plots in Figure 5 indicate that there are strong interactions between some factors of our model: V*AF > D*T > RH*AF > RH*T > RH*V, which proves the importance of studying the influence of the combination of factors on MFD instead of individual influence of factors on MFD.
Response surface modeling
RSM of mean fiber diameter
To complete this analysis, RSM is conducted to optimize and predict MFD of our electrospun meta-aramid fibers. Four-dimensional surface plots are displayed in Figure 6 in order to observe the influence of all factors on MFD.
Response surface modeling of MFD at fixed voltage of 75 kV.
According to Figure 6, thinner (MFD = 70 nm) and thicker (MFD = 180 nm) fibers are obtained when airflow value is low (20 m3/h). This is probably due to the fact that at low airflow no interference appeared in the electrical field. Meanwhile, variations of diameters are important (70–180 nm), because airflow is not important enough to obtain homogeneous ambient parameters. Relative humidity, in particular, has to be controlled at small airflow because it has the strongest impact on MFD. When relative humidity increases, two combined effects occur on MFD. One is due to the fact that our polymer solution is hydrophilic, therefore when relative humidity increases evaporation rate of the solvent is faster but some water may remain within the fiber. Secondly, an increase of relative humidity may interfere with the electrical field by reducing his strength which reduces the stretching of the polymer solution. These two combined effects caused an increase of MFD.
At higher airflow value (60 m3/h) MFD is equally dependent on relative humidity, temperature, and distance. Range of MFD is narrower (100–160 nm), which means that process conditions are more stable. Airflow is high enough to renew the ambient conditions and give homogeneous humidity and temperature. Distance strongly influences MFD, with MFD increasing when distance between spinning electrode wire and substrate material increases. Indeed, when distance increases electrical field decreases, which reduces the stretching of fibers. Other values of voltage are not been displayed, but the general aspect remains the same. The only difference is that all MFD values increased at 50 kV and decreased at 100 kV. Voltage has also a strong influence on MFD, which decreases when voltage increases. RSM is an important tool to further understand the combined influences of factors. To fully complete this study, and choose the best combination of process parameters to obtain minimum MFD, CV%, and NFA values, another RSM has been conducted for NFA.
RSM of NFA
Several zones are of interest to produce thinner MFD. We now have to determine the zones to avoid, which means to keep NFA as low as possible. RSM is conducted to predict NFA on our electrospun meta-aramid fibers. Four-dimensional surface plots are displayed in Figure 7 in order to observe the influence of all factors on NFA.
Response surface modeling of NFA at fixed voltage of 75 kV.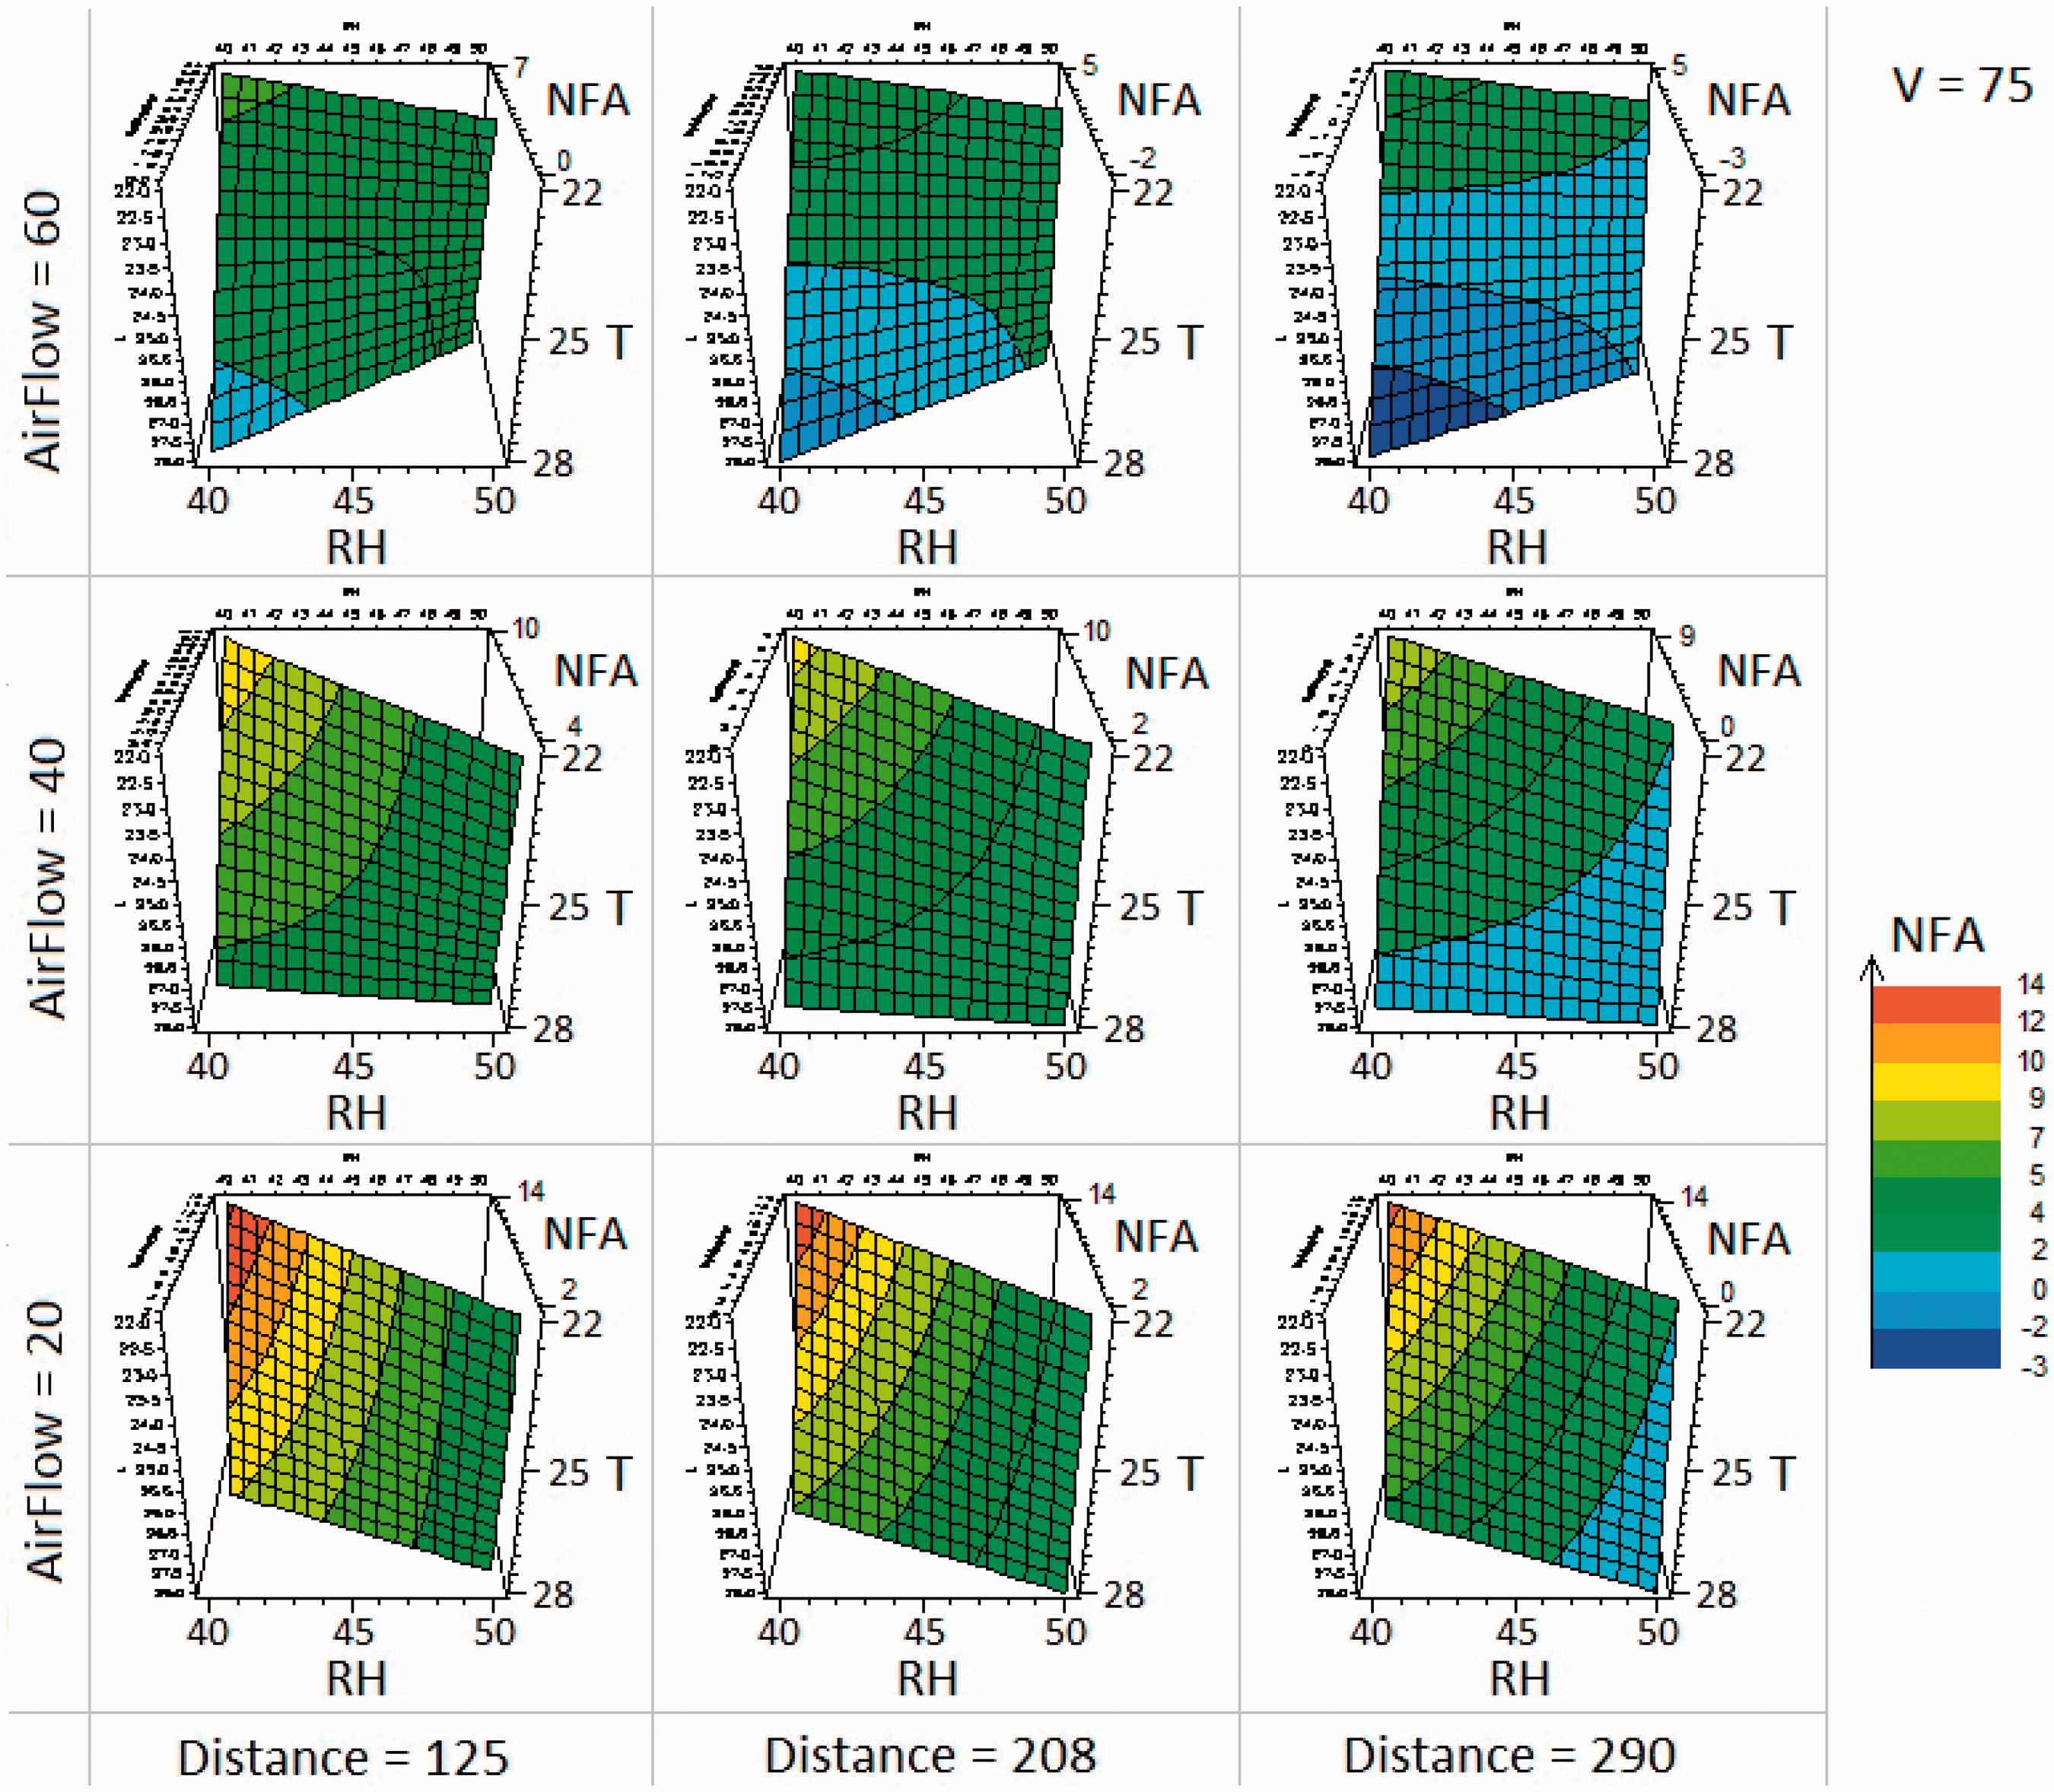
According to Figure 7, most of the lower NFA values correspond to the thinner MFD zones. Airflow, temperature, and relative humidity are the most influential factors for NFA. Voltage has no influence on NFA.
The observation of the response surface modeling of MFD and NFA had allowed us to reduce the domain of process parameters. We selected 0 to 5% of NFA as the acceptance values to obtain good nanofiber layer morphology, with a range of MFD from 90 to 150 nm.
When we applied 50 kV voltage, the MFD globally increased, so we selected a reduced domain of 75 to 100 kV for applied voltage. An increase of 10% of the relative humidity leads to an increase of 68% of the MFD, but it also leads to a better homogeneity of the nanofiber layer with limited NFA (0–5%). So in order to limit the MFD we choose to reduce the humidity range at 40–45%. The temperature has no impact on MFD, but a limited impact on NFA at high airflow (60 m3/h). We decided to keep a room temperature of 25℃ ± 1℃. An increase of distance leads to an increase of MFD and has no effect on NFA. We selected the range of distance where MFD comprised between 90 and 150 nm, which means a new range of distance from 125 to 208 mm. When airflow is up to 60 m3/h, the NFA is comprised between 0 and 5%, thus airflow should be maintained at 60 m3/h.
Acceptance domain of experiments.

Productivity
Spinning conditions for productivity calculation.
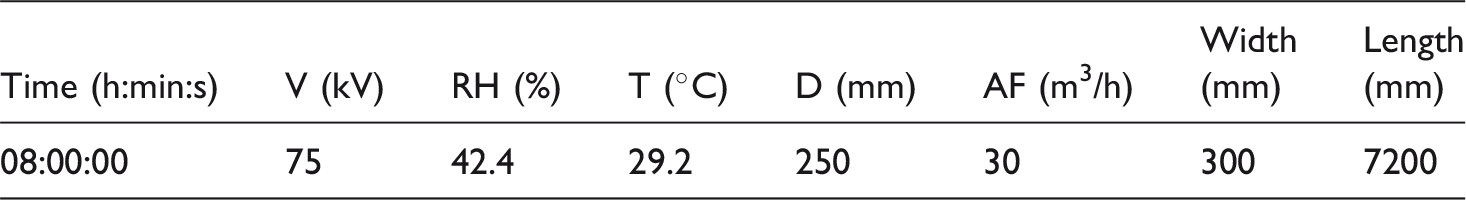
Twelve samples of 1 cm2 area have been weighted and an approximation of the nanofiber layer weight has been calculated. About 0.63 g of nanofiber have been collected on the siliconized paper used as collector. The production rate was about 0.08 g/h for the meta-aramid solution in our process conditions. MFD of produced nanofibers was 120 nm (CV = 27%).
The increase in productivity from the traditional electrospinning process (with a single needle) is interesting with a production rate 8 times more important for the NS®. The NS® LAB we use is a laboratory line device and is composed of only one “spinning module” in the spinning chamber. The two “industrial lines” of Elmarco have respectively 4 and 8 spinning. The production rate on these devices could be expected to be respectively 4 and 8 times more important than the production rate obtained on NS® LAB, thus an effective increase of productivity (32 times and 64 times more) is observed compared to the traditional electrospinning process.
Limitations
The present study has been conducted on a specific domain and predictions of nanofibers diameters can only be applied for parameters within this domain. However, the domain has been chosen as wide as possible. Complementary experiments have to be conducted to improve the productivity, and process parameters should be investigated to find most influential parameters on NS® LAB productivity.
Conclusions
Free-surface electrospinning of meta-aramid solution was processed. This study presents a complete methodology from conception of design of experiments to responses analysis (interpretation of coefficients, interactions, and response surface modeling). Fibers with diameters in the range of 30–664 nm, mean fiber diameter in the range of 81–183 nm, and coefficient of variation in the range of 11–60% were obtained. MFD and NFA were investigated for five varying parameters: applied voltage, relative humidity, temperature, distance between spinning electrode wire and substrate material, and airflow going through the spinning chamber. A first-degree model with interactions has been validated, and the mean fiber diameter obtained at 96.8% has been explained. Three parameters (relative humidity, distance, and voltage) have significant effects on the mean fiber diameter. Main effect of an increase of relative humidity from 40% to 50% or of the distance from 125 to 290 mm results in an increase of the MFD of respectively 68% or 18%. Main effect of an increase of voltage from 50 to 100 kV was a decrease of MFD of 7%. Strong interactions between factors of our model were observed: V*AF > D*T > RH*AF > RH*T > RH*V, which shows the importance of studying the influence of a combination of factors on MFD over individual factor influence. It has been found that relative humidity played a major role on MFD and NFA. Study of the response surface modeling allowed us to reduce our experimental domain to obtain the best compromise between low MFD and minimum NFA. Complementary study for higher values of airflow could be added to our design of experiments to complete the study. Another study has to be dedicated to the improvement of meta-aramid fiber productivity through NS®.
Footnotes
Acknowledgement
The authors would like to thank the KERMEL Company for supplying the materials (polyamide-imide solutions).
Declaration of Conflicting Interests
The author(s) declared no potential conflicts of interest with respect to the research, authorship, and/or publication of this article.
Funding
The author(s) disclosed receipt of the following financial support for the research, authorship, and/or publication of this article: This study was supported by the KERMEL Company.