
Abstract
A microscale model of multifilament reinforcement yarns made of technical carbon fibers is established based on the finite element method. The model is used to perform simulations of tensile failure. The failure behavior of dry multifilament carbon yarns is modeled using a maximum stress criterion with statistical distribution of the strength. The maximum stress is assigned to every single element and varied according to a normal distribution found in experimental tests of single filaments. The Weibull distribution is used for calculating the local failure stress. The material parameters are calculated in function of the element size to account for the volume-specific statistical breaking effect. Representative simulations of the tensile failure behavior prove the concept of the introduced assumptions.
Introduction
As composite materials made from brittle high performance fibers, such as carbon or glass fibers, are commonly used in fields of structural engineering, numerical tools for the calculation of these complex materials are required.
Despite the trend of calculating and simulating composite materials, dry fiber or dry textile simulation applications are increasing. Process simulations in the textile industry are carried out to analyze the influence of process parameter variations on the resulting product behaviour. Examples can be found for braiding process simulation [1] or weaving process simulation [2]. Drape simulations, which are very common in composite development [3], are also carried out at fiber resolution more often [4]. These models are called micro- or meso models due to the explicit picturing of every single yarn (mesoscale) [5,6] or even every single filament (microscale) [7,8]. Because high-performance fibers, such as glass or carbon fibers, are brittle materials, every production step provokes damage to the fiber bundles. Damage is induced locally into the yarns, and mostly only a few fibers are affected. This microdamage does not lead to process failure but reduces the bearing capabilities of the yarns and of the textile or composite products made thereof. The consideration of local fiber failure in the analytical or numerical model improves the material simulation such that it enables an evaluation of process suitability. As the strength of brittle fibers depends on the relative fiber volume, a statistical failure model is aspired for numerical simulations.
Modeling of textile failure
Failure in textile materials was numerically simulated for impact events due to bullets or knifes [9,10]. Simple failure criteria were used, such as the maximum stress [9] or maximum strain criteria [11]. These criteria are useful for most materials not subjected to statistical failure behavior. Analytically, the behavior of fiber bundles has been in the focus of research in recent years. Kun et al. [12] developed fiber bundle models (FBMs) for composite calculations. Those models account for the statistical failure behavior according to Weibull and the interaction of fibers. For numerical modeling, several material models with Weibull-distributed failure criteria were reported in the literature. They are implemented into commercial finite element codes such as ABAQUS [13,14].
The probability R(σ) for the failure of a statistically homogeneous brittle fiber at a certain stress σ is known to be distributed according to the conventional Weibull distribution [15].

Microscale models of yarns
A simplified beam approach for modeling multifilament yarns that accounts for the multitude of parallel fibers was introduced in the study by Wang and Sun [17]. Fibers are modeled as cables. This approach is highly suitable for modeling and simulation of textile materials and processes [7,18,19]. A digital element is equipped with a reduced stiffness matrix and has neglected bending properties. A multitude of these digital elements, coupled by forceless joints, are called element chains [20]. They can be used for modeling limp yarns, filaments, and fibers. Compared to continuum mechanical models, this approach has reduced computational costs, which makes it suitable for modeling a large amount of fibers and fiber bundles. All deformation modes of multifilament yarns, i.e., spreading, compaction, twisting, bending, and elongation, can be excellently reproduced [19], which is advantageous for the current task. The approach is illustrated in Figure 1.
Digital-element model of a multifilament yarn under complex deformation. (a) Digital-element chain [22]; (b) Multifilament under complex deformation (Model with 120 element-chains, diam = 0.13 mm).
Material and experiments
Continuous carbon fiber
Toho Tenax HTS40 F13 12 K 800tex material data as given by the manufacturer.
Tensile properties of single filaments were analyzed according to DIN EN ISO 5079 [21]. The filaments were tested with a gauge length of 20 mm and a test velocity of 20 mm/min in a Textechno Favimat tensile machine (Textechno Herbert Stein & Co. KG, Germany). A pretension of 20 cN/tex was applied. In total, 60 samples were investigated. The result of the investigations are shown in Figure 2.
Distribution of single fiber strength.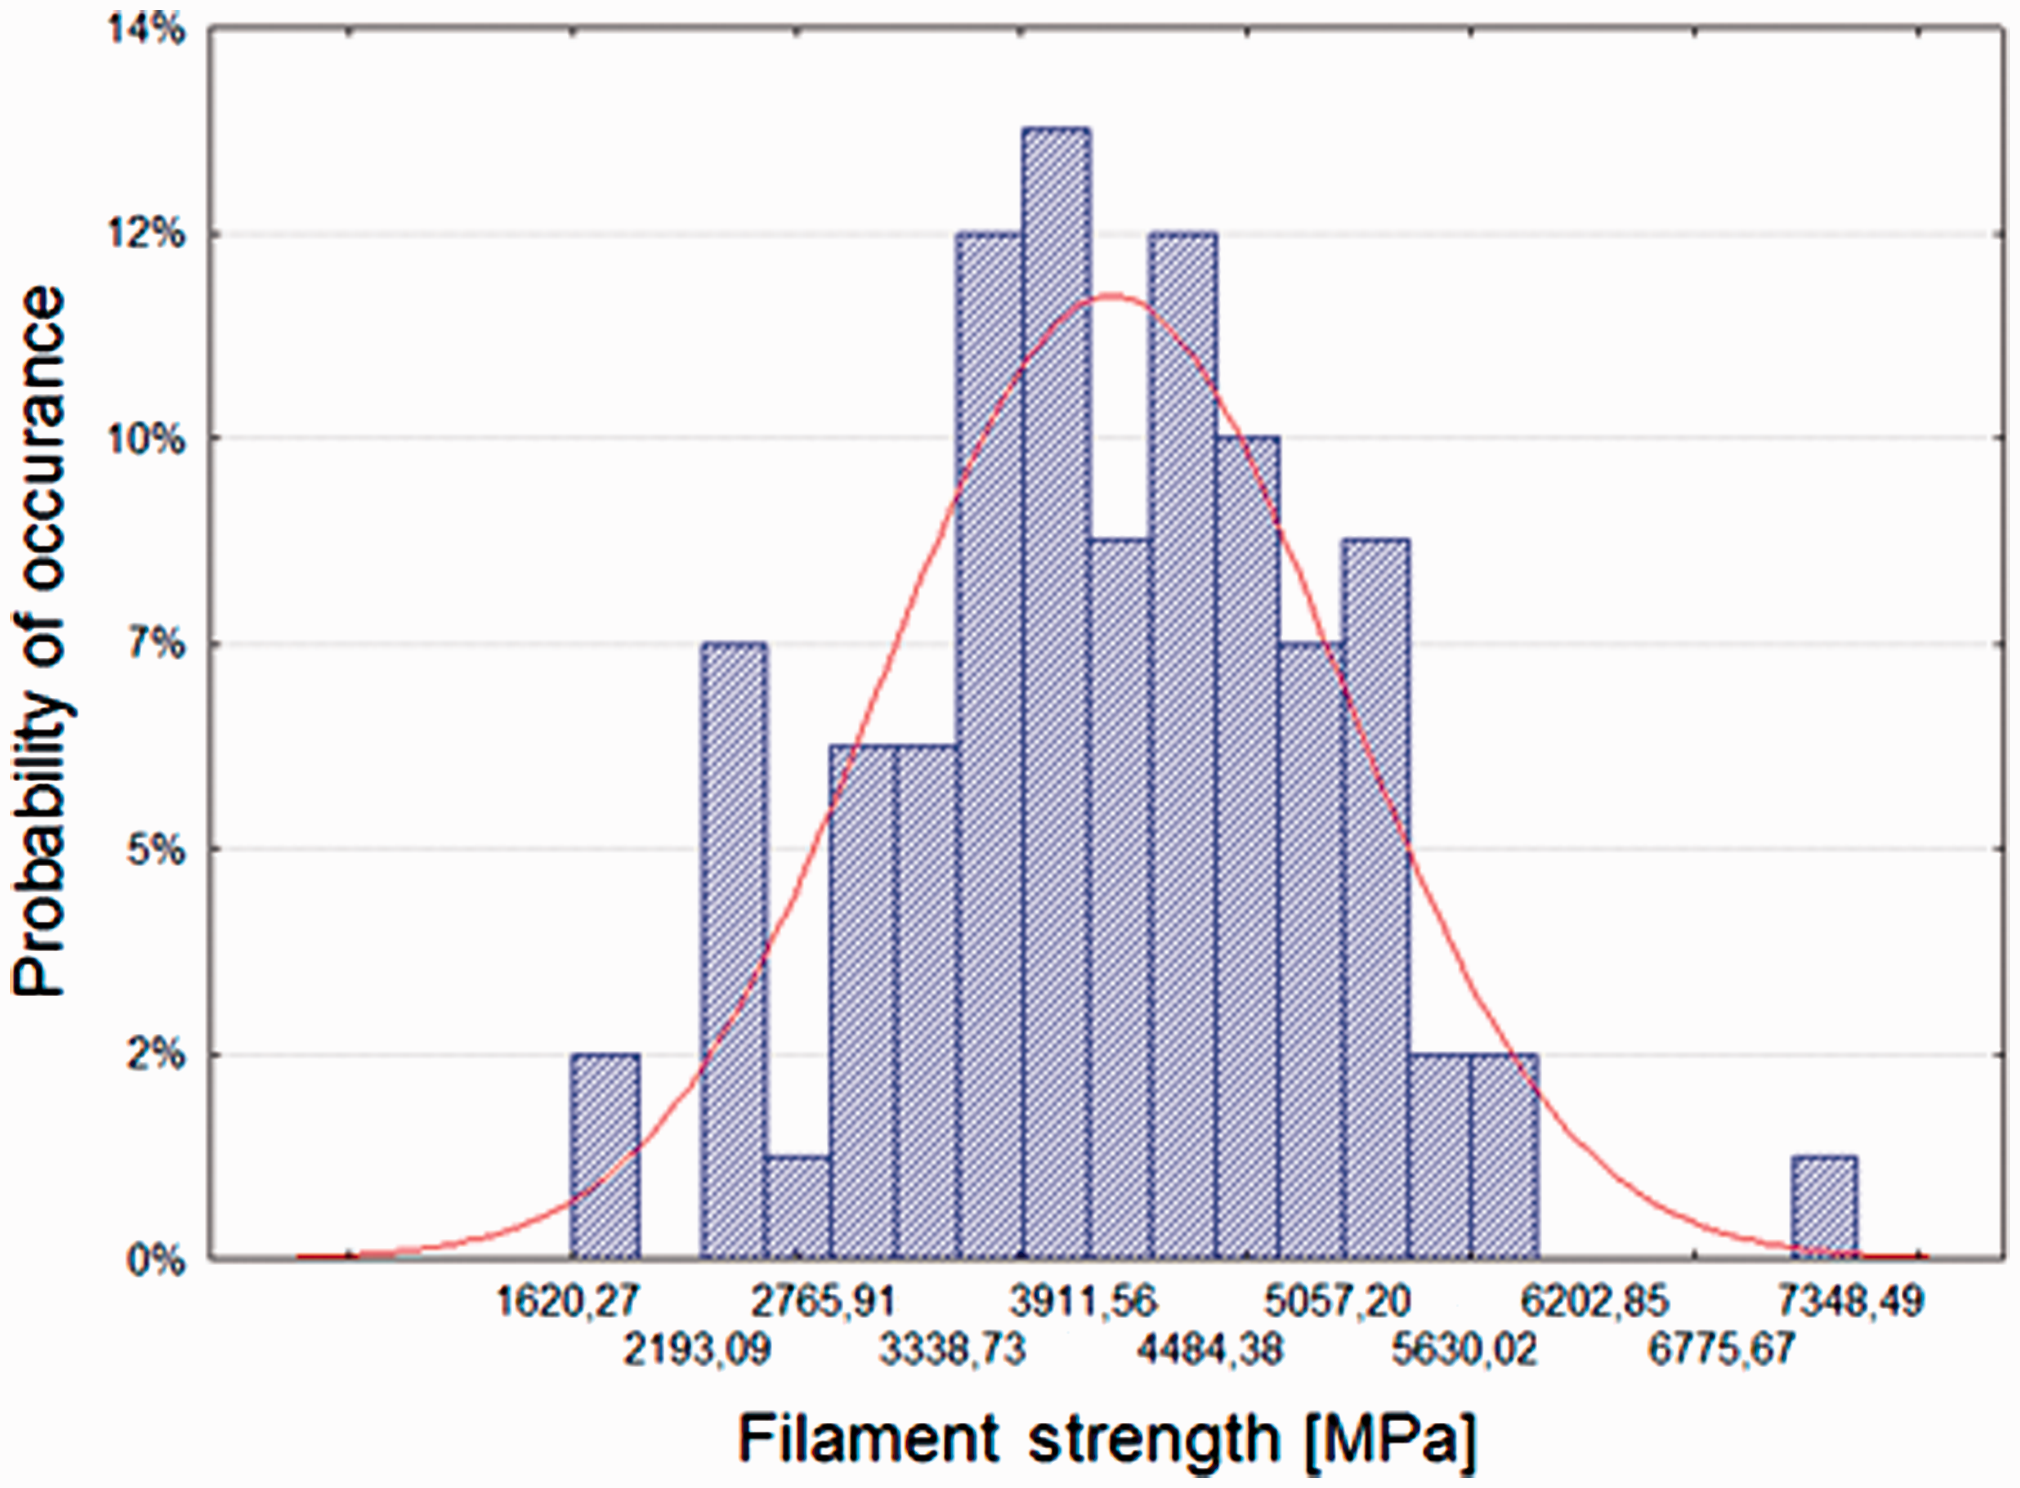
Tensile tests of multifilament yarns were carried out according to DIN EN ISO 2062 [22] in a Zwick Z100 tensile machine (Zwick GmbH & Co. KG, Ulm, Germany). A gauge length of 500 mm and a test velocity of 200 mm/min were used for the experiments. A pretension of 0.5 cN/tex was applied to the yarns. In total, 60 samples were tested.
Experimental results
Testing filament strength
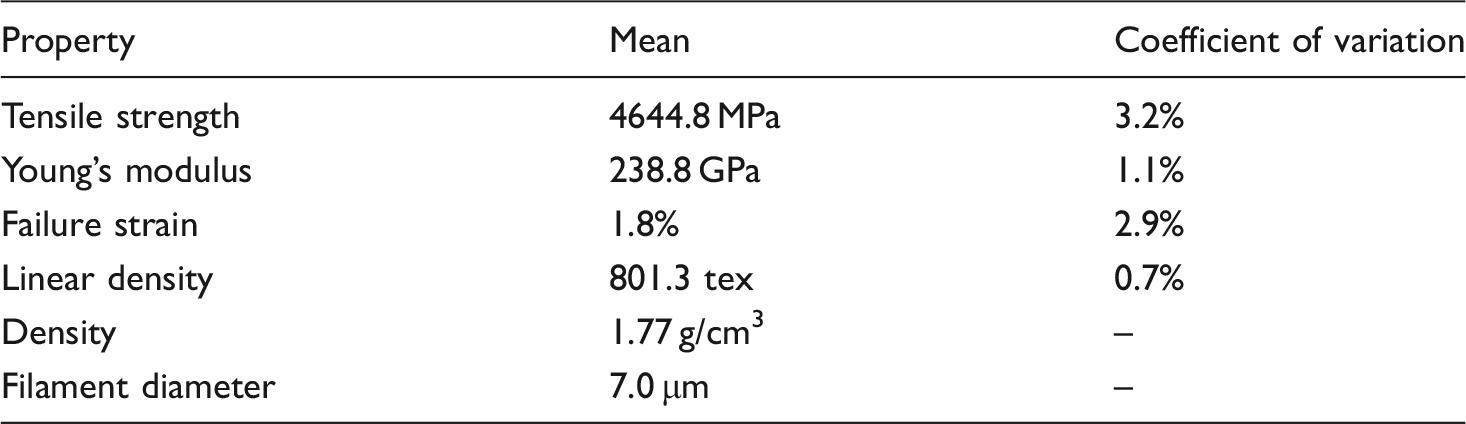
Results of single-fiber tensile failure strength, failure strain, and density.

The Weibull diagram is plotted as a double logarithmic diagram in Figure 3, with F as the probability of occurrence. The grade of the fitting is called Weibull modulus m (equation (1)).
Weibull diagram of filament strength distribution.
Testing multifilament yarn strength
Results of yarn tensile test and density measurement.


Distribution of yarns breaking load.
It can be observed that the achieved breaking load per filament decreased compared to the 200 mm single-filament test. The coefficient of variation also decreased from 0.22 (20 mm gauge length) to 0.18 (500 mm gauge length). The deviation of results remains normal. A main point to observe is the decreasing failure strain. While a single filament with a gauge length of 20 mm sustained a strain of 2.22%, a yarn with a gauge length of 500 mm failed at 0.77% strain. This is a matter of reduced failure load and therefore a matter of the Weibull-distributed failure behavior. With given and equal Young’s modulus, the strain decreases with decreasing load.
Yarn modeling
Yarn discretization on the microscale
The digital-element approach was used for modeling the mechanical behavior of multifilament yarns. The commercial finite element Software LS-DYNA® was used for the investigations. Contact between the filaments is not considered and load transfer between single filaments is not existent. As the mechanical properties are examined in axial filament direction only, isotropic material properties are applied with the parameters of axial direction.
For simulation, LS-DYNA standard Hughes-Liu beams have been used for stability reasons. To achieve the tow-like behavior digital elements are known for, a user-material subroutine has been implemented which accounts for the reduced stiffness matrix mentioned in the study by Wang and Sun [17]. The negligence of the bending stiffness is realized by underintegrating the beam elements by using only one integration point.
The same failure criterion was assigned to every digital element. The maximum stress criterion leads to rupture of the filament when σ = σmax is applied. To account for the failure behavior of brittle fibers, the parameter for the failure criterion, σmax, was varied statistically according to the normal distribution found for the results pictured in Figure 2. This distribution was taken from the experimental results of tensile tests of the 20-mm long filaments.
Some assumptions were made for modeling the multifilament yarn Toho Tenax®-E HTS40 F13 12 K 800tex:
Every filament has the same circular cross section. The filaments are perfectly straight and do not interact with each other, i.e., load is not transferred between individual filaments.
The length of the modeled beam chains was 500 mm, which was in accordance with the gauge length of the experimental tests. The diameter of the circular filament cross section was 6.935 µm. A total of 11,900 beam-chains were modeled to account for the yarns real cross section. The beam-chains have been placed parallel with a certain distance to avoid contact between them. Boundary conditions prevent every displacement of the nodes at one end of the yarn model and only allow the displacement of the nodes at the other end in axial direction to apply a tensile load case to the beam-chains. With these boundaries, no contacts between any filaments will occur during the virtual tensile test. The length of the single-beam elements was constant and was varied between 5 and 20 mm (5 mm, 10 mm, and 20 mm). To give an impression of the multifilament micromodel, a section of the model is shown in Figure 5.
Section of multifilament micromodel with 11,900 filaments.
The filament strength is known to depend on the gauge length of the test setup. As this value is an input parameter for the maximum stress failure criteria (σmax), the element size of the model discretization is tied to the gauge length of the test, which was 20 mm. To find a general value for the locally varying element strength as function of the element length, the Weibull distribution was used. A Weibull modulus was identified from the filament tests. Conclusions on the material strength as a function of the loaded part size were made with

Polar method
The polar method was used to transform random numbers of a uniform distribution into random numbers of a normal distribution. Multifilament yarn strength is normally distributed as is shown in Figure 2. Computational generators for random numbers deliver uniformly distributed random numbers between 0 and 1. Therefore, these numbers have to be transferred into the given normal distribution with given values for the mean and the standard deviation.
A required random number x, which is distributed normally according to the mean value w and the standard deviation s, is given by

It is calculated from two random and uniformly distributed numbers i and j (0 < i, j < 1) according to the following equations:


Simulation results
Simulation of filament strength
In order to check the functionality of the polar method to generate the required normal distributed values, 100 runs of virtual single-filament tensile tests have been carried out. The filaments were discretized by one single element with the size of 20 mm. A linear isotropic material model with a maximum stress (σmax) failure criterion was used. The results for the mean and the standard deviation of filament strength found in experimental tests (see Table 2) were used as input values for the polar method (equation (3)). The obtained value x was used as the value of σmax in the material model. The results for the achieved failure strengths are shown in Figure 6.
Normally distributed failing of beam elements.
It can be observed that the polar method is suitable to deliver normally distributed values with a given mean and standard deviation. The deviation appears naturally and accurately equalized. The mean of the 100 investigated values is 4171.8 MPa with a standard deviation of 938.7 MPa. The obtained values can be used as input parameters for the maximum stress failure model.
Distributing the element failure parameters according to Weibull
Parameters for the failure criteria in function of the element size.

The trend of a decreasing mean strength and a related decreasing of the standard deviation with an increasing element size correlates with the findings obtained from the experimental tests (compare Table 2 and Table 3) and with the theory of Weibull for brittle materials failure behavior.
Simulation of multifilament yarn strength
The introduced multifilament yarn model was virtually tested for its failure behavior. It was loaded in tension linearly up to the point where all element chains failed. Due to the statistical effects, i.e., normally distributed local strength, the level of load to achieve failure was different for every beam-chain. As a matter of course, a beam-chain fails if the weakest element fails. In Figure 7(a), the virtual testing result of four runs with a multifilament yarn modeled with 20 mm beam elements is shown. The tensile force is plotted against the tensile strain. In Figure 7(b), details of the results of different simulation run with the same model as shown. The influence of the statistical failure can be observed since the results obtained from the same model vary.
Result of virtual multifilament yarn tensile test (element size = 20 mm). (a) Comparison of simulation result and experimental result for tensile test. (b) Variation of the simulation result due to statistical effects.
Comparison of multifilament tensile test results obtained from experiment and simulation.

A reason may be found in the neglected friction between the single fibers. Additionally, multifilament yarns are known to be able to transfer load between single fibers by friction. Without this effect, a smaller failure load may be obtained, which also leads to a smaller failure strain.
Simulations with independent element size
As numerical simulations may be carried out with variable element sizes, the parameters for the failure criteria have to be adaptable according to the Weibull-distributed failure strength. To proof the concept of element size–dependent failure strength, multifilament yarn models were set up with different element length according to Figure 5. Virtual tensile tests were performed with all models. The comparison of the results is shown in Figure 8.
Comparison of simulation results obtained by different beam element lengths.
The accurate results of the multifilament yarn tensile simulation from Figure 7 could be reproduced with smaller element sizes. The adapted failure stresses and standard variations calculated according to the Weibull distribution result in the aspired failure behavior.
Conclusions
The statistical effect of carbon fiber breakage can be modeled by considering the local distortions in the brittle material as a variation of the material models local failure stress in the simulation. The polar method was found to be successful for generating a material-specific distribution of the maximum element strength which is applied on the single elements. A multifilament yarn was modeled on the microscale by considering every single filament, and it was tested virtually for its tensile failure behavior. For the breaking load and the breaking strain, the mean values of the experimental multifilament tensile tests could not be obtained. Virtual results are underestimating the breaking strength of the multifilament yarn by about 7% if all the runs regardless of the element size are considered. A possible explanation can be found in the missing frictional energy and the neglecting of a possible load transfer in multifilament fiber bundles due to the avoidance of fiber–to-fiber contact. With decreasing breaking load, the breaking strain decreases. Also the statistical variation of the breaking load is small in the simulation. While the experimental test showed a deviation of tensile breaking force of about 100 N, the result of the simulation showed a statistical deviation under 1% which equates a deviation of about 5 N. Nevertheless, the multifilament yarn model shows accurate failure behavior regarding the trend of tensile load versus tensile strain. A change in the model’s element size can be considered by calculating the element strength in function of the element size. The Weibull distribution of failure probability is suitable in this manner. For parameterization, one single-material test was enough to set up the statistical material model.
Footnotes
Declaration of Conflicting Interests
The author(s) declared no potential conflicts of interest with respect to the research, authorship, and/or publication of this article.
Funding
The author(s) disclosed receipt of the following financial support for the research, authorship, and/or publication of this article: The authors would like to thank the German Research Foundation (Deutsche Forschungsgemeinschaft, DFG) for financial support for the project DFG CH 174/34-1.