
Abstract
In this study, the compression molding process parameters for the development of silk fiber-reinforced polypropylene composites was optimized using Box–Behnken experimental Design with response surface methodology. The trimmed silk fibers from shuttleless loom silk selvedge waste were used as reinforcement in polypropylene fiber matrix. The process parameters of compression molding such as temperature (165–185℃), time (7–15 min) and pressure (35–45 bar) were optimized with respect to the mechanical properties of the silk fiber-reinforced polypropylene composite. The optimum parameters for better mechanical properties were found to be temperature, 180℃; time, 7 min, and pressure, 35 bar in compression molding. The optimised level of parameters has shown good response to the predicted model.
Keywords
Introduction
The natural fiber-reinforced composites has been found in many applications due to their environmental benefits such as reduced dependence on non-renewable energy sources, lower pollutant emissions, lower green house gas emissions, enhanced energy recovery, and end of life bio degradability [1]. Further, the natural fibers used in the composites as reinforcements have easy processing ability, low density, light weight, non-abrasivity, lower cost and are less hazardous [2]. The composite properties are strongly influenced by the factors such as processing conditions, proportions and properties of matrix and reinforcement material, the nature of adhesion between these, and the shape, size, orientation, and distribution of the reinforcements. These properties can be customized for various types of applications by properly selecting suitable fibers, matrices, additives, and production methods.
Response surface methodology (RSM) is an empirical modeling technique useful for developing, improving, and optimizing the process that is devoted to the evaluation of the relationship of a set of controlled experimental factors and observed results [3]. The optimization process involves three major steps: performing the statistically designed experiments, estimating the coefficients in a mathematical model, and predicting the response/checking the adequacy of the model. The factors are optimized by changing one factor at a time and keeping other variables constant in the conventional approach. RSM is capable of simultaneously determining the individual and interactive effects of many factors [4].
Optimization using RSM has been widely applied in the development of natural cellulosic fiber-reinforced composites. In the fabrication of wool fiber-reinforced polypropylene composites, the optimum mechanical properties were obtained at 176℃, 7 min and 35 bar in a compression molding machine [5]. An optimum value for impact strength was reported at 50% durian skin fiber content and fiber size range of 250–500 µm with 0 wt% maleic anhydride polypropylene content in the fabrication of durian skin fiber-reinforced polypropylene composite using Box–Behnken experimental design with RSM [6]. The tensile strength of the palmyra fiber-reinforced composite was greatly influenced by the alkali treatment time, fiber length, and fiber volume fraction [7]. The fiber content greatly influenced the tensile and flexural properties of the composites in the flax fiber polyethylene biocomposites compared to injection molding temperature and pressure. The tensile strength and flexural strength of the composites increased with increase in fiber content. The composites processed below 190℃ have given better mechanical properties [8].
Silk is a natural protein fiber. The fibrous proteins are spun into yarn by a variety of insects and spiders [9]. The Bombyx mori cocoon silk filament consists of two structural fibroin filaments coated with glue-like sericin proteins. Fibroin consists high proportions of amino acids such as alanine, glycine, and serine. Silk proteins are natural polymers which are biodegradable with reactive functional groups [10]. Silk fiber has high strength, extensibility, and compressibility [11–14]. These properties make the silk fiber-reinforced composites replace the synthetic fiber-reinforced composites. During the conversion of silk cocoon to silk fabric, huge amount of trimmed silk selvedge is generated as waste in shuttleless loom silk weaving mills. This is utilized only as raw material for making of coarser yarns.
Only very few studies are available on the utilization of the silk waste in the development of composites [15–17]. There are no works to highlight the fabrication of composite boards from reclaimed silk fibers from silk selvedge waste using RSM with desirability functions. Therefore, the objective of the study was to find out the application of multi-response optimization process for the production of silk fiber-reinforced polypropylene composite and also to study the effect of process parameters on the mechanical properties of the composites. Further FTIR analysis was also made on the silk fiber-reinforced polypropylene composites.
Experimental
Materials
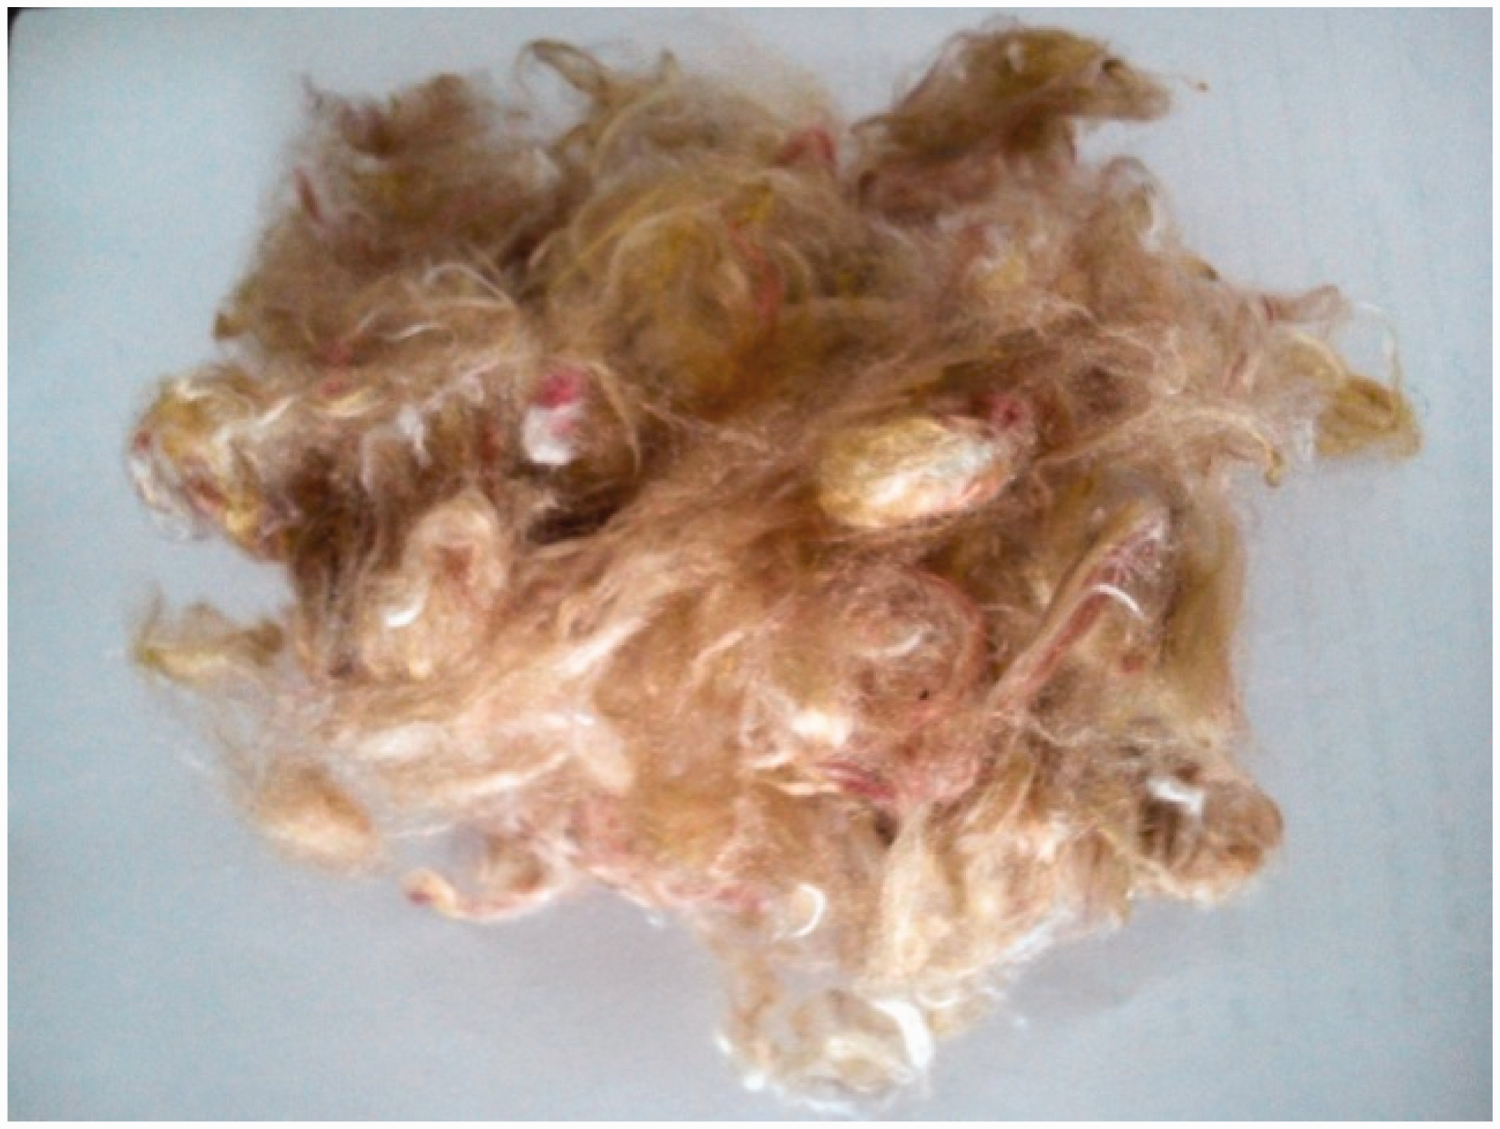
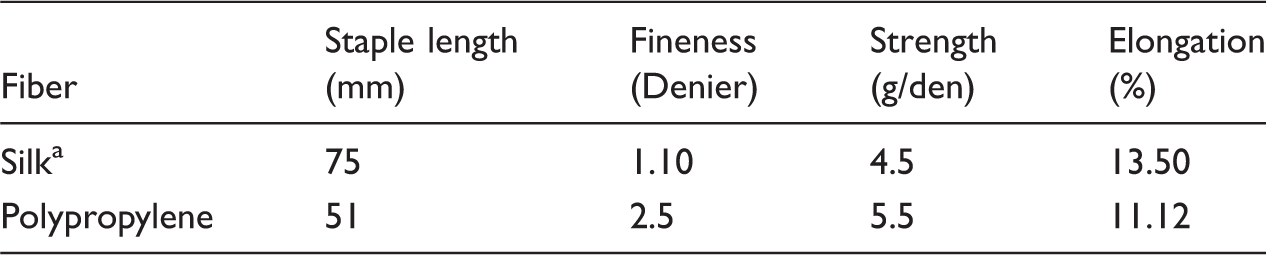
The retrieved silk fibers from shuttleless loom silk selvedge waste were used as reinforcement in polypropylene matrix. The shuttleless loom silk selvedge waste was collected from Ethnic Fashions, Bengaluru, India. This silk selvedge hard waste was cleaned by removing non-silk materials present, i.e. cotton leno threads. Figure 1 depicts the photographic image of silk selvedge waste strips obtained from shuttleless looms. These silk hard wastes were opened into fibrous form using a lab model hard waste opening machine at optimum conditions at the licker-in speed of 553 r/min, at the cylinder speed of 354 r/min, and at the feed roller to licker-in setting of 11 thou. This opened silk selvedge waste was used as reinforcement in composite fabrication which is shown in Figure 2. Polypropylene staple fiber was used as a bonding agent for the composite fabrication which was procured from Zenith fibers, Vadodara. The physical properties of these fibers are given in Table 1.
Silk selvedge waste. Silk fibers retrieved from silk selvedge waste. Physical properties of fibers. Silk fiber retrieved from silk selvedge waste.
Design of experiment for composite fabrication
Experimental ranges and levels in the Box–Behnken experimental design.

Box–Behnken experimental design matrix and experimental responses.

Composite fabrication
The fiber blends were prepared using silk and polypropylene fibers in a lab model blending machine at 50:50 blend ratio (by wt.%) to maintain the ideal weight of reinforcing fibers and polypropylene fiber (matrix) in the composite [18]. The fiber blends were fed into a lab model carding machine to obtain fiber web. During carding, the fiber blend was further opened and individual fibers were combed to be relatively parallel. The fiber blend was carded four times to enhance web uniformity. Six webs were superimposed to get the required thickness and weight in the resultant composite material. The superimposed webs were used as performs in compression molding machine. Seventeen composite samples were prepared as per the Box–Behnken experimental design.
Composite testing
Mechanical properties of the composites
The tensile strength tests of the silk fiber-reinforced polypropylene composite was carried out according to ASTM D 638 in an Universal Testing Machine (Instron tensile tester model 3345) at a cross-head speed of 50 mm/min.Flexural strength tests were performed using three-point bending method according to ASTM D790-03. The specimens were tested at the cross head speed of 50 mm/min. The flexural strength (FS) was determined using the following equation

Fourier transform infrared spectrometry
Fourier transform infrared spectrometry (FTIR) was performed to detect the molecular vibration and to analyze the distribution of functional groups in the composites. The FTIR equipment SHIMADZU was used in the transmission mode with a resolution of 4 cm−1 in the range of 4000–800 cm−1 to obtain the structural analysis of the composites.
Scanning electron microscopy
SEM images of the tensile fractured surfaces of the composite were taken to study the fracture behavior of the composite using JEOL M JSM 6360 under 3000 × and 6000× magnifications.
Statistical analysis
The statistical analysis was performed using Design Expert Statistical Software package (8.1 trial version) (State Ease Inc., Minneapolis, USA). The experimental data were analyzed using multiple regressions and significance of regression coefficients were evaluated by F-test and the significance of the F-values were verified at probability levels (p ≤ 0.05). Modeling was started with a quadratic model including linear, squared, and interaction terms. The model adequacies were checked in terms of R2, adjusted R2, and prediction errors sum of squares. The significant terms in the model were found by Pareto analysis of variance (ANOVA). For each response, ANOVA table was generated. The regression coefficients were used to make statistical calculations to generate response surface plots from the regression models.
Response optimization
The responses were optimized by numerical optimization technique using Derringer’s desirability function method. This function searches for a combination of factor levels that jointly optimize a set of responses by satisfying the requirements for each response in the design. The optimization was accomplished by three steps, i.e. converting each response Y i (i = 1, 2, …, m) into a dimensionless desirability scale that defines a partial desirability function (di), combining the individual desirabilities to obtain global desirability function (D), and finally identifying the optimal factor settings. The desirability function’s scale ranges between 0 (completely undesirable response) and 1 (fully desired response).
The individual desirabilities (d) for each response were obtained by specifying the goals, i.e. minimize, maximize, or target the response, and boundaries required for each one. A weight factor was assigned which explains the shape of the desirability function for each response. Weights must be between 0.1 and 10, with larger weights corresponding to more important responses. A weight factor of 1 was chosen for all individual desirabilities in this work.
Validation of optimized conditions and predictive models
The suitability of the developed model equations for predicting the optimum response values was verified using the optimal conditions. Triplicate experiments were carried out in the optimal condition and the mean experimental values were compared with the predicted values in order to determine the validity of the models.
Results and discussion
ANOVA results and regression model
ANOVA table and statistical parameters of quadratic model (response: tensile strength).

ANOVA table and statistical parameters of quadratic model (response: flexural strength).

ANOVA table and statistical parameters of quadratic model (response: impact strength).

Determination coefficient R2, adjusted R2, predicted R2, and coefficient of variation (CV%) were determined to check the adequacy and accuracy of the developed models. The R2 indicates the proportion of the total variation in the response predicted by the models. The higher correlation coefficients confirm the suitability of the models and correctness of the calculated constants. The R2 values obtained were 0.9985, 0.9935, and 0.9895 for the responses tensile strength, flexural strength, and impact strength, respectively which ensures a satisfactory fit of the model to the experimental data. The adjusted R2 values obtained were 0.9965, 0.9851, and 0.9760. The predicted R2 values obtained were 0.9805, 0.9151, and 0.9747. It was found that the relationships between tensile, flexural, and impact strengths with the process variables are accounted for the variability of the data satisfactorily. The values of adjusted R2 and predicted R2 indicated high correlation between observed and predicted values.
Model equations for the mechanical properties of silk fiber-reinforced polypropylene composite.
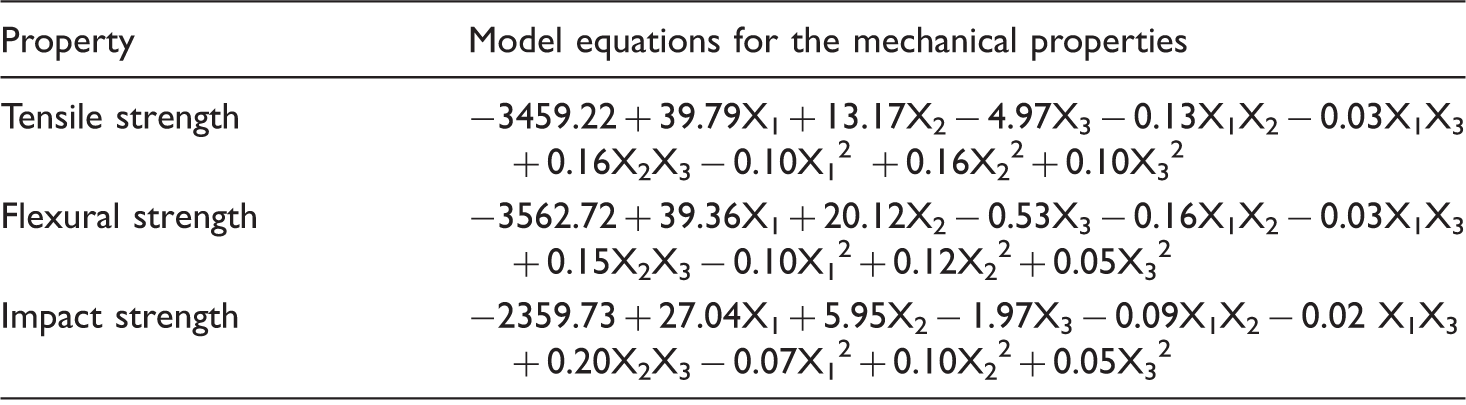
X1 = temperature, X2 = time, X3 = pressure.
Adequacy of the model
The conformation of the fitted model was carried out to know its sufficient approximation to the actual values. The optimization of the fitted response surface probably provides poor or misleading results until the model shows the satisfactory fit [23]. The model satisfactoriness was confirmed with the diagnostic plots such as predicted vs. experimental values. The plots also exhibited the relationship between predicted and experimental values. The diagnostic plots of the responses tensile strength, flexural strength, and impact strength are exhibited in Figure 3. The data points on this plot recline reasonably close to the straight line and this indicated an adequate agreement between the real data and the data obtained from the models. The results suggested that the models used in this work were able to identify operating conditions for the development of silk fiber-reinforced polypropylene composites.
Comparison between predicted and experimental values of silk fiber-reinforced polypropylene composite: (a) tensile strength, (b) flexural strength, and (c) impact strength.
The normality of the residuals was checked by analyzing the data. The normal probability plot shown in Figure 4 depicts the normal distribution of the residuals. The residuals provide the difference between the observed value of a response and the value that is fitted under the theoretical model. The small residual value indicates that the model prediction is accurate [23]. The data points lie reasonably close to straight line in Figure 4. Some scatter was also found with normal data and it could be concluded that the data are normally distributed.
Normal probability plots of studentized residuals for silk fiber-reinforced polypropylene composite: (a) tensile strength, (b) flexural strength, and (c) impact strength. Contour plots of tensile strength showing the interaction effect between the variables (a) time and temperature, (b) pressure and temperature, and (c) pressure and time for silk fiber-reinforced polypropylene composite.

Interaction between the operational variables
The two-dimensional contour plots were generated to study the interaction effects between the variables. The plots were generated by keeping one variable constant at the center point and varying the others within the experimental range. The contour plots representing the interaction effect between the variables (a) time and temperature, (b) pressure and temperature, and (c) pressure and time on the response tensile strength are given in Figure 5(a) to (c), respectively. Figure 5(a) and (b) shows nearly linear relationship of variable temperature with the variables time and pressure in the form of straight line up to the medium level of temperature. At higher temperature, this becomes curvilinear or nonlinear. The variables time and pressure in Figure 5(c) show nonlinear relationship at all levels of the two variables. It was also observed that the tensile strength shows an upward trend initially with increase in temperature and then reduces later on. The decrease in the tensile strength of the composite is due to the thermal degradation of the silk fibers. Similar results have been reported for the tensile strength of jute fiber/polylactide composite [24]. It was also noted that as the molding time increases, the tensile strength also increases. The trend observed resulted in an increase in tensile strength from about 11.98 MPa to the maximum value of 36.97 MPa at 179℃, 7 min, and 35 bar pressure.
Figure 6(a) to (c) shows the contour plots representing the interaction effects of (a) time and temperature, (b) pressure and temperature, (c) pressure and time on flexural strength of the silk fiber-reinforced polypropylene composites, respectively. Figure 6(a) and (b) shows nearly linear relationship of variable temperature with the variables time and pressure in the form of straight line up to the medium level of temperature. At higher temperature, this becomes curvilinear or nonlinear. An increment in flexural strength was observed with increase in temperature initially and later on decrement in flexural strength was observed. Variables time and pressure in Figure 6(c) have a non-linear relationship at all levels of the two variables. The flexural strength increases with increase in molding time. The better wetting between matrix and fiber leads to better impregnation of the fiber in matrix at higher molding time [25]. A decrease in flexural strength was noted with increase in molding pressure. This is due to the good component consolidation of the parts at low molding pressure [26]. The maximum flexural strength of about 37.12 MPa was obtained at 179℃, 7 min and 35 bar pressure.
Contour plots of flexural strength showing the interaction effect between the variables (a) time and temperature, (b) pressure and temperature, and (c) pressure and time for silk fiber-reinforced polypropylene composite.
The contour plots for the interaction effects of (a) time and temperature, (b) pressure and temperature, and (c) pressure and time on impact strength of the silk fiber-reinforced polypropylene composite are depicted in Figure 7 (a) to (c), respectively. The interaction effect of the variable temperature with the variables time and pressure gives linear relationship up to the medium level of temperature as that of tensile strength and flexural strength. At higher temperature, this becomes curvilinear or nonlinear which is shown in Figure 7(a) and (b). An increment in impact strength was observed with increase in temperature initially and later on decrement in impact strength was observed. In Figure 7(c), the variables time and pressure have a nonlinear relationship at all levels of the two variables. The impact strength decreases with increase in molding time. A decrease in impact strength was observed with increase in molding pressure. The interface between the fiber and resin may be good at the increased molding time due to the better melting of the resin and the application of high pressure will make the composite more stiff which reduces the impact strength. Optimum impact strength of about 30.47 kJ/m2 was obtained at 179℃, 7 min and 35 bar pressure.
Contour plots of impact strength showing the interaction effect between the variables (a) time and temperature, (b) pressure and temperature, and (c) pressure and time for silk fiber-reinforced polypropylene composite.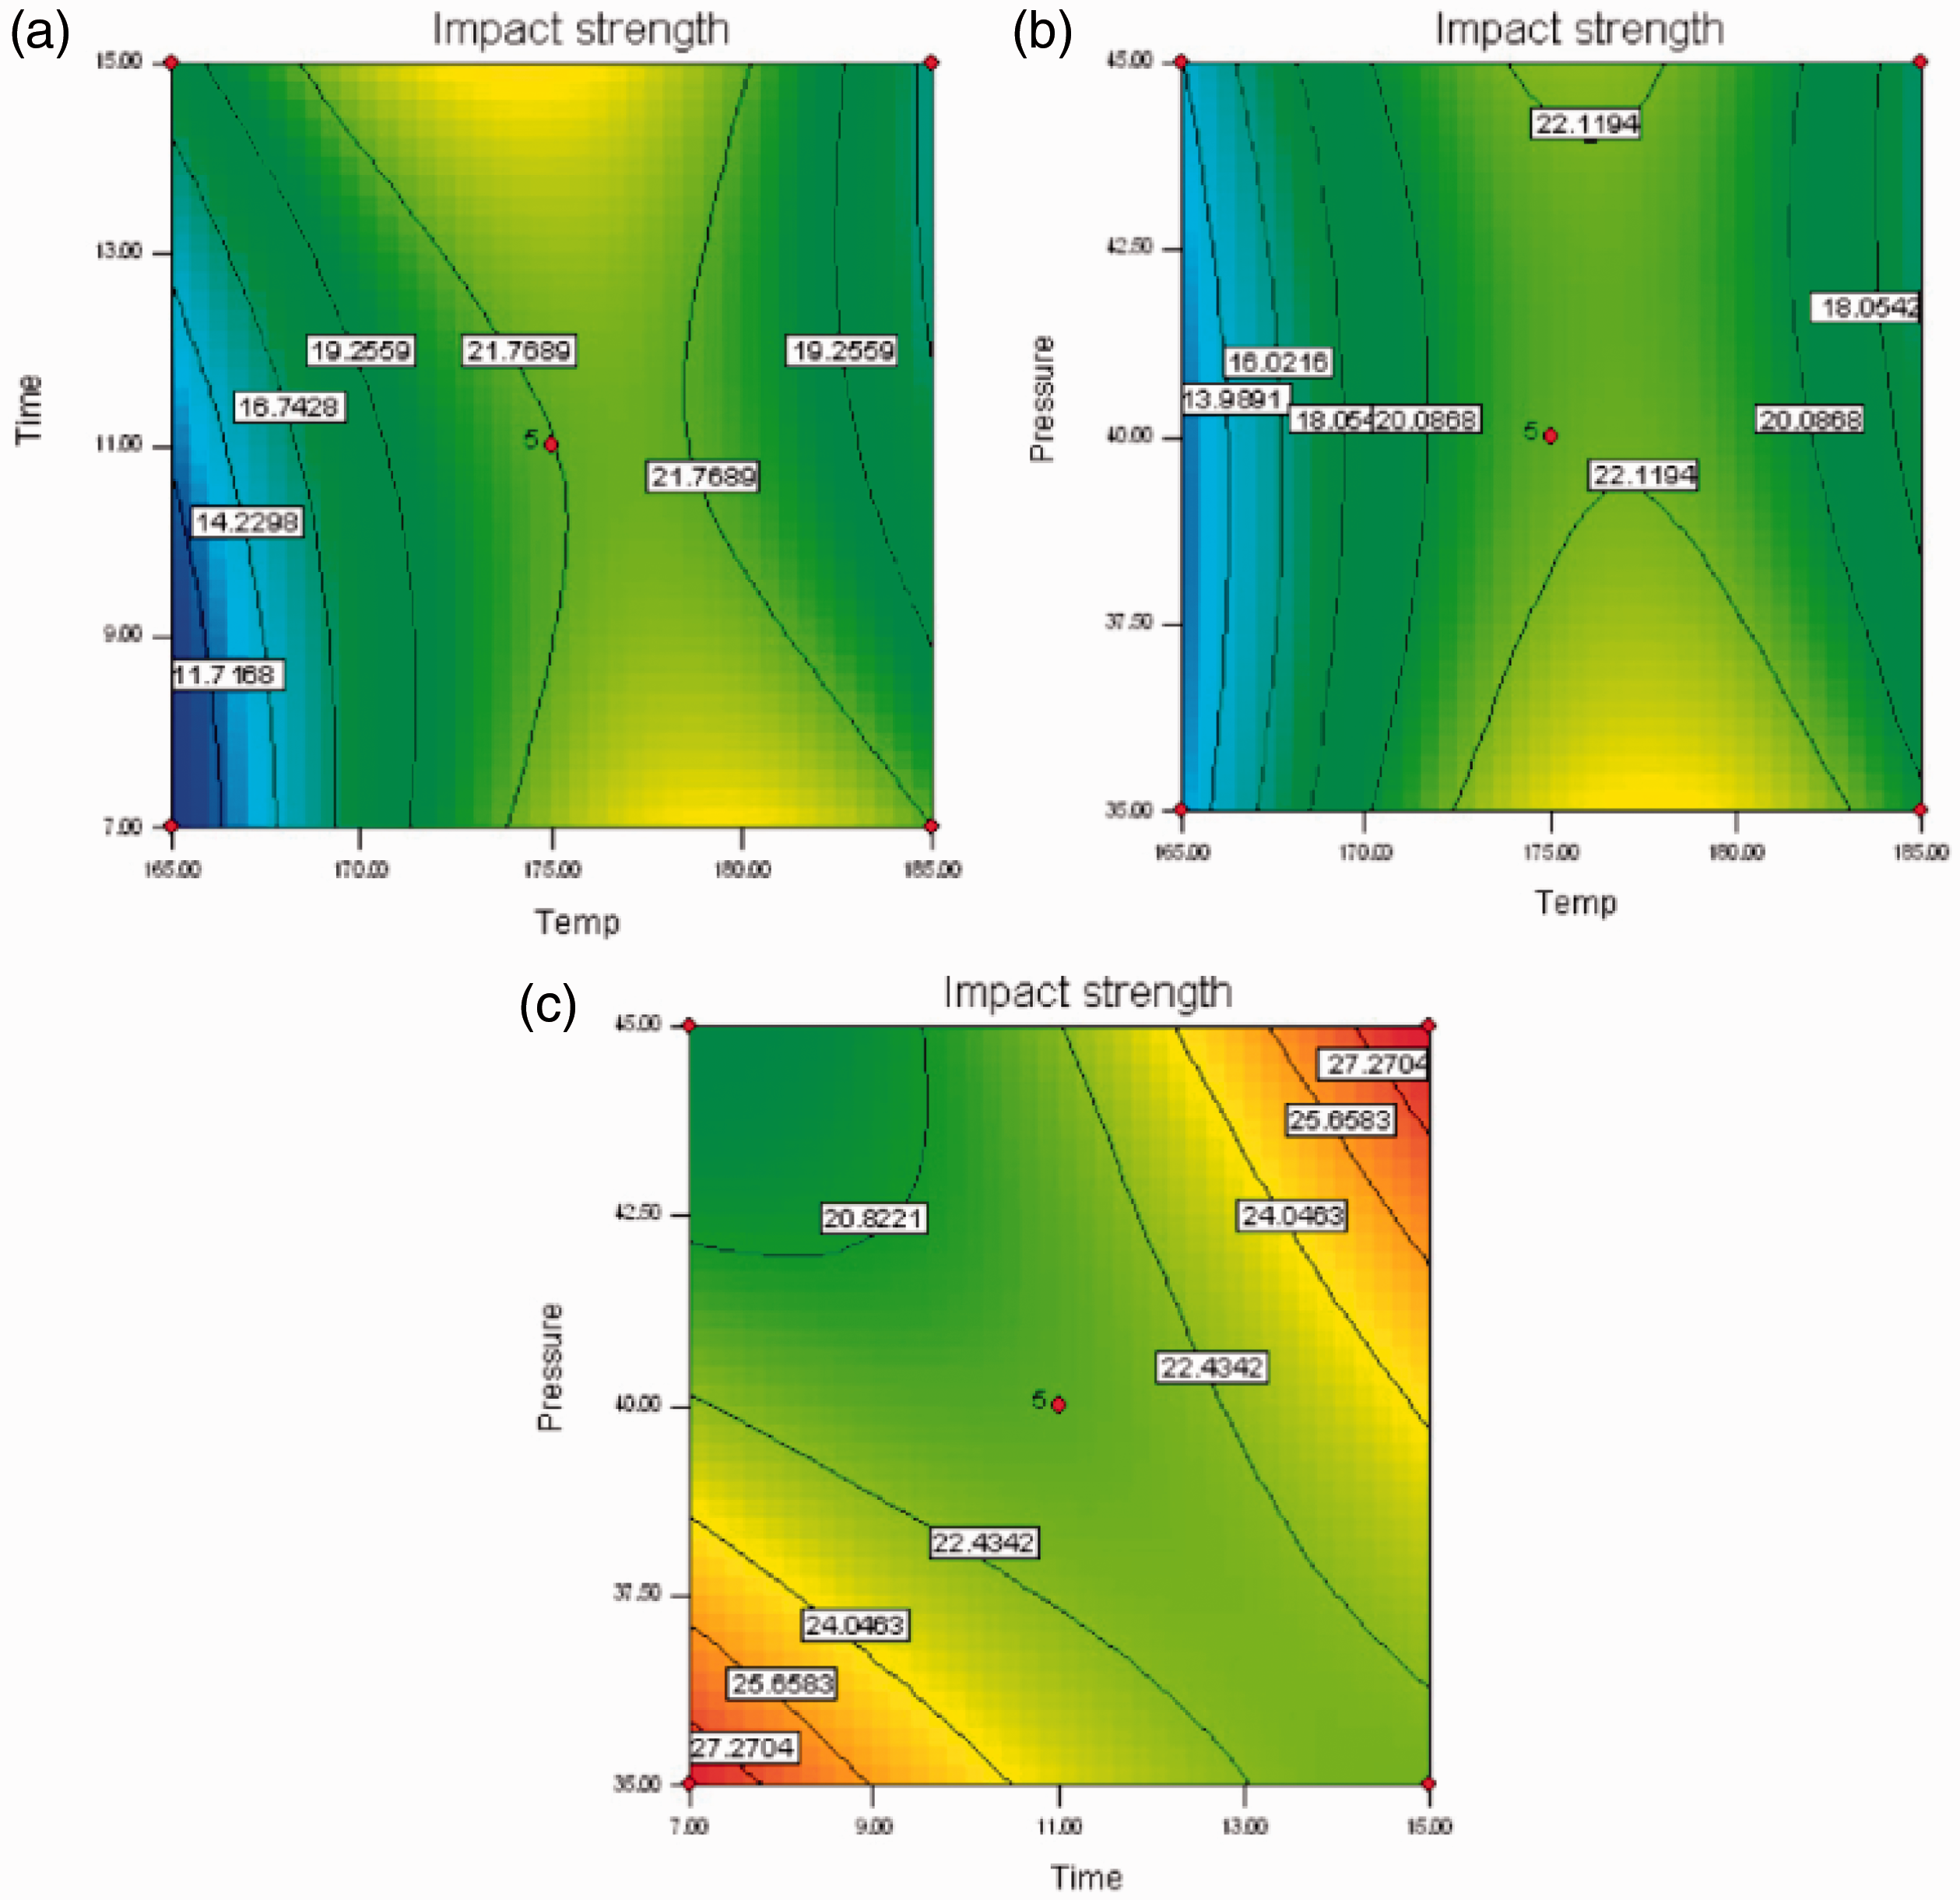
Selection of optimum conditions
An optimum condition for mechanical properties of silk fiber-reinforced polypropylene composite was determined to obtain maximum tensile strength, flexural strength, and impact strength. Second-order polynomial models developed in this study were utilized for each response in order to obtain specified optimum conditions. Derringer’s desirability function method was used for optimization of multiple responses. The optimum tensile strength, flexural strength, and impact strength of 36.98 MPa, 37.13 MPa, and 30.47 kJ/m2 was obtained at the temperature of 180℃, at the time of 7 min and at the pressure of 35 bar. Figure 8 depicts the optimized conditions obtained for mechanical properties of silk fiber-reinforced polypropylene composites in compression molding machine.
Optimized conditions for mechanical properties of silk fiber-reinforced polypropylene composites in compression molding machine.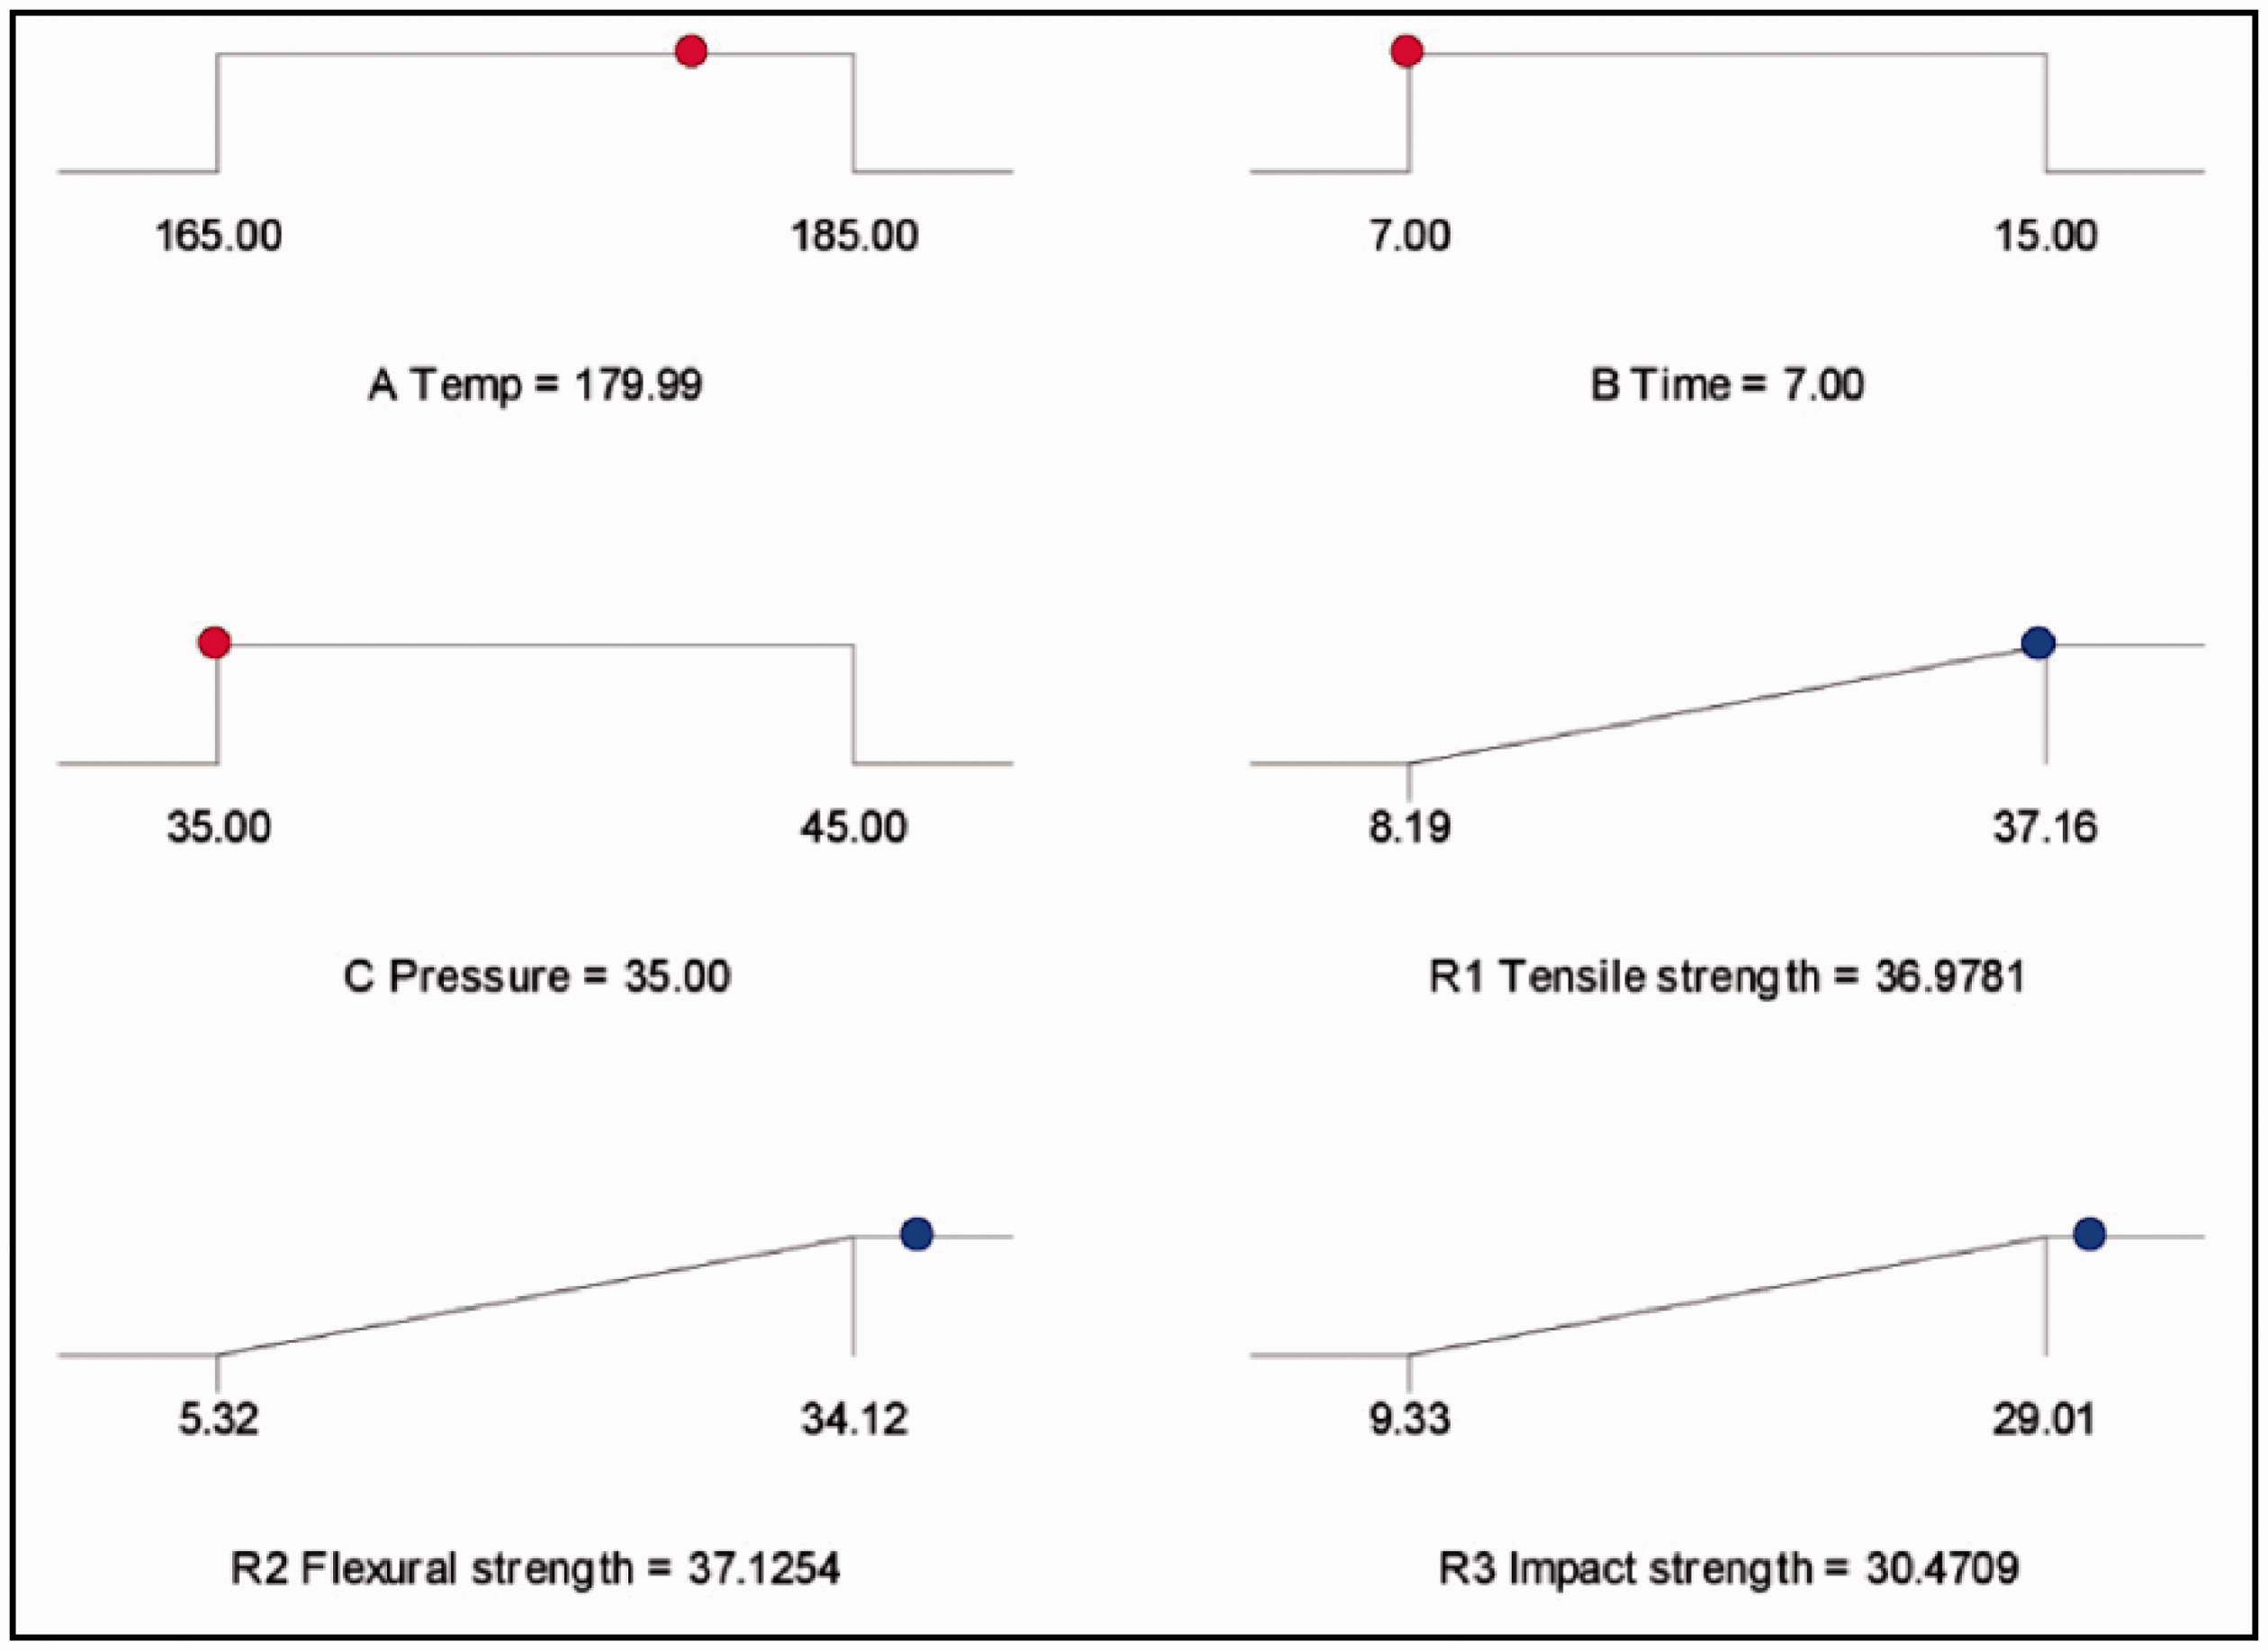
Verification of optimum conditions
In order to validate the model, triplicate experiments were conducted at optimized conditions and mean values of the experimental results were compared with the predicted values. The mean values obtained from the experimental work were 36.16 ± 0.71 MPa, 38.12 ± 0.22 MPa, and 29.03 ± 0.7 kJ/m2 for tensile strength, flexural strength, and impact strength, respectively, showing the level of closeness of 98%, 97%, and 95% with the data obtained from the optimization analysis. This indicated the suitability of the developed quadratic model for effectively optimizing the mechanical properties of the silk fiber-reinforced polypropylene composites. Figure 9 depicts the image of the composite sample fabricated at optimized conditions.
Silk fiber-reinforced polypropylene composite fabricated at optimized conditions.
FTIR analysis
The FTIR spectra of silk fiber-, polypropylene fiber-, and silk fiber-reinforced polypropylene composite are depicted in Figure 10. The FTIR spectra of silk fiber in Figure 10(a) have shown amide I absorption band at 1627 cm−1 (C=O stretch) and amide II absorption band at 1519 cm−1 (N–H bend), and amide III band absorption at 1234 cm−1 (C–N stretch) indicating the presence of β-sheet structure in silk fiber [27]. The polypropylene fiber in Figure 10(b) has shown its characteristic peaks at 1458 cm−1 assigned to the asymmetric stretching vibration of –C–H in CH3 and 1381 cm−1 assigned to the symmetric bending of CH3 [28]. In the spectra of composite, the bands of polypropylene were partly overlapped by the bands of silk fiber. The peaks related to polypropylene were 1451 cm−1 (asymmetric stretching vibration of (–C–H in CH3) and 1381 cm−1 (symmetric bending of CH3). By this, it was confirmed that there is an interaction between the silk and polypropylene matrix in the composites. It was also found that the peak for amide II (N–H bend) moved to higher wave number (1589 cm−1) in silk/polypropylene composite when compared to silk fiber which is shown in Figure 10(c) which indicates the bonding between fiber and matrix.
FTIR spectra of (a) silk fiber, (b) polypropylene fiber, and (c) composite.
Structural properties
The scanning electron microscope images of silk-reinforced polypropylene composite fabricated at 180℃, at the time of 7 min and at the pressure of 35 bar are shown in Figures 11 and 12 at different magnifications 3000× and 6000×, respectively. The composite sample has shown void contents in Figure 11 at 3000× magnification. Better interfacial bonding between fiber and matrix was clearly observed in Figure 12 at 6000× magnification.
SEM image of fracture surface of silk reinforced polypropylene composite at 3000×. SEM image of fracture surface of silk reinforced polypropylene composite at 6000×.

Conclusions
The optimization of process parameters of compression molding for the development of silk fiber-reinforced polypropylene composites was demonstrated using Box–Behnken experimental design with RSM. Based on the second-order polynomial equation, three important factors, temperature, time, and pressure, were found to have significant influence on silk fiber-reinforced polypropylene composites. The optimized parameters for maximum tensile strength, flexural strength, and impact strength were determined as follows: temperature, 180℃; time, 7 min; and 35 bar. These values were further validated by a conformation experiment to see the efficacy of the model and found to be good with optimized data. Therefore, the methodology has been proved that the model is adequate for the development of silk fiber-reinforced polypropylene composite. The silk fiber-reinforced polypropylene composites developed from this work can be used as electrical insulating materials.
Footnotes
Acknowledgement
The authors would like to thank the management of Kumaraguru College of Technology, Coimbatore, India for the technical support provided throughout this research work.
Declaration of Conflicting Interests
The author(s) declared no potential conflicts of interest with respect to the research, authorship, and/or publication of this article.
Funding
The author(s) disclosed receipt of the following financial support for the research, authorship, and/or publication of this article: The financial support for this research is given by All India Council for Technical Education (AICTE), India (File no. 8023/BOR/RID/RPS-177).