
Abstract
The aim of this study was to produce advanced nanofiber mats by adding boron nitride to poly (ɛ-caprolactone) polymer using an electrospinning method and to characterize the resultant structures. Pure poly (ɛ-caprolactone) nanofiber mats and boron nitride-doped nanofiber mats prepared at different concentrations were compared. The morphological structures of the nanofiber mats were examined under a scanning electron microscope, spectroscopic analyses were conducted using Fourier transform infrared spectroscopy, and thermal stability was analyzed using a thermogravimetric analysis method. Successful electrospinning of boron nitride-doped nanofibers at lower voltages was achieved. The thermogravimetric analysis test found that the thermal stability of boron nitride-doped nanofiber mats is higher than that of pure nanofibers, which suggests that the produced composite material could be preferable in applications involving insulation and high temperature. On the other hand, the Fourier transform infrared spectroscopy results indicated that no chemical reaction occurred between boron nitride and the poly (ɛ-caprolactone) nanofibers.
Introduction
Boron nitride (BN) is a synthetic material, composed of boron (B) and nitrogen (N) atoms, that can be synthesized in hexagonal and cubic forms [1]. It is also possible to encounter its wurtzite (w-BN) structures as a third poliform. The most stable crystal structure form of BN is hexagonal boron nitride (h-BN), also called α-BN or g-BN (graphite BN) [2]. The h-BN is formed in a nitrogen medium through the reaction of B2O3 or B(OH)3 with NH3 or urea (CO(NH2)2). The h-BN is a semi-conductive material with high chemical stability, high oxidization resistance, high electrical resistance, and high thermal conductivity [3,4]. BN nanomaterials and BN nanotubes are used in different applications, such as functional polymer-based composite production, gas absorption, nano-insulator production, electron field emission studies, and nanoelectronics [5]. Among these applications, composites containing boron and BN have many industrial uses, including but not limited to tissue engineering [6], glass and ceramics [7], wastewater purification [8], agriculture [9], nuclear science [10,11], machinery and metallurgy [12–14], construction and cement work [15], incombustibility [16], and more.
The technique of electrospinning—the production of nanofibers under an electrostatic field—has seen heavy use over the last decade, due to its low cost, flexible production, ease of use, and diverse material choice [17–19]. The electrospinning system consists of a syringe pump, a high-voltage power supply, and a collector plate; the polymer solution comes out of the positive-charged tip being spun as a nanofiber within an electrostatic field [20–23]. With the electrospinning method, it is possible to produce polymer fibers with diameters ranging from several microns to 100 nm or smaller [20]. There are limited number of studies available in the literature about boron or its derivatives containing nanofiber structures, but these structures have recently seen a gradual increase in focus because of their outstanding properties.
One such study claimed that adding boron to conductive composite nanofibers produced composite structures with superior conductivity. The same study detected that the diameters of fibers were more uniform and smoother in boron-doped fibers [24]. In another study by Lei et al. [25], porous h-BN with a wide surface area was examined in terms of its ability to absorb oil, chemical solutions, and dye-based contaminants. h-BN was found to have higher absorption capabilities relative to other light elements. In addition, it was determined that porous nanosheets had 2 times the oil absorption capacity of non-porous nanosheets. Barakat et al. [26] investigated the possibility of producing uniform nanofibers through electrospinning by mixing solid BN nanoparticles with PVA polymer solutions. The authors found that the electrospinning process affected the chemical structures of neither the solid particles nor the polymers.
Another study concluded that BN nanofibers (BNNFs) had higher thermal properties, longer fiber size, and smoother parallelism when compared with BN nanoparticles. Specifically, TG analyses found the oxidation resistance of BNNFs to be 890℃, indicating extraordinarily high thermal stability as compared with that of BN nanotubes and BN nanoparticles [5]. Salles et al. [27] produced electrospun BN nanofibers with diameters ranging from 400 nm to less than 100 nm from polyacrylonitrile (PAN) and polymethylamino borazine [B3N5C3.3H13,2] mixture solutions and applied thermal degradation to transform the polymers into ceramic. The authors stated that, in addition to thermal and thermomechanical applications, most of the fibers could be used as filler material for heat management applications as well. Similarly, nanobiocomposites of BN and cellulose displayed higher thermal and chemical stability than did raw cellulose [4]. Qiu et al. [28] succeeded in producing tunable-diameter electrospun BNNFs with varying B2O3 concentration in polyacrylonitrile. BNNFs produced in this study had a hexagonal structure similar to that of carbon nanotubes and carbon nanofibers. Hwang et al. [1] reported that BN/PVA nanofiber membranes (4.52 eV) produced from BN ceramic nanofibers showed higher electron bandwidth than BN nanoparticles (2.75 eV).
The aim of this article was to study the effect of BN nanoparticles on the chemical and thermal stability of BNNFs. The electrospinnability of BNNF and the effects of concentration and mixing methods on the production of BNNFs were also evaluated. In this work, h-BN nanofiber composites (hBNNC) were produced by adding semi-conductive h-BNs to poly (ɛ-caprolactone) (PCL). These hBNNCs were characterized using morphological, thermal, and chemical methods. The learnings about the production and characteristics of these fibers show that BN-doped nanofibers have many possible applications and should be further studied for their potential as thermal insulators [5], fuel cells [28,29], and electronic devices [30,31].
Materials and methods
Materials
The PCL polymer with an average molecular weight of 80,000 Da, dimethylformamide (DMF) solvent and chloroform solvent were supplied from Sigma Aldrich. h-BN nanoparticles (∼40 nm) were procured from Graphene Supermarket (USA).
Solution preparation
The PCL polymer was prepared in different concentrations through dissolution in mixtures of solvents consisting of 30% DMF and 70% chloroform. The PCL polymer was mixed in using a magnetic stirrer at room temperature until a homogeneous distribution was achieved. Then, BN nanoparticles were added, and the PCL polymer was mixed again.
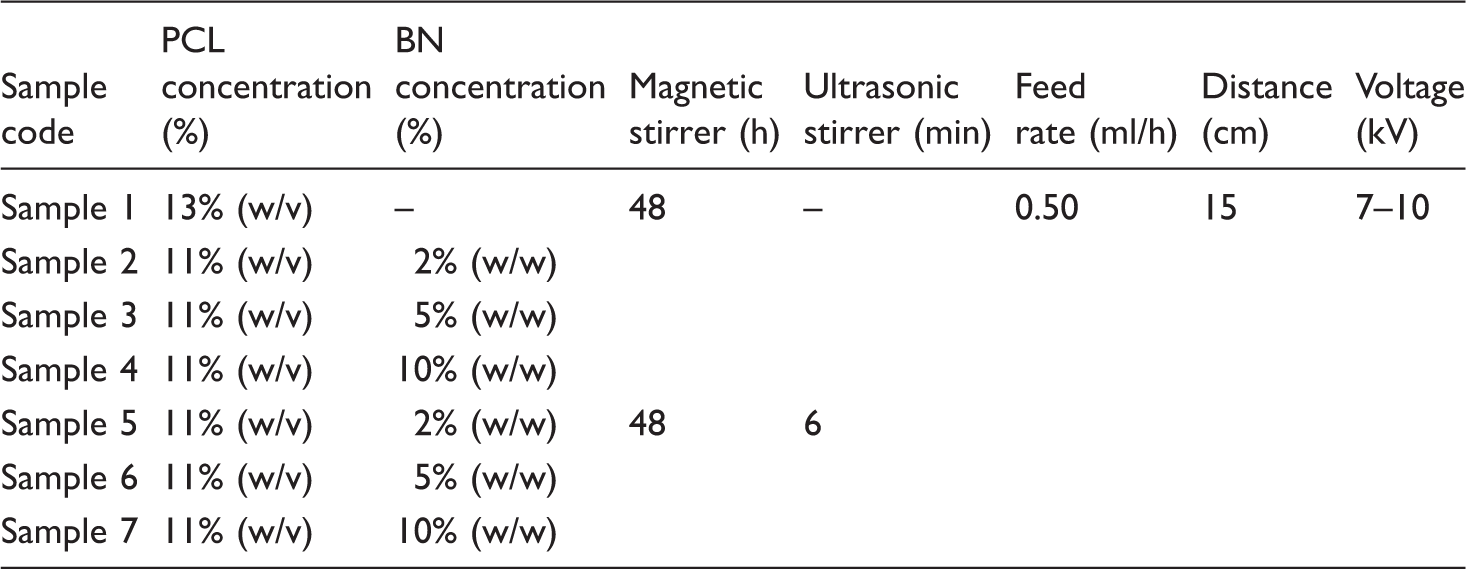
Process parameters of prepared polymer solutions.
Electrospinning
All PCL polymer solutions were subjected to the electrospinning process at a 0.50 ml/h feed rate. Five-milliliter plastic syringes with 22-G diameter capillary needles were used. The applied voltage was around 7–10 kV, and the distance between the needle tip and the collector was fixed at 15 cm. For safety and security reasons, electrospinning of the polymer solutions was carried out in a homemade sterile plexiglass cabin. All samples were electrospun for 6 h or more.
Results and discussion
The morphological characteristics of the nanofiber mats were examined under a scanning electron microscope (SEM). Captured SEM images were analyzed using ImageJ software. A representative SEM image of the pure 13% (w/v) PCL polymer-based nanofibers is given in Figure 1. As seen in the figure, the produced structures were smooth and uniform.
SEM image of 13% (w/v) PCL polymer-based nanofibers.
The SEM images of the nanofibers produced from 2% (w/w) BN-doped 11% (w/v) PCL solution (Figure 2) showed that only the samples mixed with the magnetic stirrer (Sample 2) had more beaded structures than did the samples mixed with both the magnetic and ultrasonic stirrers (Sample 5). Additionally, the fibers produced using the ultrasonic stirrer had more uniform fiber morphology. These results indicate that the BN particles had better dispersion throughout the polymer solution when the ultrasonic stirrer was used.
SEM images of the 11% PCL (w/v)/2% BN (w/w) nanofibers: (a) Sample 2, at 5000 × magnification; (b) Sample 2, at 50,000 × magnification; (c) Sample 5, at 5000 × magnification; and (d) Sample 5, at 50,000 × magnification.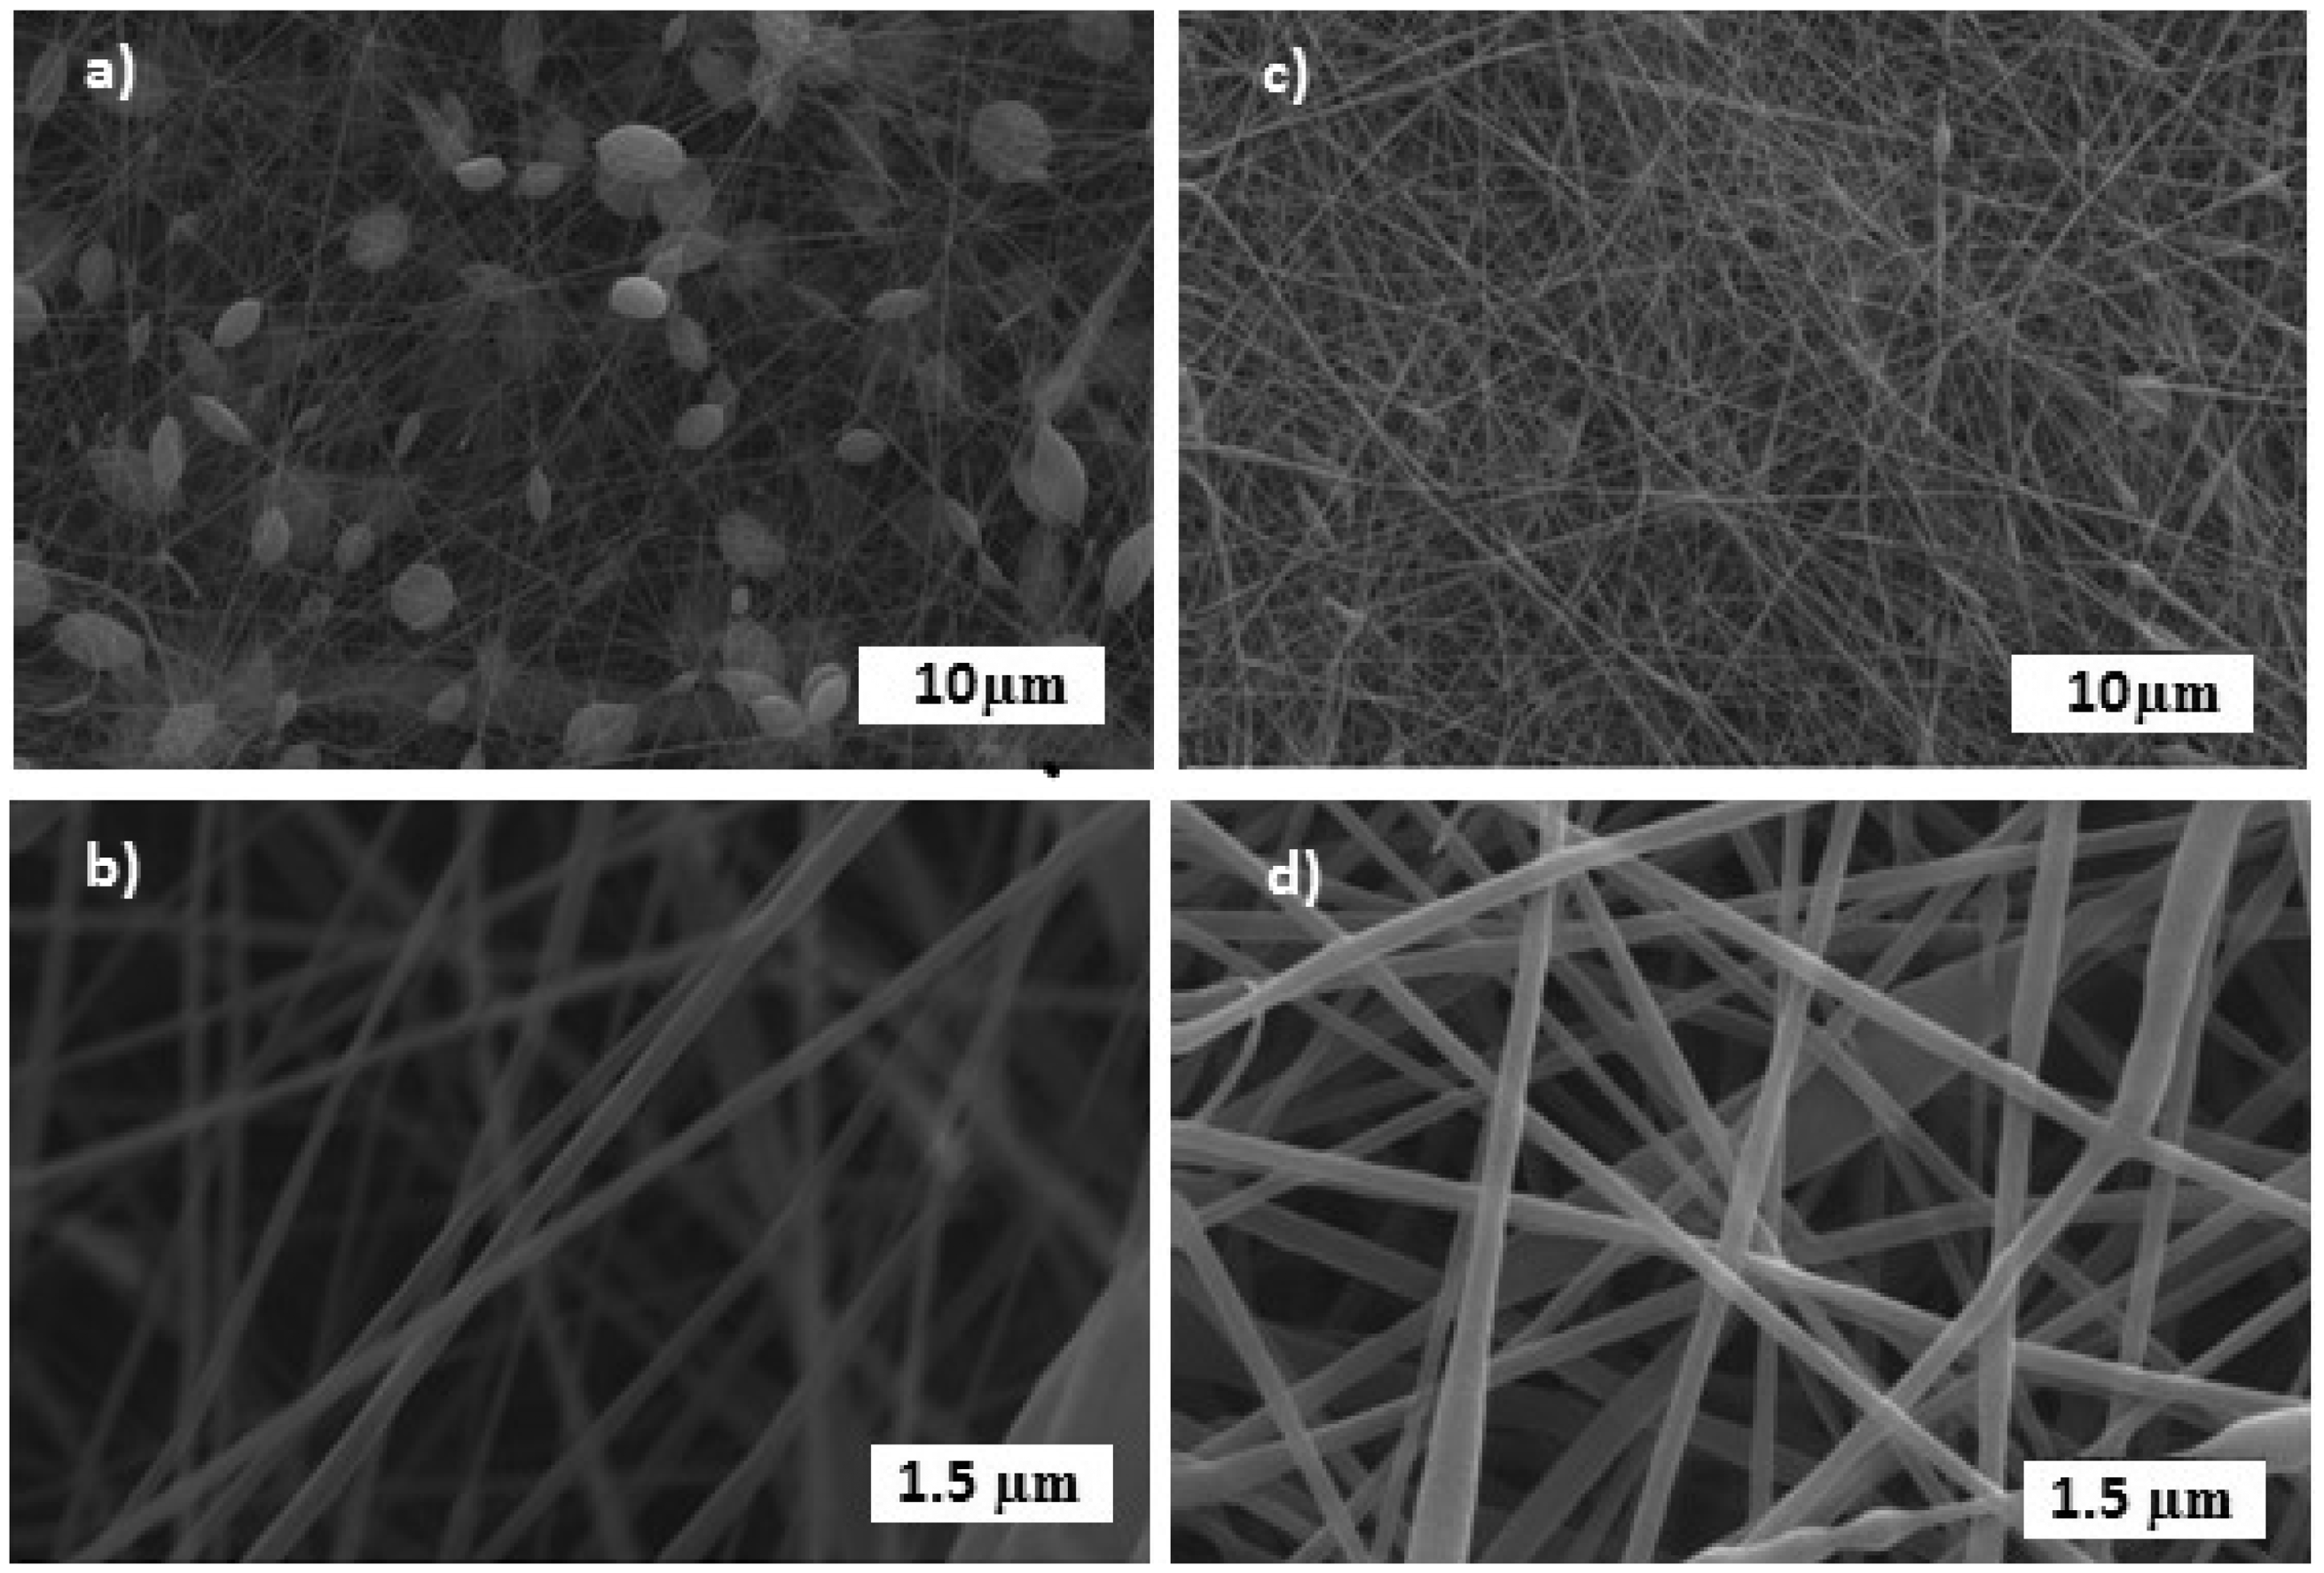
Figure 3 shows the samples prepared by adding 5% (w/w) and 10% (w/w) BN, respectively, to 11% (w/v) PCL polymer solutions. The 5% (w/w) and 10% (w/w) BN-doped PCL polymer nanofibers were morphologically similar to the 2% (w/w) BN-doped PCL polymer-based nanofibers, but a great number of beads were detected. In addition, the number of beaded structures increased with the increasing concentration of BN in the solution.
SEM images of the 11% PCL (w/v)/5% BN (w/w) nanofibers: (a) Sample 3, at 5000 × magnification; (b) Sample 3, at 50,000 × magnification; (c) Sample 6, at 5000 × magnification; and (d) Sample 6, at 50,000 × magnification.
Sample 4 contained one of the highest BN concentrations among BNNFs produced using only the magnetic stirrer. Inefficient mixing by the magnetic stirrer resulted in BN agglomeration, and therefore a phase separation of the BN and the polymer solution was observed. This phase separation led to the formation of small-diameter fibers from the BN-free polymer solution part of BNNFs. On the other hand, the parts of the polymer solution containing BN formed beaded structures. Sample 7, which was prepared using both magnetic and ultrasonic mixing methods, produced more uniform BNNFs than did Sample 4 (Figure 4).
SEM images of the 11% PCL (w/v)/10% BN (w/w) nanofibers: (a) Sample 4, at 5000 × magnification; (b) Sample 4, at 50,000 × magnification; (c) Sample 7, at 5000 × magnification; and (d) Sample 7, at 50,000 × magnification.
Comparison of all samples revealed that the number of beads increased as BN concentration increased. Among BNNFs with the same BN concentration, the solutions processed using the ultrasonic stirrer had fewer beads in general. Sample 5, which was prepared from 2% (w/w) BN-doped solution and mixed with the ultrasonic stirrer, had the smoothest morphological structure. In addition, nanofibers were produced at lower voltages from BN-doped solutions. This is likely due to the semi-conductive nature of the BN. It is worthy of note that, while the bead formation is not desired in nanofiber production, it does not have adverse effects in this particular study.
Figure 5 shows average fiber diameter and standard deviation. While the distribution of fiber diameter was found to be between 130 nm and 900 nm for pure PCL polymer nanofibers, it varied between 20 nm and 400 nm for BN-doped nanofibers (samples 2 to 7). The diagram shows a larger distribution in diameter for the pure PCL polymer nanofibers and a mean diameter ranging between 260 nm and 500 nm. In addition, the nanofibers produced from BN-doped solutions had a narrower range in fiber diameter and a much smaller mean fiber diameter. Among BN-doped nanofiber samples, samples 2, 3, and 4 (which were mixed with the mechanical stirrer and doped with 2%, 5%, and 10% (w/w) BN, respectively) showed a decrease in mean fiber diameter in proportion to the increase in amount of BN.
Diagram showing the mean fiber diameters of the samples (The small black dots denote data points outside the error bar interval.).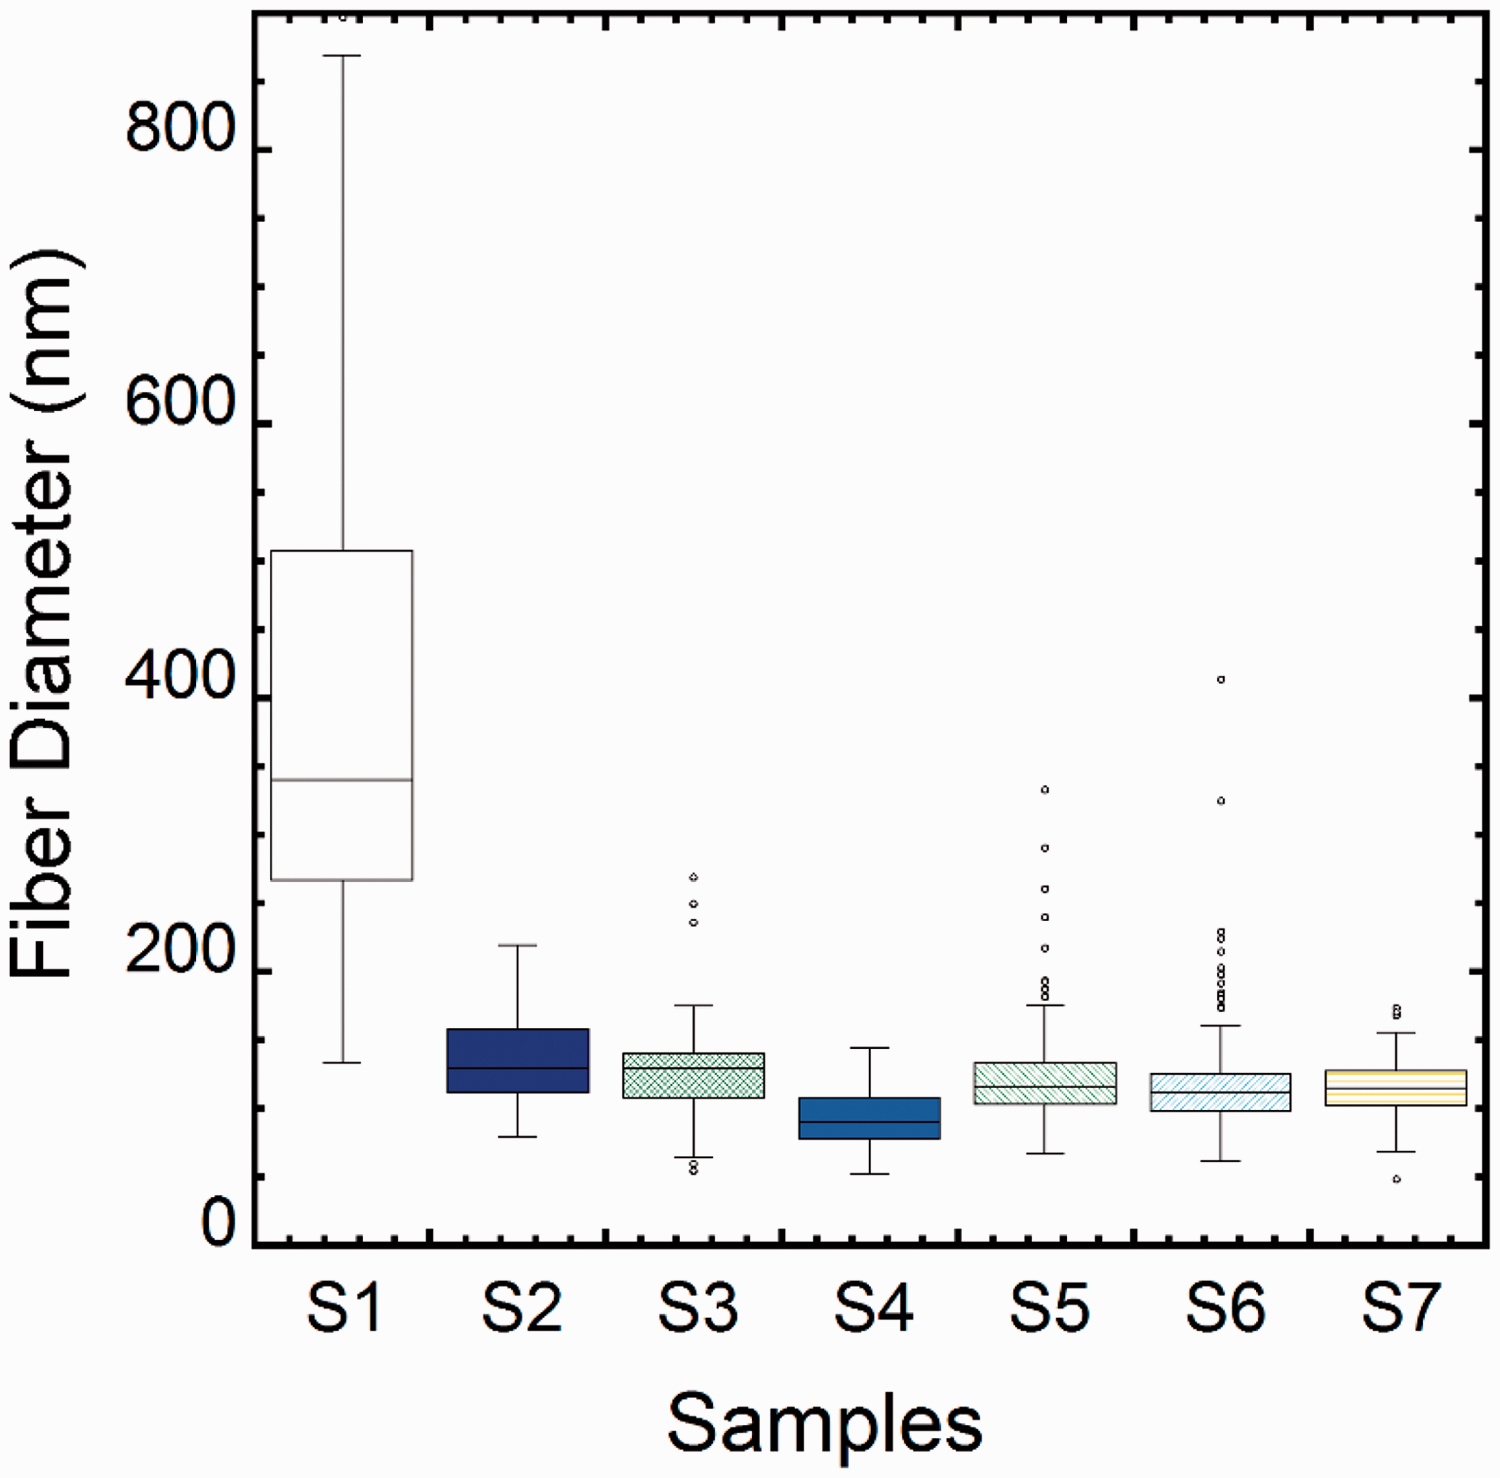
In summary, the addition of BN to the polymer solution resulted in a decrease in fiber diameter. It is important in filtration and biomedical applications to consider nanofibers with narrow distribution in fiber diameter and smaller mean fiber diameter to have better performance properties. This study suggests that the production of such smaller-diameter nanofibers through the addition of BN to a polymer solution is promising.
Thermogravimetric analyses (TGAs) were conducted to analyze the mass loss of BN-doped nanofibers. Figure 6 shows that both BN-doped and pure nanofibers had greater mass loss from 200℃ to 420℃ be explained by the degradation of PCL within the structure of the doped and pure nanofiber mats. At temperatures above 420℃, the polymers degraded completely [32]. The 2% (w/w) BN-doped Sample 2 and pure PCL polymer nanofiber sample lost more of their mass. The 10% (w/w) BN-doped Sample 7 lost the least mass. Since BN nanoparticles can withstand very high temperatures particularly in inert atmosphere, they did not lose mass and did not degrade thermally even at 900℃ [5]. In fact, a slight weight increase in BN and BNNFs was due to the formation of B2O3, as mentioned elsewhere [3,5] (Figure 7). The TGAs showed that the thermal resistance of the 10% (w/w) BN-doped material increased with the addition of BN to the solution.
Thermal gravimetric analysis results for BN and BNNFs. Differential thermal analysis results for BN and BNNFs.

The DTA diagram in Figure 7 shows a single peak in each DTA curve corresponding to a single-step degradation reaction of PCL polymer chains in the BNNFs. The degradation of the 10% BN-doped sample at 400℃ was less than that of other nanofiber structures, while the PCL nanofiber structure completely degraded at 400℃.
The absorbance results of the BN, PCL nanofibers and the BNNFs were recorded using Fourier transform infrared spectroscopy (FTIR) analysis. As shown in Figure 8, characteristic peaks for BN nanoparticles were seen at 801 cm−1, 1381 cm−1, and 1406 cm−1 [33,34]. The peak values for pure PCL nanofibers were clearly observed at 1172 cm−1, 1731 cm−1, 2951 cm−1, and 3446 cm−1 [35–39]. The peaks for the BN-doped surfaces consist of the combination of the peaks of pure PCL and pure BN nanoparticles; no new bond formations or chemical interactions were observed. The FTIR spectrophotometry results showed that the BN-doped nanofiber composite structures were produced successfully.
FTIR analysis results of (a) BN, (b) 13% (w/v) PCL nanofiber mat, and (c) 10% (w/w) BN-doped nanofiber mat.
Measured contact angles of the produced nanofiber mats.

First: the angle after the drops contact the material.
Second: the angle of contact of the drop 5 min later.
According to contact angle measurement tests, PCL nanofibers showed lower contact angle values. S1, PCL sample, has a hydrophilic structure with a 75° contact angle. The second set of measurements were not significantly different from the first set, which means the samples had low penetration affinity. The contact angle values of the BNNFs were compared based on the method of mixing; the samples prepared using the ultrasonic stirrer produced slightly lower contact angle values (Figure 9).
Contact angle measurements of the samples: (a) pure 13% (w/v) PCL, (b) BN-doped Sample 2, and (c) BN doped Sample 7.
Conclusion
The synthesis of BN and BN-containing structures allows for the production of more functional and advanced materials along with technological and scientific developments. In many studies, the use of nanofiber structures offers significant advantages over their other forms [40–42]. BN-doped nanofibers showed improvements in thermal and chemical performance relative to pure nanofibers. In this work, we describe the production of BNNFs and characterize them experimentally. BNNFs with nanoscale diameters have potential applications as electrical and thermal insulators [5], fuel cells [28,29], electronic devices [30,31], and functional polymeric composites.
SEM images of the nanofiber mats showed the pure PCL nanofibers to have fewer beaded structures, while the BN-doped nanofiber samples had many such structures. Comparison of corresponding BNNF samples that used different mixing methods showed that the ultrasonic stirrer had a modest effect on the formation of uniform fibers without beaded structures. It was observed that a high BN concentration increases the number of beads and therefore that BN concentration should be tuned to produce bead-free nanofibers. The pure PCL nanofibers were found to have a higher fiber diameter than the BN-doped nanofibers. Moreover, with the addition of BN to the PCL solution, the mean fiber diameter decreased, and the nanofibers became smoother and more uniform.
As a result of TGAs, mass loss of BN doped nanofiber mats were detected less than pure nanofibers; the addition of BN increased the thermal resistance of nanofibers. FTIR analyses showed successful immobilization of BNs into nanofibers without any type of chemical interaction. In contact angle measurements, it was observed that pure PCL nanofiber surfaces had lower values than BN doped nanofibers and exhibited hydrophilic behavior.
Footnotes
Acknowledgements
Suleyman Demirel University Scientific Research Projects Coordination Department (SDU BAP) is acknowledged for their valuable contribution and support. National Science Foundation of Turkey (TUBITAK) - (ARDEB 3501 - Project number: 213M263) is also acknowledged for the support of this project.
Declaration of Conflicting Interests
The author(s) declared no potential conflicts of interest with respect to the research, authorship, and/or publication of this article.
Funding
The author(s) disclosed receipt of the following financial support for the research, authorship, and/or publication of this article: This work was supported by the National Science Foundation of Turkey (TUBITAK) – (ARDEB 3501 – Project number: 213M263).