
Abstract
A radically new innovation was established for development of electromagnetic interference shielding. The innovation emphasis synthesis of carboxymethyl cellulose (CMC), carboxymethyl cellulose composite containing different metal nanoparticles (CMC-MNPs), and carboxymethyl cellulose nanofiber mat (CMC-NF) and carboxymethyl cellulose containing metal nanofiber mat (CMC-MNPs nanofiber mat) by electrospinning technique. Metal nanoparticles used include copper nanoparticles, iron nanoparticles, zinc nanoparticles, cadmium nanoparticles, and cobalt nanoparticles. Synthesized CMC–MNPs were characterized by using scanning electron microscopy coupled with high-energy dispersive X-ray and UV–visible spectroscopy that was used for confirmation of nanoparticles formation. The scanning electron microscopy images clearly showed regular flat shape with semiporous surface. All metal nanoparticles were well distributed inside the backbone of the cellulose without aggregation. The average particle diameter was 29–39 nm for zinc nanoparticles, 29–33 nm for cadmium nanoparticles, 25–33 nm for cobalt nanoparticles, 23–27 nm for copper nanoparticles, and 22–26 nm for iron nanoparticles. Electrospun carboxymethyl cellulose and CMC–MNPs nanofiber mats were synthesized by electrospinning technique and characterized using scanning electron microscopy, energy dispersive X-ray, and transmission electron microscopy. Scanning electron microscopy images of electrospun carboxymethyl cellulose and CMC–MNPs nanofibers reveal smooth and uniformly distributed nanofibers without bead formation with average fiber diameters in the range of 300–450 nm. Moreover, the diameters of electrospun carboxymethyl cellulose nanofiber mat were not affected by the presence of metal nanoparticles. Metal nanoparticles’ content inside the electrospun CMC–MNPs nanofibers was investigated by using atomic absorption spectroscopy. Electromagnetic interference shielding of electrospun carboxymethyl cellulose and CMC–MNPs nanofiber mats was evaluated. Data showed that the EMI-SE was increased in presence of metal nanoparticles and depending on both the metal nanoparticle contents and the electrical conductivity of metal nanoparticles.
Keywords
Introduction
Electrospinning is a broadly applied technology used to fabricate nanofibers from a wide range of materials including both natural and synthetic polymers [1]. A high voltage electrostatic field is used to induce the ejection of a liquid jet, which stretches into continuous fibers in the submicron range [2]. The electrospun material exhibits unique features such as uniform ultrafine fibers, high surface-to-volume ratio, tunable porous structures, and controllable composition, making it capable to achieve the desired result from its properties and functionality. These qualities allow the materials to be successfully applied in various fields such as biosensor [3], tissue engineering scaffold [4], drug delivery [5], wound dressing [6], and protective clothing [7].
Cellulose is among the most abundant material in nature; its structure is composed of β-
Different types of cellulose are also available for the preparation of nanocomposites, namely vegetable cellulose (VC), bacterial cellulose (BC), and cellulose nanofibers (CNF). Although sharing similar chemistry and molecular structure, the different kinds of cellulose show important differences in terms of morphology and mechanical behavior. For example, BC and CNF are composed of fibers with nanosized dimensions as compared to VC, which might impart new properties, and in some cases improvements to the resulting nanocomposite materials [13]. Cellulose is used as a soft matrix to accommodate inorganic fillers to produce composites that bring together the intrinsic functionalities of the fillers and the biointerfaces offered by cellulose fibers [14].
CNFs have attracted attention as reinforcing agents in polymer nanocomposites [15, 16] due to their high crystallinity, high elastic modulus [17], and greater strength than glass fibers (70 GPa). Natural conductive nanofibers have potential as polymer reinforcing agents because it is possible to combine reinforcement and conductivity with low electrical percolation threshold yet maintain the individual properties of the nanofibers. The technical literature describes the preparation of CNFs coated with conducting polymers [18–20]. However, very few papers deal with CNF coated with polyaniline [21, 22].
In addition, electromagnetic interferences (EMIs) occur when EM signals are unintentionally transmitted by radiation and/or conduction, causing electrically operated elements to behave improperly [23]. A good example to illustrate the combination of both interference mechanisms is a power cord from a device connected to a domestic electric supply (AC current) [24]. Shields can disable an EM wave to penetrate into a certain space through reaction and/or by an absorption–dissipation process [25].
Polymers provide many advantages over metals and ceramics in the area of EMI shielding. To block magnetic fields, magnetically permeable particles such as spinel ferrites or ion–nickel alloys should be combined with polymers [26]. In addition to weight reduction, the incorporation of nanoparticles of these magnetic materials might enable to exceed their essential cutoff frequency [27, 28].
Therefore, the tendency of using high aspect ratio particles has grown rapidly. Metallic particles of Ni [29], Ag [30] or Cu [31], and Al flakes [32] are first extensively incorporated into polymers such as polyimidesiloxane, polyurethane resins, or polyethersulfone. Next, epoxies and thermoplastics loaded with higher aspect ratio conductive stainless steel fibers [33] or metallized glass [34], polyester [35], and carbon fibers [36] shifted the attention away from particles. In addition, more recently flexible polymeric composites loaded with copper [37, 38] or silver [39] nanowires have been reported.
Structure, geometry, and electrical properties of conductive nanomaterials play an important role in the mechanical and electrical properties of polymer composite. Furthermore, the structure and morphology of nanomaterials in a polymer matrix are found to be essential in product properties. The morphology control of nanomaterials became of attention for researchers in changing the final properties of polymers [40].
The electromagnetic (EM) shielding effectiveness (SE) was presented by reducing graphene oxide sheets which interleaved between polyetherimide films fabricated by electrophoretic deposition [41].
When the polymer fiber diameters are changed from micrometers (e.g. 10–100 mm) to nanometers or submicrons (e.g. 10 × 10−3–100 × 10−3 mm), they have numerous wonderful features such as huge surface area-to-volume ratio (this ratio for a nanofiber can be as large as 103 times of that of a microfiber), flexibility in surface functionalities, and superior mechanical performance compared with any other recognized materials form. These exceptional things make the polymer nanofibers to be optimal applicants for several significant uses [42].
The novelty of this work resides in the development of EM shielding, nanofiber mats based on CMC–MNPs. The characterization of electrospun CMC–NF–MNPs nanofiber mats using scanning electron microscopy (SEM), EDX, TEM, and the content of metal nanoparticles will be determined by using atomic absorption spectroscopy. Electrospun CMC–MNPs nanofiber mats will be evaluated as EM shielding.
Experimental methods
Materials
Cellulose was extracted and characterized from the palm fronds according to reported methods [43]. Trifluoroacetic acid used as a solvent was purchased from Sigma-Aldrich USA Co. Monochloroacetic acid, ethanol 99%, ferric chloride, copper acetate, cobalt acetate, cadmium acetate, and zinc acetate were purchased from Sigma-Aldrich Co.
Carboxymethyl cellulose (CMC) preparation
CMC was prepared according to a reported method [44] as follows: in a glass bottle, cellulose (1 mole) was treated with 2 M sodium hydroxide at 80℃ for 10 min and then 1 M monochloroacetic acid added. The mixture was stirred using mechanical stirrer for 10 min and then kept in water bath at 80℃ for 3 h. At the end of reaction time, the reaction product was washed with isopropanol/water mixture (70:30) using Soxhlet for 24 h. The washed sample was dried in an oven at 70℃ and then analyzed for carboxyl content. Carboxyl content of prepared sample was 310 meq./100 g sample with degree of substitution equal to 0.61.
Preparation of CMC–MNPs
CMC–MNPs were prepared according to a reported method [45] as follows: 45 ml of acetate buffer solution (pH 5.8–6.5) was added to glass-stoppered bottle containing 0.1 g of CMC and 5 ml 0.1 M of metal salt solution. The mixture was irregularly shaken at room temperature for 24 h. CMC chelated with different metal ions (Fe+3, Cu+2, Co+2, Cd+2, and Zn+2) was transferred into reducing bath containing 4 g/l sodium hydroxide at pH 9.5 and then added 10 ml H2O2 (35%). The mixtures were stirred by ultrasonic stirrer for 2 h. Finally, the prepared CMC–MNPs were filtered and thoroughly washed with water and dried at 60℃ for 20 min.
Synthesis of CMC and CMC–MNPs nanofibers
CMC and CMC–MNPs solutions were prepared by dissolving a known amount (15% w/v) of CMC and CMC nanofibers containing different nanoparticle contents (10–40 wt% for each nanoparticle) separately in trifluoroacetic acid. The prepared solutions were stirred for 2 h at 80℃. Electrospinning of the prepared solutions was carried out using NEU-010 Nanofiber Electrospinning Unit, Kes Kato Tech Co., Japan. In electrospinning process, a high electric potential was applied to a droplet of CMC and/or CMC–MNPs solutions at the tip of a syringe needle (internal diameter 0.15 mm). A high voltage (25 kV) was applied to the collecting target drum by a high voltage power supply. Feeding rate of the polymer solution was adjusted (1 ml/h) by syringe pump. The electrospun CMC–NF and CMC–NF–MNPs were collected on a target drum placed at different distance from the tip of the syringe (5–20 cm). Rotational speed of the rotating target drum was kept at 40 ± 5 r/min. Electrospinning process was carried out under laboratory conditions (i.e. temperature = 25 ± 1℃; relative humidity = 71 ± 3%).
Characterization
Characterization of CMC–MNPs
CMC–MNPs were characterized using FT-IR (Shimadzu Scientific Instrument FT-IR-8400S) and scanning electron microscopy (field emission scanning electron microscope Joel, SM7600F-USA, Pleasanton, Canada). Metal nanoparticles formation was confirmed using UV–vis absorption spectra of the metal colloidal solutions recorded in the wavelength range of 200–800 nm using a Shimadzu UV 3600 UV–vis-NIR spectrometer (Shimadzu Corporation, Kyoto, Japan). The actual metal nanoparticles’ content in the CMC–MNPs was determined using atomic absorption spectroscopy (Varian SpectrAA-220 Zeeman, Australia) adjusted with graphite furnace accessory and equipped with deuterium arc background corrector according to APHA (2005). Appropriate amounts of CMC–MNPs were digested in HNO3 (1 M) for 24 h at room temperature. Metal nanoparticle contents inside the CMC were copper nanoparticles (CuNPs) = 38.43 wt%, iron nanoparticles (FeNPs) = 39.92 wt%, zinc nanoparticles (ZnNPs) = 38.43 wt%, cadmium nanoparticles (CdNPs) = 43.53 wt%, and cobalt nanoparticles (CoNPs) = 20.34 wt%. The mechanical properties in terms of the tensile strength of the CMC nanofibers and CMC–MNPs nanofiber mats were examined using a Lloyd LRX universal testing machine under laboratory conditions. Nanofiber samples were cut into a quadrilateral shape (10 mm × 100 mm). The crosshead speed and the gauge length were 20 mm/min and 50 mm, respectively.
Characterization of electrospun CMC–MNPs nanofibers
The morphology of electrospun CMC–MNPs nanofibers was studied using field emission scanning electron microscope (SM7600F-USA, Pleasanton, Canada). The average diameter of the electrospun nanofibers was determined using transmission electron microscopy (TEM ZEISS-EM-10-GERMANY).
Electromagnetic interference shielding (EMI-SE)
The EMI-SE of the electrospun CMC–NF–MNPs was measured using a vector network analyzer (E5071C, Agilent Science and Technology Co., Ltd, USA) in the frequency range from 1 to 18 GHz (X-band).
Electrical conductivity
Electrical conductivity was measured according to the four-point van der Pauw method on pellets compressed at 700 MPa. For this purpose, a current source SMU Keithley 237 and a Multimeter Keithley 2010 voltmeter with a 2000 SCAN 10-channel scanner card used. For less conducting samples, the two-point method, using a Keithley 6517 electrometer applied. Each sample measured 10 times in different directions by applying the potential of 100 V and average value was calculated.
Result and discussion
Characterization of CMC–MNPs
FTIR spectra
FTIR spectra of prepared nanocomposites samples, Figure 1, show broad band at 3300–3600 cm−1 for −OH carboxylic group and a peak at 1680–1737 cm−1 due to >C = O carboxylic group. The ether linkage appeared at 1100 cm−1 while a peak at 1920 cm−1 indicates the presence of −CH2 aliphatic present in carbon number 6 of unhydroglucose unit. The infrared spectra of parent cellulose indicate a strong band at 1737 cm−1 of carbonyl group of unionized COOH group; this band shifted to lower values of 1652 cm−1 corresponding to coordinated COO− M group in all studied complexes. The evidence for the monodentate coordination mode of carboxylate group is indicated by the difference of 250 cm−1 between νa(COO−) and νs(COO−) groups [46].
FTIR spectra of the carboxymethyl cellulose containing different metal nanoparticles.
SEM
Figure 2 shows SEM images and SEM-EDX spectra of CMC without and with metal nanoparticles. The SEM images clearly show regular flat shapes with semiporous surfaces. All metal nanoparticles were well distributed inside the backbone of the cellulose structure without aggregation. The average particle diameter is 29–39 nm for ZnNPs, 29–33 nm for CdNPs, 25–33 nm for CoNPs, 23–27 nm for CuNPs, and 22–26 nm for FeNPs. EDX spectral analysis of the CMC without and with metal nanoparticles shows a distinctive energy peak at approximately 0.22 keV characteristic for carbon and two peaks at 0.5 and 2.1 keV characteristic of oxygen. Figure 5(b) to (f) shows the EDX spectral analysis of CMC containing ZnNPs, CdNPs, CoNPs, CuNPs, and FeNPs, respectively. This figure shows distinctive energy peaks at 1, 8.8, and 9.9 keV for ZnNPs; 3.3, 8, and 9.8 keV for CdNPs; 0.5, 2.2, and 7 keV for CoNPs; 1, 8, and 9.5 keV for CuNPs; and 1.2, 6.2, and 7 keV for FeNPs.
SEM images and EDX spectra of carboxymethyl cellulose (a) blank, containing ZnNPs (b), CdNPs (c), CoNPs (d), CuNPs (e), and FeNPs (f).
UV–vis spectroscopy
Different metal nanoparticles were prepared in aqueous solution using the same method as mentioned in the experimental method without CMC to confirm the formation of the metals on the nanoscale. UV–visible spectra of the prepared metal nanoparticle solutions were examined at room temperature (25℃). Figure 3 shows the surface plasmon resonance (SPR) bands at 215 and 270 nm for FeNPs; at 280, 360, and 440 nm for CuNPs; at 232 nm for ZnNPs; at 420 nm for CdNPs and SPR; at 350 nm for CoNPs. The intensity and width of the bands indicate the presence of spherical nanoparticles, which also agrees with Mie theory [47, 48].
UV–vis spectra of FeNPs (a), CuNPs (b), ZnNPs (c), CdNPs (d), and CoNPs (e).
Elecrospun nanofiber characterization
SEM
Figure 4 shows the scanning electron micrograph at a magnification X 45,000 of electrospun CMC and CMC–MNPs which reveals smooth and uniformly distributed nanofibers without bead formation and with average fiber diameters in the range of 300–450 nm. As shown from Figure 4 there is no difference in the uniformity and smoothness of the electrospun nanofibers in presence and absence of metal nanoparticles. Moreover, the diameters of electrospun CMC nanofiber mat are not affected in the presence of metal nanoparticles.
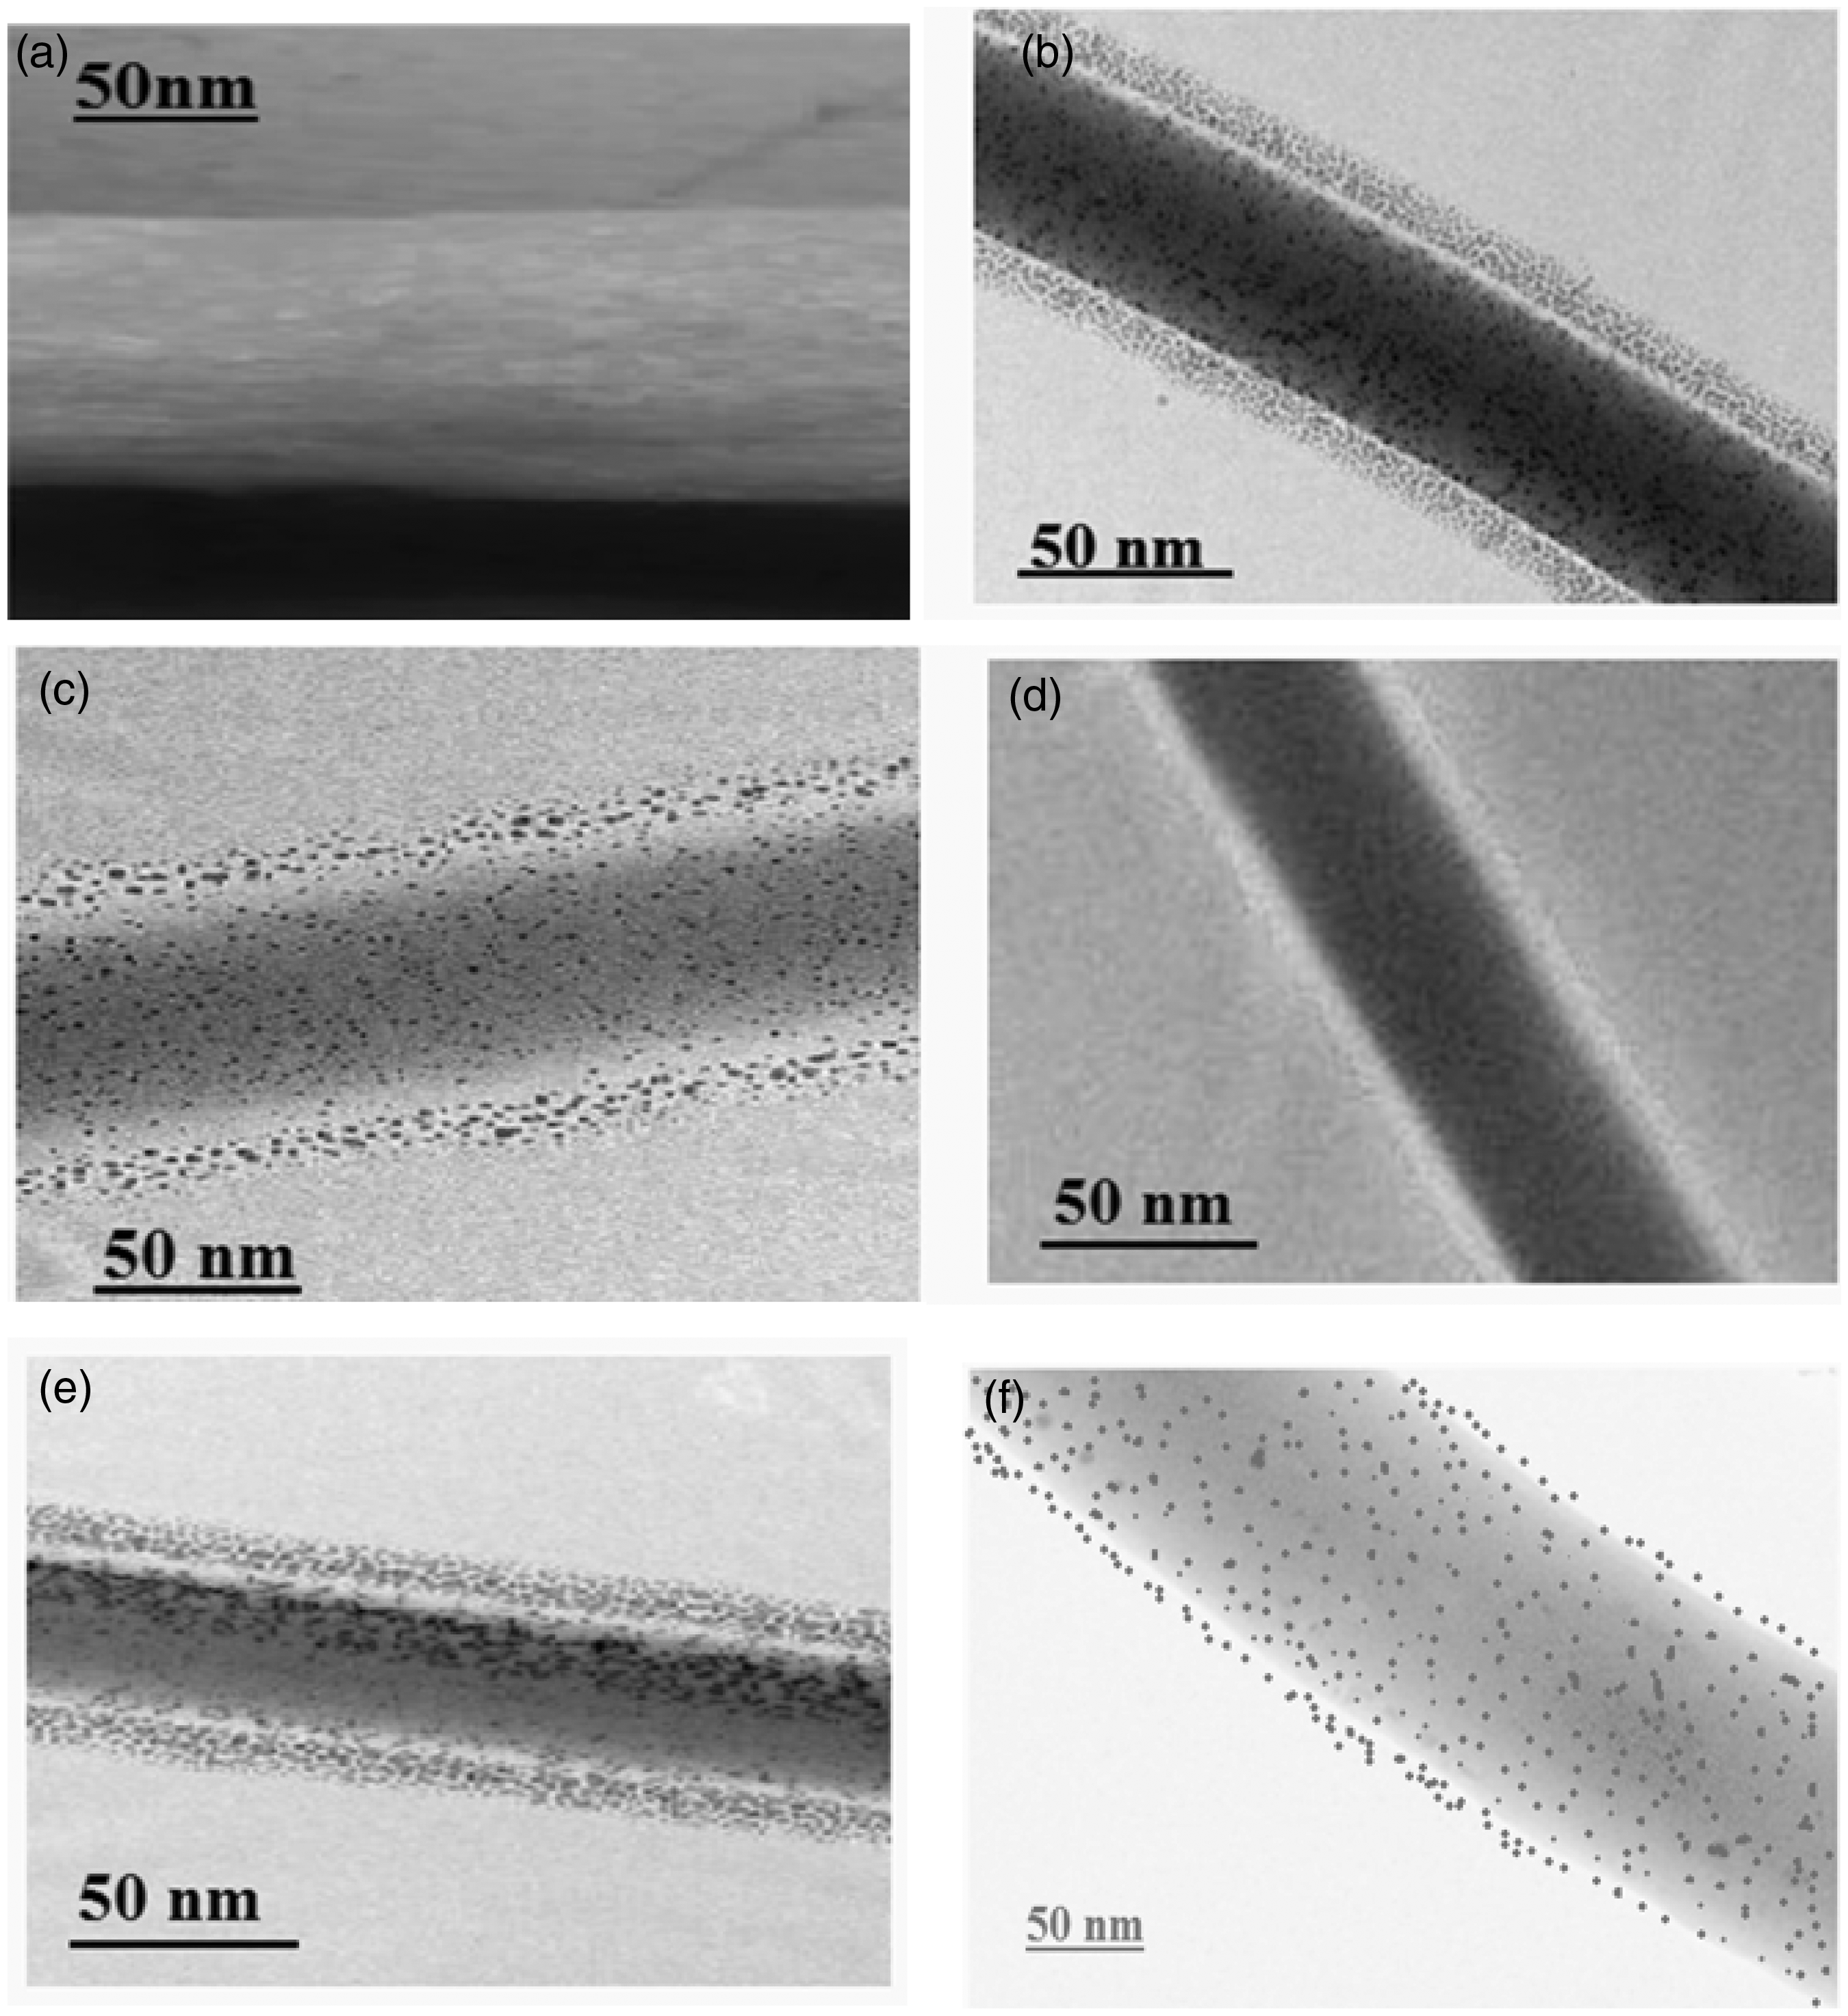
SEM micrograph of (a) electrospun CMC nanofiber mat, (b) electrospun CMC nanofibers containing CuNPs, (c) FeNPs, (d) ZnNPs, (e) CdNPs, and (f) CoNPs. Transmission electron microscope images of (a) electrospun CMC nanofiber mat, (b) electrospun CMC nanofiber mats containing CuNPs, (c) FeNPs, (d) ZnNPs, (e) CdNPs, and (f) CoNPs.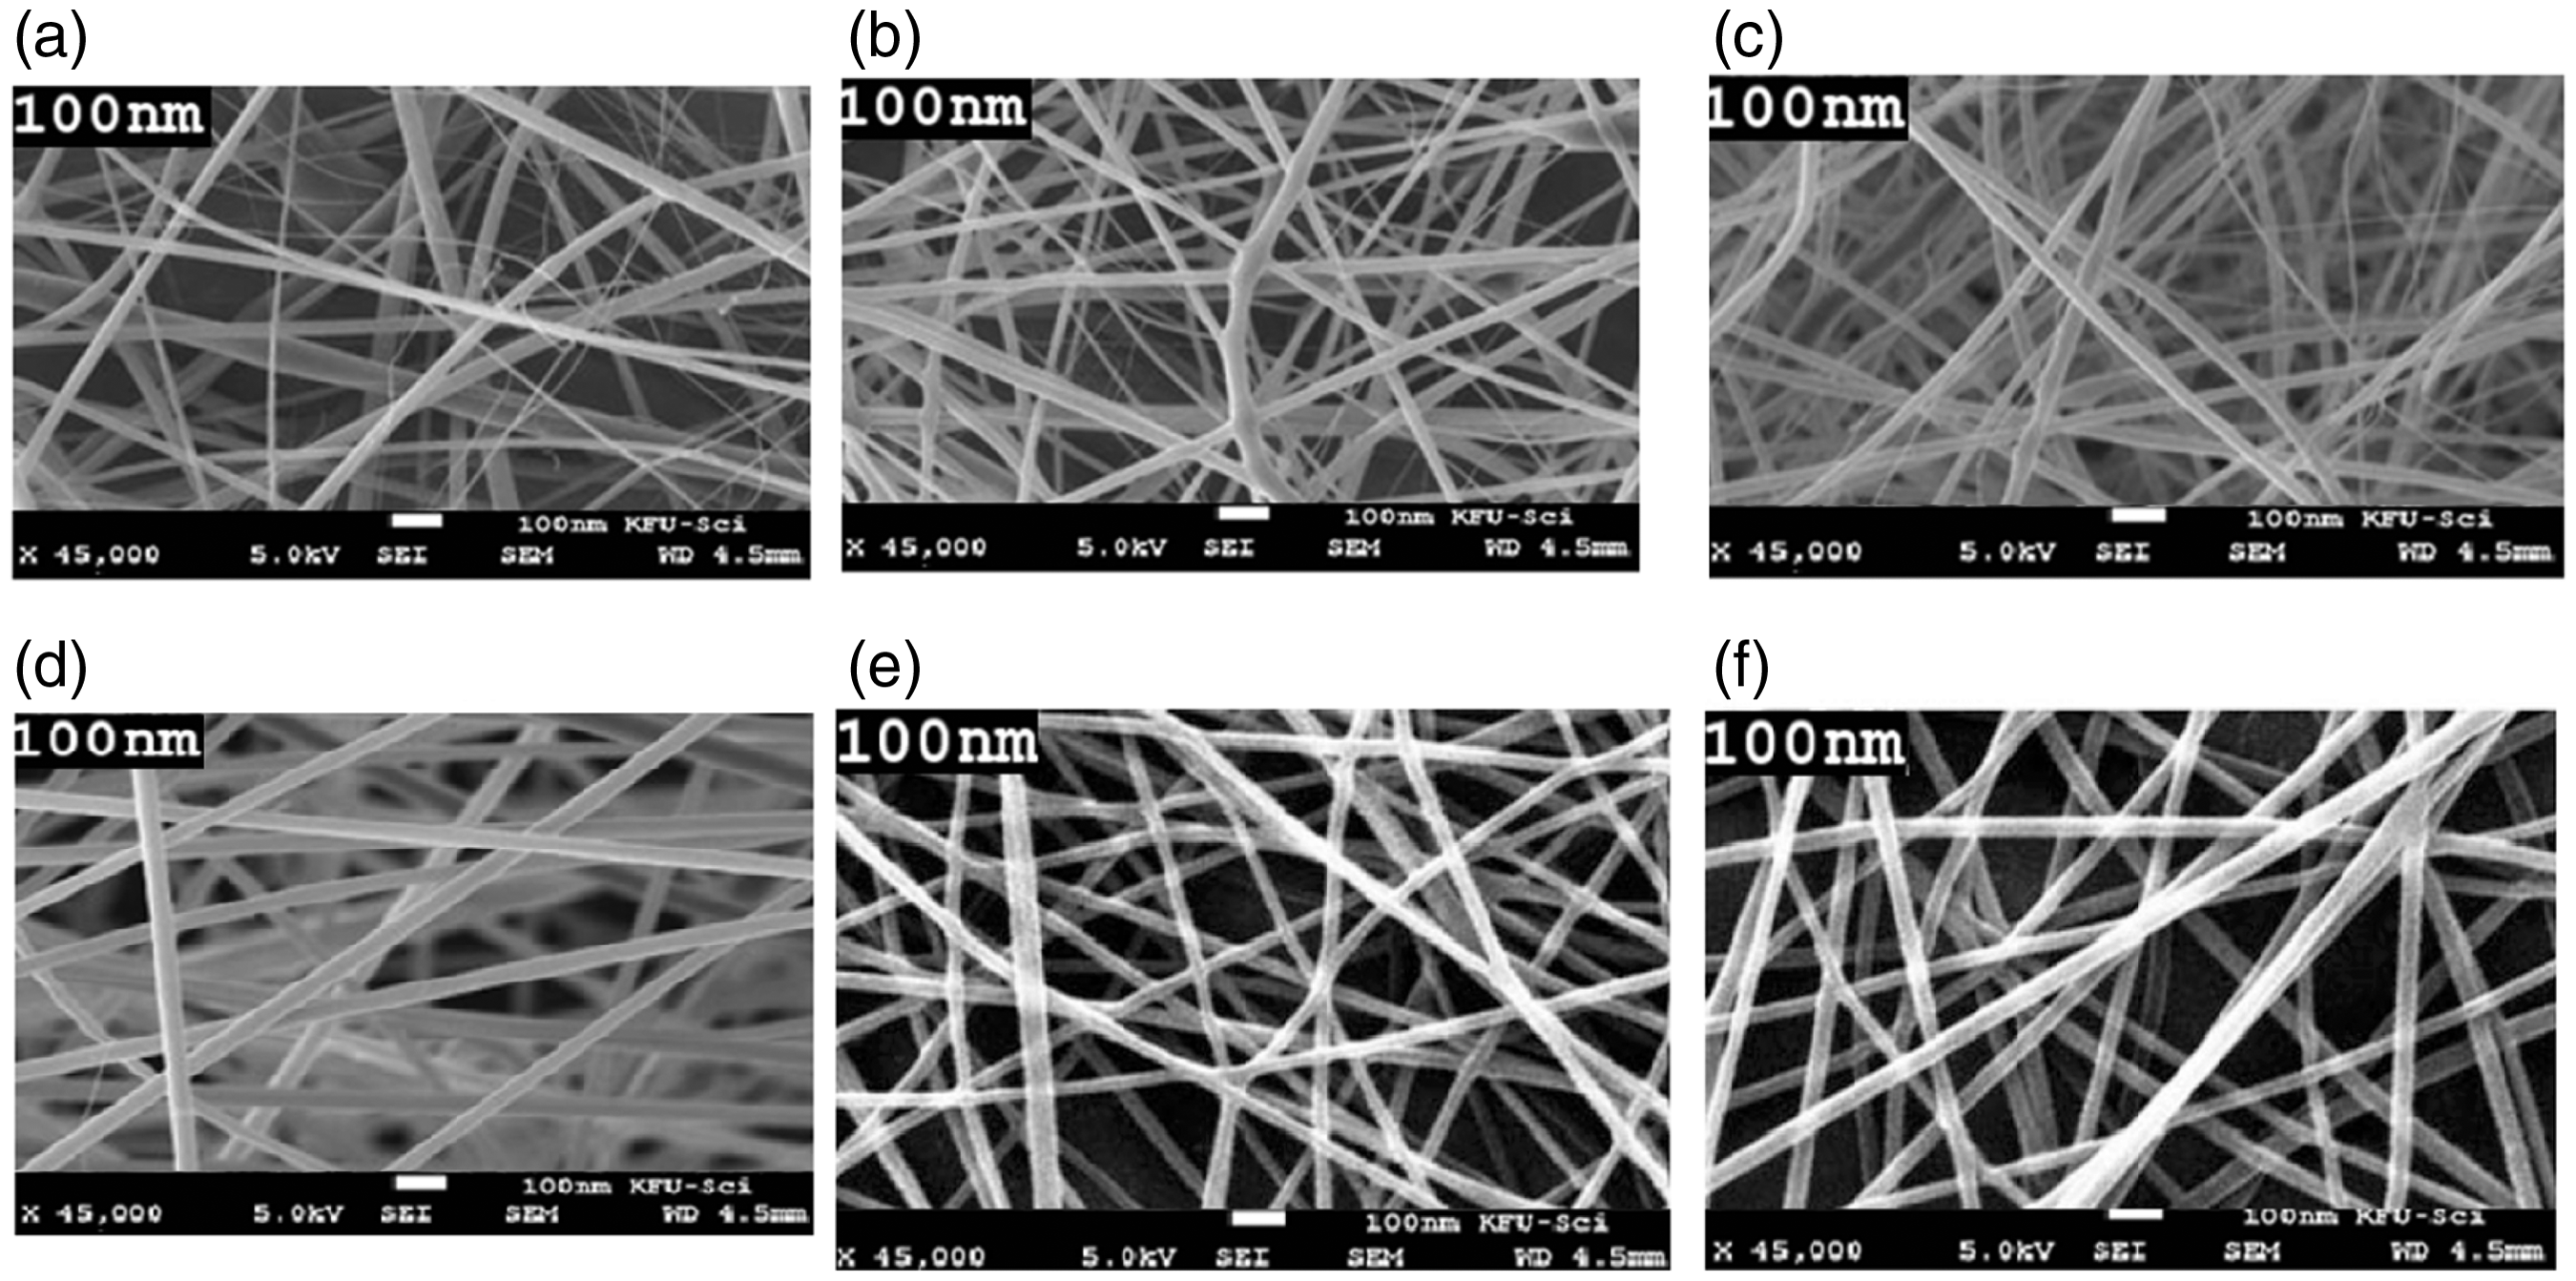
TEM
Figure 5 shows transmission electron microscope image of electrospun CMC and CMC–MNPs at high magnification power (500,000). It can be noted that MNPs are present in and on the electrospun CMC nanofibers. Generally, electrospun nanofiber diameter was in the range of 300–450 nm, while metal nanoparticles diameter inside the nanofibers was within the range of 23–27 nm for CuNPs, 22–26 nm for FeNPs, 29–39 nm for ZnNPs, 29–33 nm for CdNPs, and 23–27 nm for CoNPs. Therefore, it detected that the MNPs were incorporated in situ the electrospun nanofibers, and some of them were also present on the nanofiber surface. However, TEM pictures show the difference between the electrospun nanofibers with and without MNPs, as the nanoparticles are obviously shown as dark spots (Figure 5(b) to (f)).
Electrical conductivity
Electrospun CMC–NF was not electroconductive (electrical resistivity in the range of 10−10–10−8 σ/(S/m)). On the other hand, presence of metal nanoparticles increases the electrical conductivity significantly depicting the effectiveness of the metal nanoparticles. The electrical conductivity variations of electrospun CMC–MNPs nanofiber samples are shown in Figure 6. The electrical conductivity of samples in question acquires the following decreasing order: electrospun CMC/CuNPs nanofiber > electrospun CMC/ZnNPs nanofiber > electrospun CMC/FeNPs nanofiber > electrospun CMC/CoNPs nanofiber > electrospun CMC/CdNPs nanofiber > electrospun CMC–NF.
Electrical conductivity of electrospun CMC nanofibers (a) without nanoparticles and CMC nanofibers containing, (b) 10 wt% CuNPs, (c) 10 wt% ZnNPs, (d) 10 wt% FeNPs, (e) 10 wt% CdNPs, and (f) 10 wt% CoNPs.
Results of Figure 7 reveal that the electrical conductivity increases by increasing the metal nanoparticle contents. Reason for this is that the electrical conductivity increases by decreasing band gap energy which decreases by increasing metal nanoparticle contents.
Electrical conductivity of electrospun CMC–NF–MNPs with different meal nanoparticles contents (wt%).
EMI-SE
The performance of electrospun CMC and CMC–MNPs nanofiber mats as EMI shields has been determined from 1 to 18 GHz and explained in terms of their electric and magnetic behavior. EMI-SE of electrospun nanofiber samples is expressed as the following equation according to the literature [49, 50]

Figure 8 shows EMI-SE of electrospun CMC nanofiber mat and CMC–MNPs nanofiber mat with different metal nanoparticles contents. The results indicate that of EMI-SE values of electrospun CMC–MNPs nanofibers are higher than those of electrospun CMC nanofiber. EMI-SE of elecrospun CMC–MNPs nanofiber mat has the following decreasing order, EMI-SE of CMC/CoNPs nanofiber > EMI-SE of CMC/CdNPs nanofiber > EMI-SE of CMC/FeNPs nanofiber > EMI-SE of CMC/ZnNPs nanofiber > EMI-SE of CMC/CuNPs nanofiber > EMI-SE of CMC–NF. These phenomena could be associated with the response of metal nanoparticles toward EM radiation affected by electrical conductivity, permittivity, and magnetic permeability. By increasing the electrical conductivity, the reflection of metal nanoparticles increases and EMI-SE decreases [53]. For commercial application purpose, minimum EMI SE of a shielding material should be 20 dB. Figure 8 shows also that EMI-SE increases by increasing nanometal contents up to 30 wt% and then decreases. It seems logical that there is a limit to the amount of nanoparticles inside nanofibers called the “percolation limit,” and above this limit the nanoparticles will be agglomerated and the conductivity and reflection of nanoparticles will be increased. However, here, the amount is kept low 40 wt% to provide the maximum absorption and minimum reflection [53].
EMI shielding of electrospun cellulose nanofiber containing different nanoparticle contents.
Tensile properties
Figure 9 shows the effect of MNPs contents on the tensile strength of electrospun CMC nanofibers. It is detected that the tensile strength for all the CMC electrospun nanofiber and electrospun CMC–MNPs nanofiber mats was in the range of 15.0–14.0 MPa, with the average value being 14.5 MPa. The results reveal that the presence and the content of MNPs had no significant effect on the tensile properties of electrospun CMC nanofiber mats.
Tensile strength (MPa) electrospun CMC–MNPs nanofiber mats containing different MNPs contents.
Conclusion
EM shielding CNFs were successfully synthesized from CMC containing different metal nanoparticles by electrospinning. CMC containing different metal nanoparticles was prepared and characterized by FTIR, SEM, EDX, and the presence of metal in the nanoform was confirmed by UV–visible spectroscopy. Electrospun CMC containing different metal nanoparticles was confirmed by SEM, EDX, and TEM spectra analysis. SEM images and EDX spectra analysis revealed that all metal nanoparticles are well distributed and existed inside the backbone of the cellulose structure without aggregation. The average particle diameter was 29–39 nm for ZnNPs, 29–33 nm for CdNPs, 25–33 nm for CoNPs, 23–27 nm for CuNPs, and 22–26 nm for FeNPs. UV–visible spectra were more evenly confirmed the presence of spherical nanoparticles and observed that SPR bands for FeNPs at 215 and 270 nm; for CuNPs at 280, 360, and 440 nm; for ZnNPs at 232 nm; for CdNPs at 420 nm and SPR for CoNPs at 350 nm. When evaluated by SEM, electrospun CMC and CMC–MNPs appeared morphologically similar and the diameter not affected by presence of nanoparticles. TEM analysis revealed that all MNPs were integrated inside the nanofibers and some of them were outside the surface of nanofibers. The diameter of the electrospun nanofibers was in the range of 300–450 nm while the diameter of metal nanoparticles inside the nanofibers was within the range of 23–27 nm for CuNPs, diameter of FeNPs was 22–26 nm, ZnNPs was 29–39 nm, CdNPs was 29–33 nm while the range of CoNPs was within 23–27 nm. Electrospun CMC–MNPs nanofibers had EMI-SE and this shielding depends upon metal nanoparticle content and it was found that EMI-SE of CMC–NF/CoNPs > EMI-SE of CMC–NF/CdNPs > EMI-SE of CMC–NF/FeNPs > EMI-SE of CMC–NF/ZnNPs > EMI-SE of CMC–NF/CuNPs > EMI-SE of CMC–NF.
Footnotes
Acknowledgments
This article was founded by the National Plan for Science, Technology and Innovation (MAARIFAH)-King Abdulaziz City for Science and Technology-the Kingdom of Saudi Arabia, award number (11-NAN1821-06).
Declaration of Conflicting Interests
The author(s) declared no potential conflicts of interest with respect to the research, authorship, and/or publication of this article.
Funding
The author(s) received no financial support for the research, authorship, and/or publication of this article.