
Abstract
This paper aimed to reveal the low-velocity impact responses characteristics and failure mechanism of 3-D braided composites with experimental and frequency domain analysis method, respectively. The low-velocity impact tests were carried out by Instron® 9250 drop-weight instrument with five different impact velocities from 1 m/s to 6 m/s. The results showed that the peak load and absorbed energy increased with the increase of impact velocity. The load–time curves which were in time domain were transformed into frequency domain with Hilbert–Huang Transform (HHT) method. Combined the failure morphologies of 3-D braided composites with frequency domain analysis results, it could be precisely found out the failure mechanism of 3-D braided composites. At the impact velocity of 1 m/s, the 3-D braided composites only had elastic deformations. With the increase of impact velocity, resin crack was the main failure mode of 3-D braided composites. The frequency of impact stress waves which caused the elastic deformation and resin crack mainly located at 0–10 kHz and 60 kHz. When the impact velocity increased to 6 m/s, fiber tows breakage was the main failure mode, and the frequency of impact stress wave located at 15–20 kHz.
Introduciton
3-D braided fabrics are fabrics in which yarn interweaves in a diagonal way, formed by inter-plaiting three orthogonal sets of yarns. 3-D braided fabrics have the ability to directly form a variety of complex shapes, which eliminate the process of cutting to form joints, overlaps, and splices. Based on the excellent performance of 3-D braided fabrics, 3-D braided composites show higher mechanical properties than traditional laminates, such as high strength, high stiffness, and high torsional stability. 1 Moreover, the high inter-laminar shear strength prevents delamination of the 3-D braided composites when subjected to impact loadings. Therefore, the 3-D braided composites are widely used in structural parts especially to which usually applied impact situations.
The quasi-static mechanical properties of 3-D braided composite materials have been reported extensively.2–6 However, the impact responses of 3-D braided composite materials are much more complex and have not been investigated fairly well so far. Gong et al. 7 carried out an experiment to study the response and damage of 3-D braided graphite/epoxy composite under sub-perforation velocity impact. Jenq et al.8,9 studied the ballistic impact response of 3D braided composites with two-step and four-step braiding methods, respectively. Flanagan et al. 10 investigated the penetration resistance and structural integrity of four-step 3-D braided composites subjected to velocities from 200 m/s to 1100 m/s. Shaker et al. 11 reported the low-velocity and high-velocity impact response of Kevlar fiber reinforced epoxy composite. Tang et al. 12 obtained the macro- and micro-fracture morphologies of 3-D braided carbon fiber/epoxy resin composite under various velocities. Gu et al.13–15 established a few models and studied the ballistic properties of 3-D braided composite with finite element method. Sun et al.16,17 found the high strain rate effect of 3-D four-step braided composites under uniaxial extension and compression loadings. The authors of the paper also studied the transverse impact and low-velocity impact characteristics of 3-D braided composites with finite element method.18–20
However, all the research results are focused on the time domain which cannot ignore the difference of stress wave spread through fibers and matrix. These are much more difficult to establish a continuum constitutive equation to analysis the failure mechanism of 3-D braided composites under dynamic loadings. Time frequency transformation method provides a new method to reveal the failure mechanisms which are hidden in time domain. Bussiba et al. 21 investigated the damage accumulation profile of C/C composites with acoustic emission method. Fast Fourier Transform (FFT) analysis of the acoustic emission waves revealed the characteristic frequencies during the fracture process. Sun et al.22,23 studied the high strain compression and extension characteristics of 3-D braided composites with Z-transform method. Ma et al.24–26 revealed the failure mechanisms of co-woven-knitted fabric composites under various strain rates with frequency domain analysis methods including: FFT, Hilbert–Huang transform method, and continuous-discrete frequency domain analysis method. Martinez-Jequier et al. 27 demonstrated the real-time evaluation of the induced delamination of carbon fiber-reinforced polymer composites with Lamb wave mode. Zhang et al. 28 also investigated the frequency domain characteristics of 3-D braided composite under low-velocity and transverse impact loadings by FFT method.
Most of the frequency analysis articles used FFT method or other methods, but based on the same principle of FFT. However, the FFT method is good at linear and stationary signals rather than nonlinear and non-stationary signals. The Hilbert–Huang Transform (HHT) method was reported to be suitable for nonlinear and non-stationary signals. 29 Therefore, this article will study the low-velocity impact response of 3-D braided composites and reveal the failure mechanism by HHT method.
Theoretical background
Huang et al.30,31 first introduced the HHT method based on the instantaneous frequency. The traditional time-frequency transform method such as FFT usually considered that the signals are represented by a sum of sine waves. However, the HHT method is more likely an empirical algorithm rather than a theoretical tool. The HHT method works well with the non-stationary and nonlinear data, while the traditional methods are helpless.
The HHT method is composed of empirical mode decomposition (EMD) and Hilbert Spectrum Analysis (HSA). First, the complicated data can be decomposed into finite and small number of Intrinsic Mode Functions (IMF) by EMD. Then the IMFs are treated with Hilbert transform method to get the relationships between time, instantaneous frequency, and amplitude.
The HHT method is based on an assumption that each signal is composed of many IMFs, and each IMF is defined by two criteria:
The number of extrema and the number of zero-crossings must either equal or different by no more than one. At any time, the mean value of the envelope defined by the local maxima and the envelope of the local minima is zero.
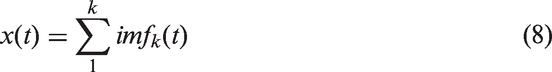
For a signal

Make the h1 as the original signal, and repeat the above step

After repeating process up to n times, the

If the The times the signal passes through zero point equal to the sum of local maximum value and the local minimum value. The standard deviation SD is in the range of 0.2–0.3.

The

The first residual function is

Repeat the sifting procedure k times until the certain conditions are reached. The certain conditions include the component of

Ignoring the impact of residue function, the signal
Then its Hilbert transform spectra

After the Hilbert transform, the marginal spectrum is defined as
Therefore, the HHT method is different from the traditional time-frequency transform methods. An overwhelming majority of the signals can be applied to the HHT method even if they are non-stationary and nonlinear. The HHT method is of important significance to be used in engineering areas.
Experimental
3-D braided composite materials
The structure and schematic sketch of 3-D braided fabric are shown in Figure 1(a). The carbon fiber tows (Toray®, T300-6K) are used for braiding with four-step 1 × 1 braiding procedure. The array for the 3-D braided fabric is 29 × 5. The braiding angle and pitch length of the 3-D braided fabric are 28 ± 3° and 3.2 ± 0.2 mm, respectively. Then the 3-D braided fabric is used as a preform to form the 3-D braided composite.
3-D braided composites: (a) schematic sketch of 3-D braided fabric and (b) specimen.
The epoxy resin (TDE-85) combined with curing agent (N, N-Dimethyl benzyl amine) and accelerating agent (HK-021 Me-THPA) is injected into the preform by Resin Transfer Molding (RTM) method. The curing cycle was 130 ℃ for 2 h, 150 ℃ for 1 h, 160 ℃ for 8 h and finally 180 ℃ for 3 h. The fiber volume fraction is approximately 58%. The 3-D braided composite specimen is shown in Figure 1(b) and the size is about 125 mm (thickness) × 25 mm (width) × 3 mm (thickness). Furthermore, the specimen includes dozens of integral 3-D braided structure cell, which ensure that the low-velocity behavior of the specimen consists with that of the 3-D braided composites materials.
Low-velocity impact tests
The Low-velocity impact tests are carried out by Instron® Dynatup 9250 drop-weight instrument, which consists of cross girder, guiding rods, added mass chest, electronic sensor and impactor. Here, the impactor is released from different heights in order to generate impact velocities ranging from 1 m/s to 6 m/s. The diameter of the hemispherical end impactor is 12.7 mm. The mass of the impactor is 6.441 kg and therefore the generated impact energy ranges from 3.22–116 J. The low-velocity test apparatus also incorporates a latching mechanism which catches the impactor after its initial impact so as to eliminate multiple impacts the specimen. The 3-D braided composite specimens are supported by a fixture and impacted at the center. Figure 2
28
shows the low-velocity test apparatus and specimen fixture. The gauge length of the system is 100 mm. The 3-D braided composite specimens are tested along the thickness direction.
Low-velocity impact test of the 3-D braided composites.
28

Results and discussions
Experimental results and discussions
The low-velocity impact tests of 3-D braided composite were conducted under five different impact velocities: 1 m/s, 2 m/s, 3 m/s, 4 m/s, and 6 m/s. The typical time–impact force–time–energy absorption curves were illustrated in Figure 3. It could be seen that the impact force increased linearly at initial stage and then decreased gradually after the maximum value. The time–impact force curves were impact velocity sensitive, the time to peak force became smaller with the increase of the impact velocity. Meanwhile, the peak force and absorbed energy increased with the increase of impact velocity.
Typical impact force-absorbed energy-time curves of 3-D braided composites under low-velocity impact tests: (a) 1 m/s, (b) 2 m/s, (c) 3 m/s, (d) 4 m/s, (e) 6 m/s.
All the time–impact force curves showed obvious vibration during the impact process. But in fact, all the curves were recorded after filter and pulse smoothing. The intense vibrations might attribute to the stripe shape of the specimen, the boundary condition, and the high elasticity of the carbon fiber and epoxy resin. The vibrations were more serious during the initial stage while they tend to be gentler after the peak force. It might be ascribed to the elastic deformation of carbon fiber and epoxy resin during the initial stage and plastic failure after peak force. Moreover, the vibrations were influenced by the impact velocity significantly.
The absorbed energy of 3-D braided composite specimen increased with the increase of time except the condition of 1 m/s. At the impact velocity of 1 m/s, the 3-D braided composite specimen mainly went through an elastic deformation process without plastic damage. A schematic representation of the total absorbed energy for 3-D braided composite under various impact velocities is shown in Figure 4.
Totally absorbed energy of 3-D braided composites under low-velocity impact tests.
The ratio of energy absorption is the ratio of absorbed energy of composite specimen and impact energy of the drop weight.

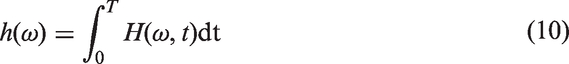
Figure 5 shows the front view of the failure morphologies of 3-D braided composite under various impact velocities. The damage area and failure degree increased with the increase of impact velocity. At 1 m/s, there was only a tiny resin crack in the middle of the composite specimen. At 2 m/s and 3 m/s, the resin crack area grew bigger and bigger. At 4 m/s, besides resin crack, the resin crack area did not increase, but a few carbon fiber tows on the surface of the composite specimen broke. Therefore, the main failure modes were fiber breakage and resin crack. When the impact velocity increased to 6 m/s, all the carbon fiber tows were broken, and the composite specimen split into two parts. Furthermore, the shape of the breakage was saw tooth, which was attributed to shear failure and special structure of 3-D braided composite.
Failure morphologies of 3-D braided composites under low-velocity impact tests: front view.
To better understand the failure mode of 3-D braided composite under the impact velocity of 6 m/s, Figure 6 depicted the magnified failure morphologies including front view, back view, and side view. The 3-D braided composite specimen fractured and fiber tows breakage was the main failure mode. Additionally, through the side view, it was clear to find that the 3-D braided composite had a clean cut cross-section, which provided a good prove of the integrated structure of the 3-D braided composite.
Local fracture morphologies of 3-D braided composites under low-velocity impact (v = 6 m/s).
HHT results and discussions
The time–impact force curves obtained from low-velocity impact tests were transformed by the HHT method from time domain to frequency domain to elucidate the failure mechanisms of the 3-D braided composites under various impact velocities.
The time–impact force curves were considered as the original signals to decompose into the IMFs based on the theoretical background mentioned above. Figure 7 depicted the IMFs under different impact velocities. Each IMF component could be recognized as an adaptive basis function. The IMFs were shown as approximately sine wave-form, and the residual function was as monotonically increasing function. Therefore, the IMF and residual function results met the requirements of EMD method. The IMF was a function of time and amplitude, which indicated a unique time–frequency characteristic.
EMD results for 3-D braided composites under low-velocity impact tests: (a) 1 m/s, (b) 2 m/s, (c) 3 m/s, (d) 4 m/s and (e) 6 m/s.
The HHT spectra could be obtained by Hilbert transform with the IMFs. Then the relationships between time, frequency, and amplitude could be established. Figure 8 showed the HHT spectra of 3-D braided composites under low-velocity impact loadings. At the impact velocity of 1 m/s, the frequency mainly located at the range of 0–10 kHz, and 60 kHz. Also, the brightness which meant the amplitude of the signal was limited. At 2 m/s, the frequency mainly distributed at 0–10 kHz, especially a bright line at the frequency of about 5 kHz. The points at 2 m/s were obviously brighter than that of 1 m/s, therefore, the amplitude was larger. When the impact velocity increased from 3 m/s to 6 m/s, most of the bright line mainly located at the low frequency region at about 0–10 kHz. At the impact velocity of 6 m/s, a bright line also appeared at the frequency of about 20 kHz. The areas about the suddenly changes of bright line which were marked in red lines were mean the frequency saltation. The frequency saltation implied the changes of the failure modes of 3-D braided composites. The corresponding time meant when the failure modes changes. This was very difficult to identify in the time–impact force curves in time domain.
HHT spectra for 3-D braided composites under low-velocity impact tests: (a) 1 m/s, (b) 2 m/s, (c) 3 m/s, (d) 4 m/s and (e) 6 m/s.
As the impact velocity increased from 1 m/s to 6 m/s, the frequency range became wider and wider, while the points became brighter and brighter. The increase of the frequency range meant that the oscillation inside the composite specimen increased. Further, there were different damage modes inside the composite specimen during the impact process. The brighter of the points illustrated the larger of the amplitude, which mean the larger of the impact energy.
Figure 9 shows the marginal frequency spectrum of 3-D braided composites under low-velocity impact loadings. It shows the relationship between frequency and amplitude. Based on equation (10), the amplitude was the statistics of the frequency distribution. It can be found out that the large amplitude area mainly concentrated on the frequency of 0–10 kHz among all the five impact velocities. For the impact velocity of 1 m/s, the large amplitude area mainly located around 0–5 kHz and 60 kHz. With the increase of impact velocity, the amplitude at the frequency of 60 kHz decreased close to 0. However, the large amplitude at the frequency of 15–20 kHz increased. Additionally, the maximum amplitude increased with the increase of impact velocity. The marginal frequency spectrum can also show different failure mode of 3-D braided composite specimen at different frequency distribution. The sudden increase of amplitude at a certain frequency distribution usually indicated a certain failure mode. Combined with the failure morphologies of 3-D braided composite specimen and the analysis results based on the HHT method, it could establish the relationship between frequency and failure mode. At 1 m/s, the 3-D braided composite mainly experiences an elastic deformation, while the frequency mainly located at 0–10 kHz and 60 kHz. As the impact velocity increase to 6 m/s, the 3-D braided composite specimen experiences a whole process from elastic deformation to plastic damage. The failure mode changes from resin crack to fiber tows breakage and resin crack. At the same time, the large amplitude mainly distributed at the frequency of 0–10 kHz and 15–20 kHz. Therefore, it be concluded that the elastic deformation and resin crack occurred at the frequency of 0–10 kHz and 60 kHz, while plastic damage and fiber tows breakage occurred at the frequency of 15–20 kHz.
Marginal frequency spectra for 3-D braided composites under low-velocity impact tests: (a) 1 m/s, (b) 2 m/s, (c) 3 m/s, (d) 4 m/s, and (e) 6 m/s.
Conclusions
The low-velocity impact characterizes of 3-D braided composites were tested by Instron® Dynatup 9250 drop-weight instrument with five different impact velocities. The HHT method which was a time–frequency transform method was used to reveal the failure mechanism of 3-D braided composites in the frequency domain. The experimental results showed that the impact force and absorbed energy increased with the increase of impact velocity. The HHT results show that the maximum amplitude increased with the increase of impact velocity. The frequency distributions can be divided into three parts: 0–10 kHz, 15–20 kHz and 60 kHz, which corresponded to a certain damage mode. At the impact velocity of 1 m/s, 2 m/s, and 3 m/s, the amplitude mainly located at the frequency of 0–10 kHz and 60 kHz. The failure mode of 3-D braided composites was resin crack. At the impact velocity of 4 m/s and 6 m/s, the failure modes of 3-D braided composites were fiber tows breakage and resin crack corresponding to the frequency area of 0–10 kHz and 15–20 kHz. Additionally, the frequency saltation in the HHT spectra implied the changes of the failure mode of the 3-D braided composites.
Footnotes
Declaration of Conflicting Interests
The author(s) declared no potential conflicts of interest with respect to the research, authorship, and/or publication of this article.
Funding
The author(s) disclosed receipt of the following financial support for the research, authorship, and/or publication of this article: The work is supported by the Priority Academic Program Development of Jiangsu Higher Education Institutions (PAPD), the National Natural Science Foundation of China (grant no. 11402155), the Natural Science Foundation of Jiangsu Province (grant nos BK20140396 and BK20140399), China Postdoctoral Science Foundation (grant no. 2014M551656), Jiangsu Planned Projects for Postdoctoral Research Funds (grant nos 1302061C and 1302112B), and the Shanghai Yang Fan Plan (grant no. 14YF1413600).