
Abstract
In this study, weft-knitted strain-sensing structures are described, along with the materials and manufacturing techniques required to produce the fabrics on a computerised flat-bed knitting machine. Knitted sensing fabrics with conductive yarns, i.e. silver-plated nylon yarn and polyester-blended stainless steel yarn have been created with different design possibilities. A laboratory test set-up was built to characterise the knitted sensors and the resulting equivalent resistance under the different level of strains. The most successful samples have been realised through a series of single conductive courses within the interlock base fabric structure using silver-plated nylon in terms of responsivity, repeatability and lower electrical signal drift. Deficiencies associated with strain-sensing structures realised through the intermeshing of conductive yarns have also been addressed.
Keywords
Introduction
Strain-sensing technology based on the textile-based structures is a major developing area in the context of electronic textiles. Traditional strain gauges elongate at very low strain levels [1]. However, larger strain levels need to be measured for human body applications [2]. Generally, strain gauges have been designed to convert mechanical input into a measurable electrical signal. Change in electrical values such as resistance [3], capacitance [4] or inductance [5] can be detected by appropriate strain gauges. Most textile-based sensors rely on change in resistance. Thus, their working mechanism is based on resistive strain gauges. Also, there are some textile-based sensors, which rely on a change in capacitance [6] value in response to applied strain.
Textile-based strain-sensing structures enable the measurement of body kinetics and some physiological signals where comfort properties and sensing reliability are needed. Textile-based sensors are integrated directly into textile structures unlike attachable rigid sensors [7–10]. As the responsive parts of the structure exhibits similar tensile properties to the rest of the structure, the flexibility of the electro-textile structure enhances the product. The embedding of conductive yarns into fabric structures or coating textile structures with conductive materials [11–13] are approaches that impart conductivity into textile-based strain sensors. In previous work, fabric strain gauges with polymer actuators for use in a glove was created to assist people with hand injuries or paralysis [14]. Textile strain sensors may be produced at different structural levels such as from yarn [15–17], fabric [18,19] or even in spacer [20] fabric form. Textile fabric production methods such as knitting [21–23], weaving [24], sewing [25] or embroidery [26] can be chosen as the manufacturing process. However, weft-knitted fabrics are the most suitable structures for the manufacturing of undergarments and vests for strain-sensing applications owing to their ability to conform to the user’s body shape. Enhanced level of elasticity and breathability of these fabrics in comparison with the other textile structures also improves the comfort properties and fit. Also, whole garment technology enables one step manufacturing of textile-based strain sensors in which sensing parts are embedded during the manufacturing process of the textile structure.
Despite considerable research in the creation of wearable strain sensors, only a few systems have been commercialised so far. The main problems being experienced are those of non-linearity and hysteresis in the response to applied strain, and also drift of the electrical characteristics of the textile sensor, both with time and from repeated use.
This article presents a study of the sensing properties exhibited by different design of weft-knitted strain sensors. Understanding of the electro-mechanical behaviour of the different types of weft-knitted strain sensors will help to select suitable sensor design for desired application areas. Sensing fabrics were manufactured from polyester-blended stainless steel yarn, silver-plated conductive nylon and non-conducting elastomeric yarns. The component yarns offered similar diameters, bending characteristics and surface friction, but their production parameters differed in respect of the applied design. The following section describes test apparatus and production of weft-knitted sensing structures followed by the testing method for the electro-mechanical properties of the sensors. The third part reports the results obtained from the experimental procedure and discussion of the electro-mechanical properties of the different types of knitted sensors.
Materials and methods
This part of the article provides information about the test rig, raw materials, construction and manufacturing of experimental knitted sensors and the testing methodology. Initially, some properties of non-conductive and conductive yarns are presented. Thereafter, the manufacture of knitted sensors with different designs is described.
Test apparatus
Initial electro-mechanical experiments for intermeshed conductive structures were carried out using a Zwick-Roell Z.2.5 tensile testing machine and the change of electrical resistance of samples was measured using a 34001 Agilent Multimeter or Wheatstone bridge arrangement. Figure 1 shows the measurement set-up.
A measurement set-up for electro-mechanical tests of sensing fabrics.
Zwick-Roell Tensile Testing Machine and measurement software
A Zwick-Roell Tensile Testing Machine was used to exert a controlled force on the test specimen. Displacement of the jaws was achieved through a precision lead screw thread and a stepping motor controlled by a computer. Force-strain data were recorded through TestXpert software, which allows the user to specify test conditions such as test speed, strain, force range and gauge length. Furthermore, the software also enables the creation of customised steps according to the test requirements. Figure 2 shows a screen image of the software interface.
A screen image of the software interface.
There are also two types of clamp, which may be used within a tensile tester. The first of which is a horn grip, which is based on a cone that the yarn is wrapped around. Horn grips reduce the stress concentration and reduce breakages of the yarns at the jaws by distributing the contact area between the yarn and the grip over an extended distance. However, this makes it difficult to determine an accurate gauge length; hence, the grips used in the experiments were a flat plate design; this type of jaw exerts high stress on the specimen contact points and increases the likelihood of the specimen breaking at the jaws. As it is important not to over-tighten the jaws, to avoid excessive stress concentration and yarn damage, flat plate clamps tend suffer slippage of the yarn but allow an accurately defined gauge length. Thus, a modification was made to the flat clamps by covering the inner surface of the jaws with sandpaper to prevent slippage. A test specimen must be fixed at two points in order that it might be subjected to a force using the top and bottom clamps. During testing, the bottom clamp was fixed while the top clamp was displaced at predetermined speed. The movement of only one clamp means that displacement of the top clamp equates to the specimen extension providing no slippage or breakage of the specimen occurs. A load cell was incorporated into the tensile tester to measure the load applied to the specimen. The electrical output from the load cell was logged by the controlling computer.
While the tensile tester jaws connected the specimen into the mechanical system, crocodile clips were used to make electrical connections between the specimen and an electrical resistance measurement device.
Agilent 34401A digital multimetre
An Agilent 34401A digital multimetre was used for electrical resistance measurement and Agilent Intuilink software was used to acquire data, which it automatically transferred to the Microsoft Excel environment.
Measurement device of the sensors realised through the series of single conductive course
A new electrical measurement device was used in conjunction with the tensile tester to obtain electrical signals for samples manufactured in serial conductive yarn arrangement. In this case, the device contains Wheatstone bridge circuitry has been used to measure the electrical signals more accurately. The device contains variable resistors which allow the adjustment of the initial resistance values according to the sample resistance. Figure 3 shows a schematic representation of Wheatstone bridge arrangement. The measurement range of the device varies between 120 and 1000 Ω, and there is a stabilised power conversion unit within the device which increases the input voltage to 12 V.
Schematic diagram of Wheatstone bridge.
To perform experiments, knitted samples are subjected to tensile testing and their resistive behaviour is monitored in respect of their tensile properties. The resistance of the sample may be measured by applying a known voltage to the specimen, then measuring the current and applying Ohm’s law:

The Wheatstone bridge is a useful alternative approach, as the unknown resistance can be measured without a calibrated (just a responsive) electrical meter. When the bridge is balanced, the voltage between D and B is zero – so the meter gives a null reading.
The balance condition is,

Hence,

During the experiments, the knitted sample is connected as one arm of the Wheatstone bridge.

Using this approximation for the bridge voltage, the unknown resistor may be found as shown in equation (5),

It should be noted that strain gauges are commonly designed to have a nominal resistance of 120, 350 and 1000 Ω as the levels of current and voltage required in associated electrical circuitry are of convenient value. In particular, self-heating of the gauges and electrical noise are small, yet the signals are sufficiently robust for instrumentation to be connected with minimal signal degradation.
Production of knitted sensors
A computerised flat-bed knitting machine was employed to manufacture knitted sensors. Following is the description of the knitting machine and the types of knitted sensor realised for this research study.
Computerised flat-bed knitting machine
To manufacture knitted sensors, a Shima-Seiki 12S 12-gauge computerised flat-bed knitting machine was employed, as illustrated in Figure 4. The knitted sensors were designed by using Shima Seiki Knit Paint software prior to being manufactured on the knitting machine. Mechanical movements within the knitting machine are controlled electronically using CAD/CAM systems. For the production of the sensors, packages of both non-conductive and conductive yarn were located on top of the knitting machine. Yarns were threaded to the knitting machine using a conventional route, with the yarns passing through ceramic guides, knot catchers and cymbal tensioners.
Shima-Seiki 12S computerised Flat-bed knitting machine.
This type of knitting machine enables the exact positioning of conductive zones with the help of the intarsia technique. Thus, it creates freedom of creation of conductive area according to the desired design and location.
Creation of various types of knitted strain sensors
In the light of the information that has been gathered from the detailed literature survey, various design and production methods have been assembled and used to produce knitted strain sensors to compare their sensing properties with the proposed design which is used for this project. Five samples were manufactured of each type to perform statistical analysis. First, conductive yarns were knitted in such a way that they intermeshed each other. A second approach enabled the creation of single conductive courses without intermeshing conductive yarns. It should be noted that conductive yarns were knitted into a non-conductive base structure in every design.
Knitted sensors via the intermeshing of conductive yarns
Knitted sensors via intermeshing of conductive loops.

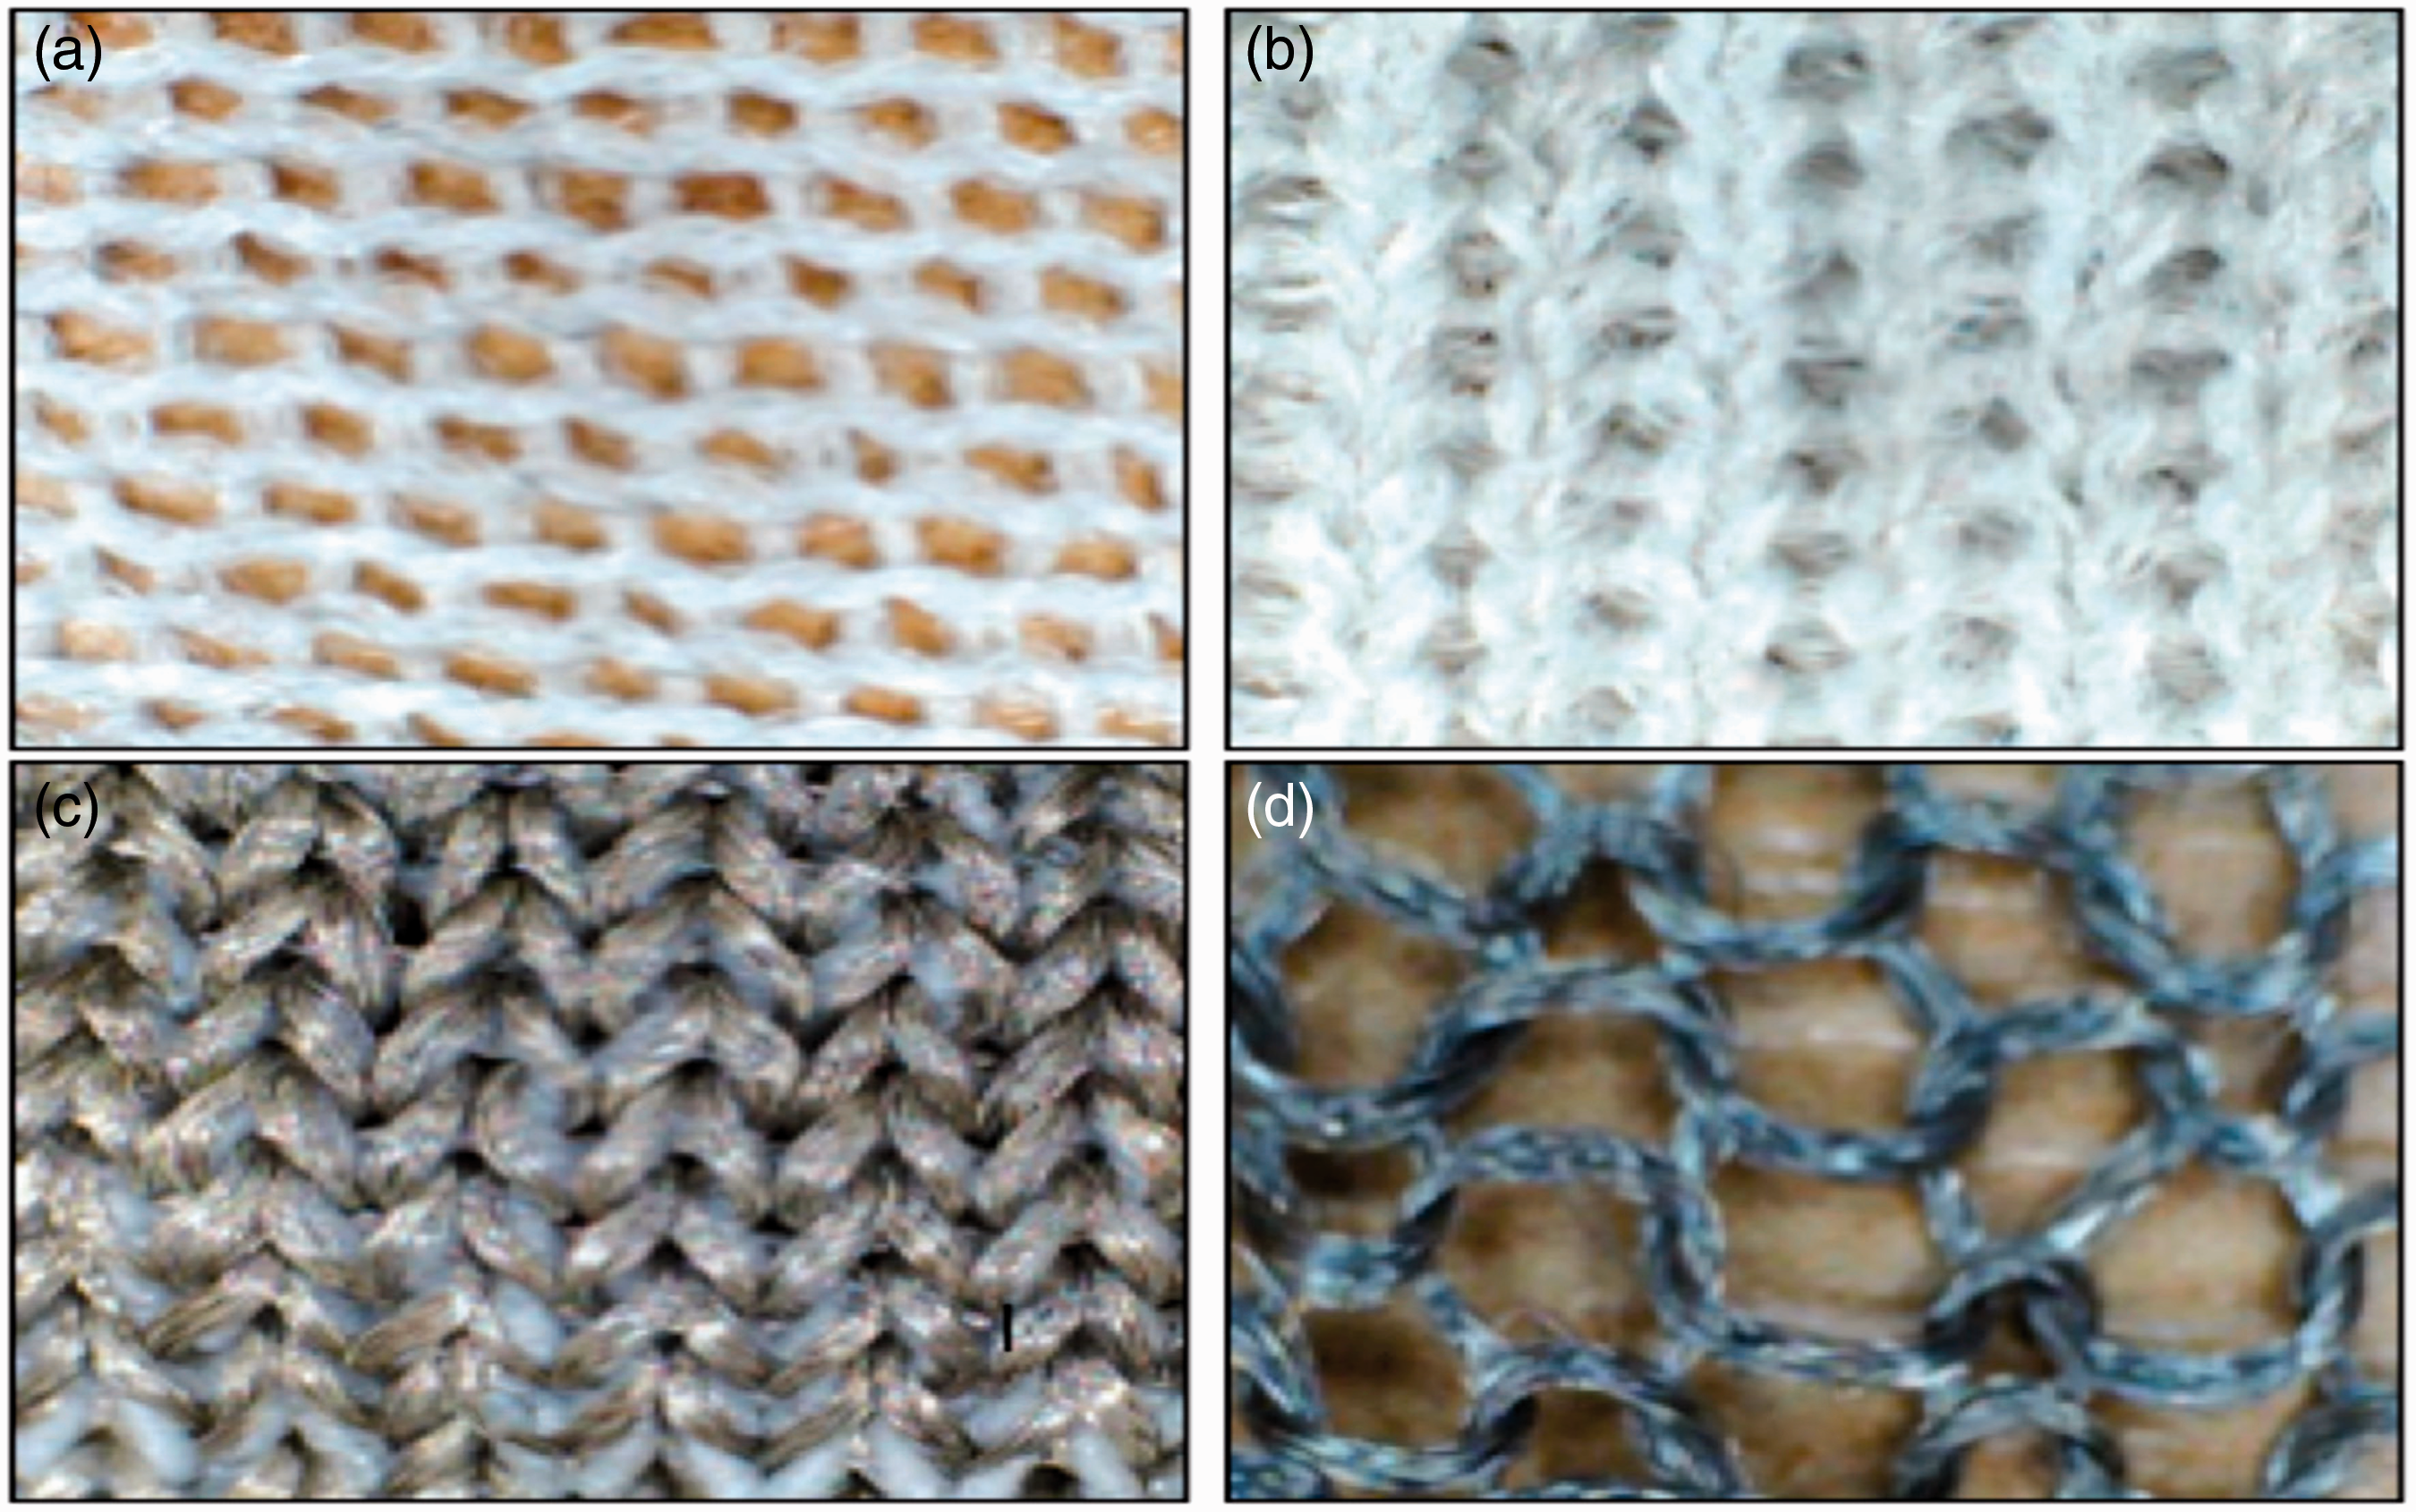
Conductive zones were manufactured as 34 wales and 13 courses for each structure. However, the dimensions of the conductive areas varied due to the different structural properties of the knitted samples. While Figure 5(a) and (b) represent CAD designs of knitted sensors for plain and interlock structures, respectively, Figure 6 closed up images of knitted sensors.
(a) CAD design of plain knitted structure with conductive zone and (b) CAD design of interlock knitted structure with conductive zone. (a) Plain knitted sensor manufactured by stainless steel spun yarn, (b) interlock knitted sensor manufactured by stainless steel spun yarn, (c) elastomeric interlock sensor manufactured by silver-plated yarn and (d) plain knitted sensor manufactured by silver-plated yarn.
Structural parameters of knitted samples.

Knitted sensors via a series of single conductive courses
For the production of single course sensors, conductive yarns were knitted into a base structure in a series of single conductive courses and conductive courses were separated from each other by non-conductive courses as shown in Figure 7. Initially, the conductive courses were knitted into an elastomeric single jersey structure. Thereafter, single jersey tube fabrics were created. Finally, interlock structures were created as base fabric structures with a series of conductive courses in plain loop arrangement. Table 3 shows a summary of the design arrangements.
(a) CAD design of knitted sensors with conductive zones and (b) magnified image of one course of knitted sensor showing conductive yarn as well as non-conductive yarn. Knitted sensors through a series of single conductive course.

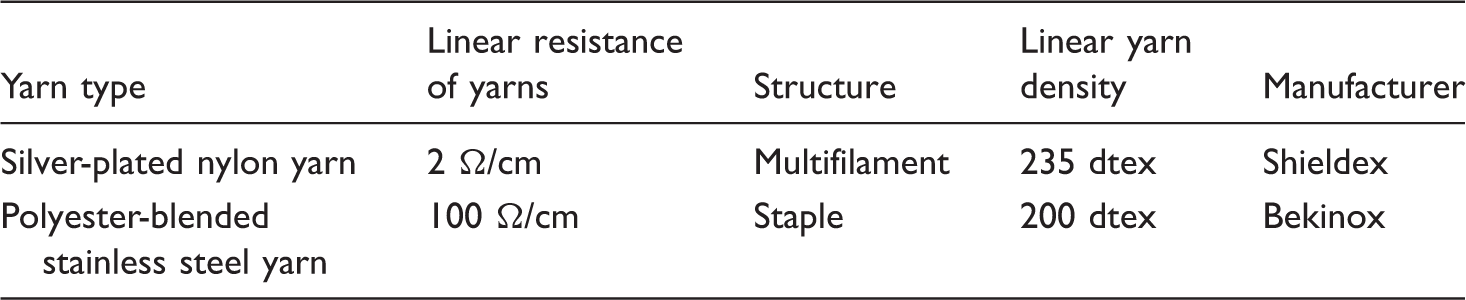
Properties of yarns
Properties of conductive yarns.
Properties of non-conductive elastomeric and polyester yarns.

Test methods of knitted samples
The test conditions of the knitted sensors were varied according to their type. Whereas sensors that contained elastomeric yarn were stretched up to the 40% level of strain for cyclic tests, non-elastomeric structures were stretched up to the 20% level of strain. All types of sensor were also stretched up to the 100% level of strain to investigate resistance–strain behaviour at high strain levels. Crosshead head speed was chosen as 60 mm/min during the tests. Fabrics were tested using the Zwick-Roell tensile testing machine under weft extension and electrical resistance was recorded simultaneously using the either Agilent digital multimetre or Wheatstone bridge arrangement.
Results and discussion
This section investigates the relationship between the resistance of the knitted sensors and applied strain under uniaxial tensile stress. Various types of sensor have been examined and discussions have been presented in terms of sensing properties. For this study, the sensors’ stability in terms of output repeatability, uniformity of the cyclic patterns during cyclic testing and resistance-changing behaviour according to the applied stress have been discussed.
Resistance–strain relationship of the sensors realised through the intermeshing of silver-plated yarn
Resistance–strain relationship of the plain knitted structure
Figure 8 shows the electro-mechanical tests results of a plain knitted structure up to the 100% level of strain. It should also be noted that 100% elongation of the structure is beyond its working range. However, fabric was stretched up to that strain point to explain the resistance response mechanism of the structure up to higher level of strain values.
Resistance–strain relationship of the plain knitted structure up to the 100% strain level.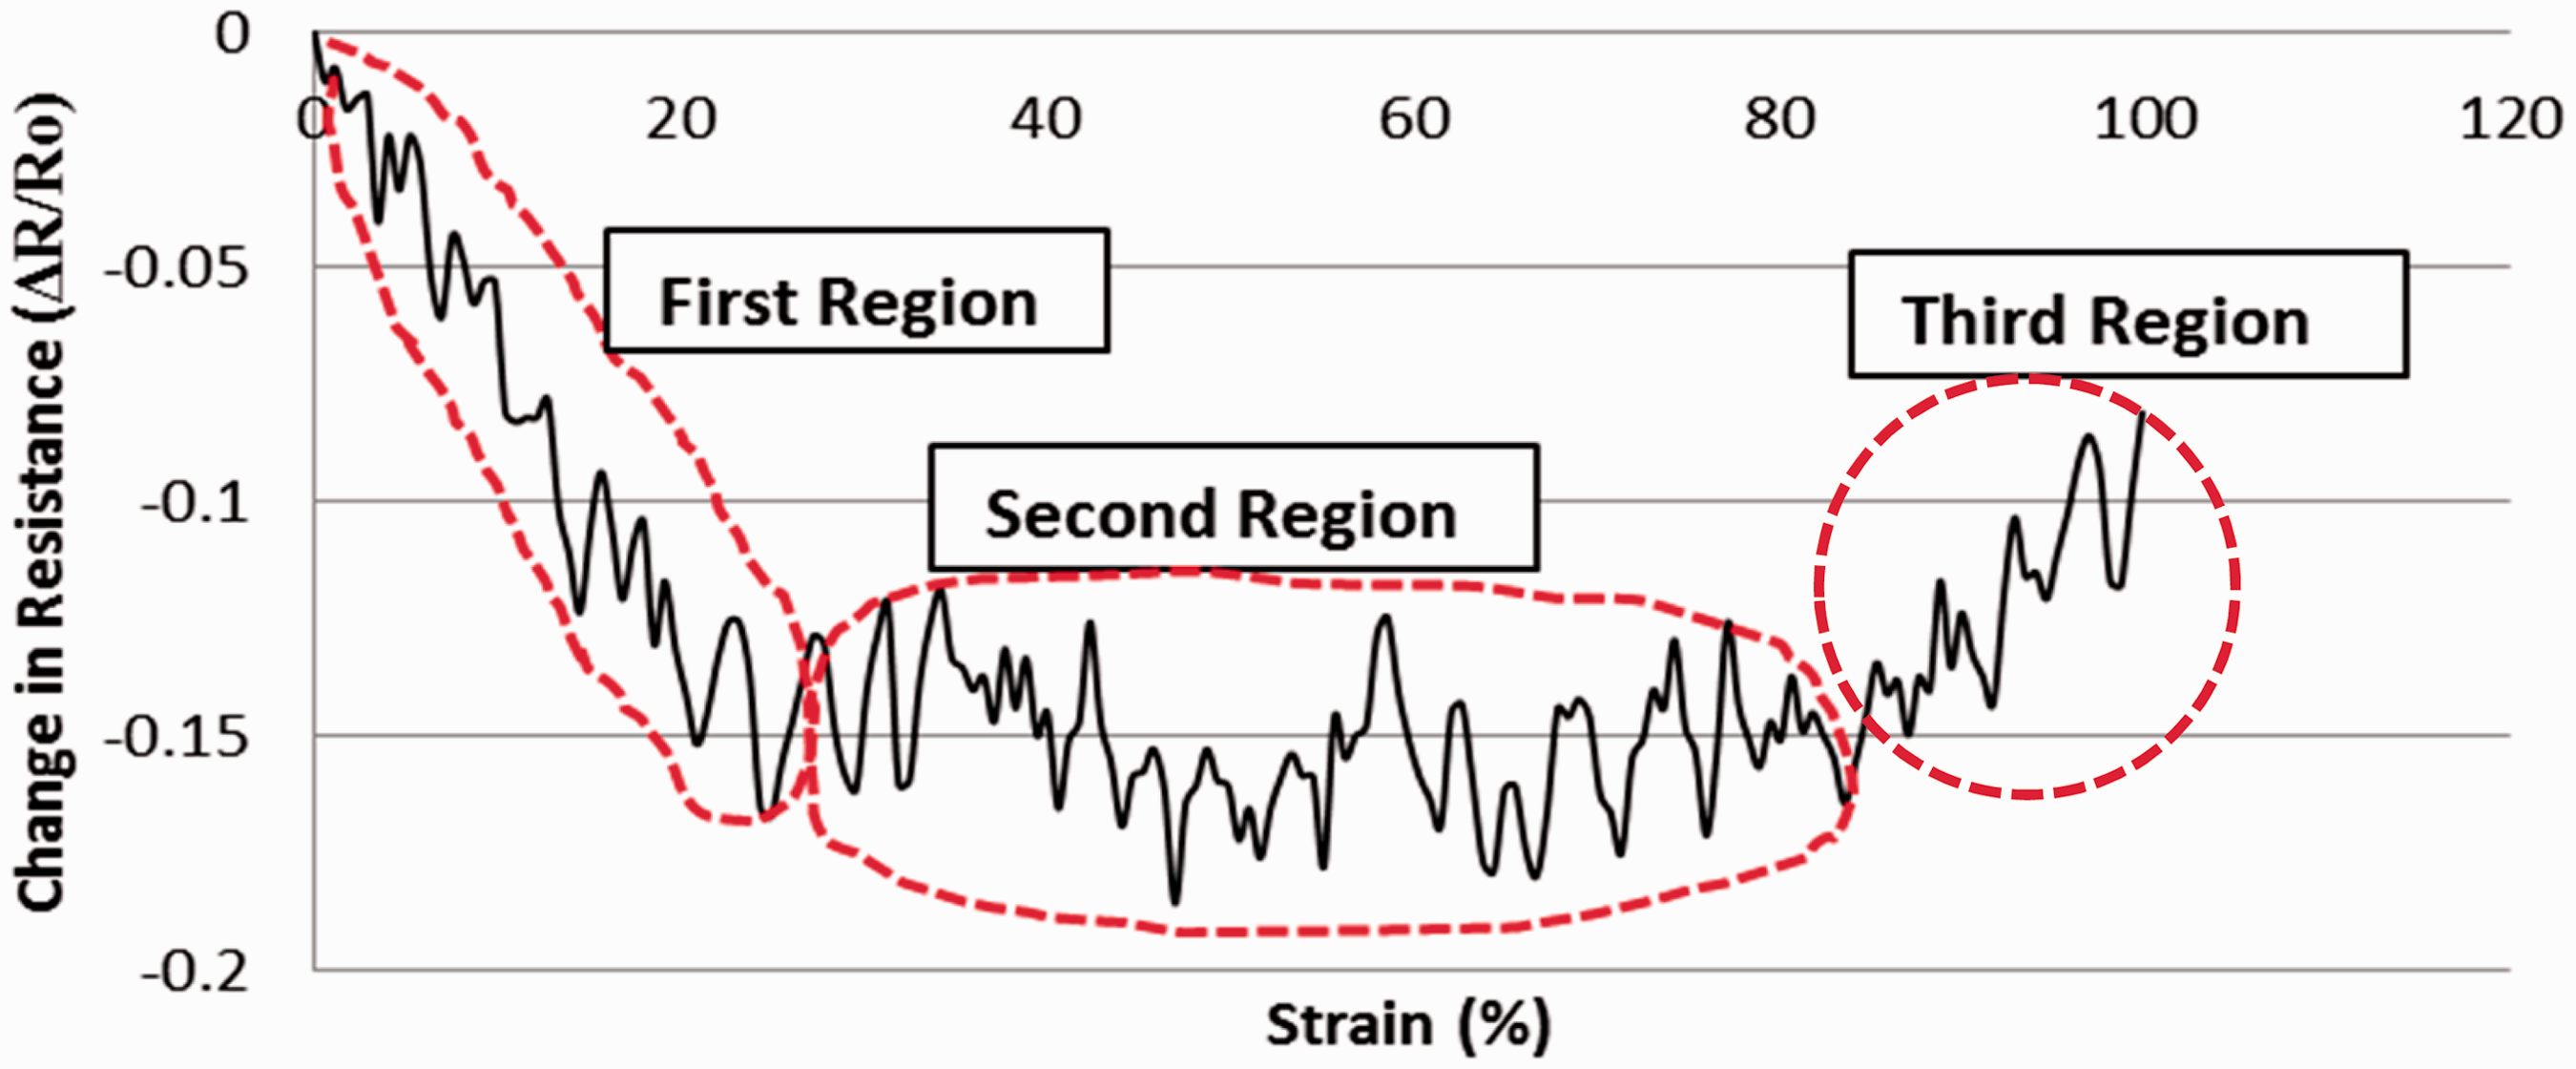
From Figure 8, it can be seen that there are three different regions for resistance–strain behaviour. This phenomenon can be explained by considering the deformation of structural properties of the fabric structure under tensile force, when the applied strain increases on the fabric structure, the contact area of the binding regions within the interloped knitted area increases. Thus, the overall electrical resistance drops due to decreasing of the contact resistance and increasing of contact pressure in the contact regions. Holm’s contact theory may help to elucidate this situation as shown in equation (6).

From Equation 6, it can be seen that the electrical resistivity and material hardness are constant for a given material, but the number of contact points and the contact pressure are variable depending on the sensor design. Thus, higher contact pressure and increased number of contact points between conductive parts lower the contact resistance. However, the enhanced electrical contact remains stable in the second region. Thereafter, the electrical resistance of the structure starts to increase due to the elongation of the conductive yarn, which is used for the creation of the sensing structure and Ohm’s law as shown in equation (7) provides information for explaining this behaviour.

Gauge factor value of plain knitted strain sensor.

In this case, the gauge factor has a negative value, which indicates a resistance drop with applied strain. Here, the R2 value refers to the quality of the fitted line and the highest value of R2 is the one that means there is a perfect linear correlation between resistance values and applied strain values. However, due to instability of the structure, the R2 values of these samples are extremely low. Figure 9 shows a single loading cycle of a knitted sensor up to 20% elongation. Although the change in resistance indicates a decreasing trend during the force loading, there are some fluctuations in resistance that make it difficult to predict the resistance values from the applied strain.
Resistance–strain of a plain knitted sensor under force loading up to the 20% strain level.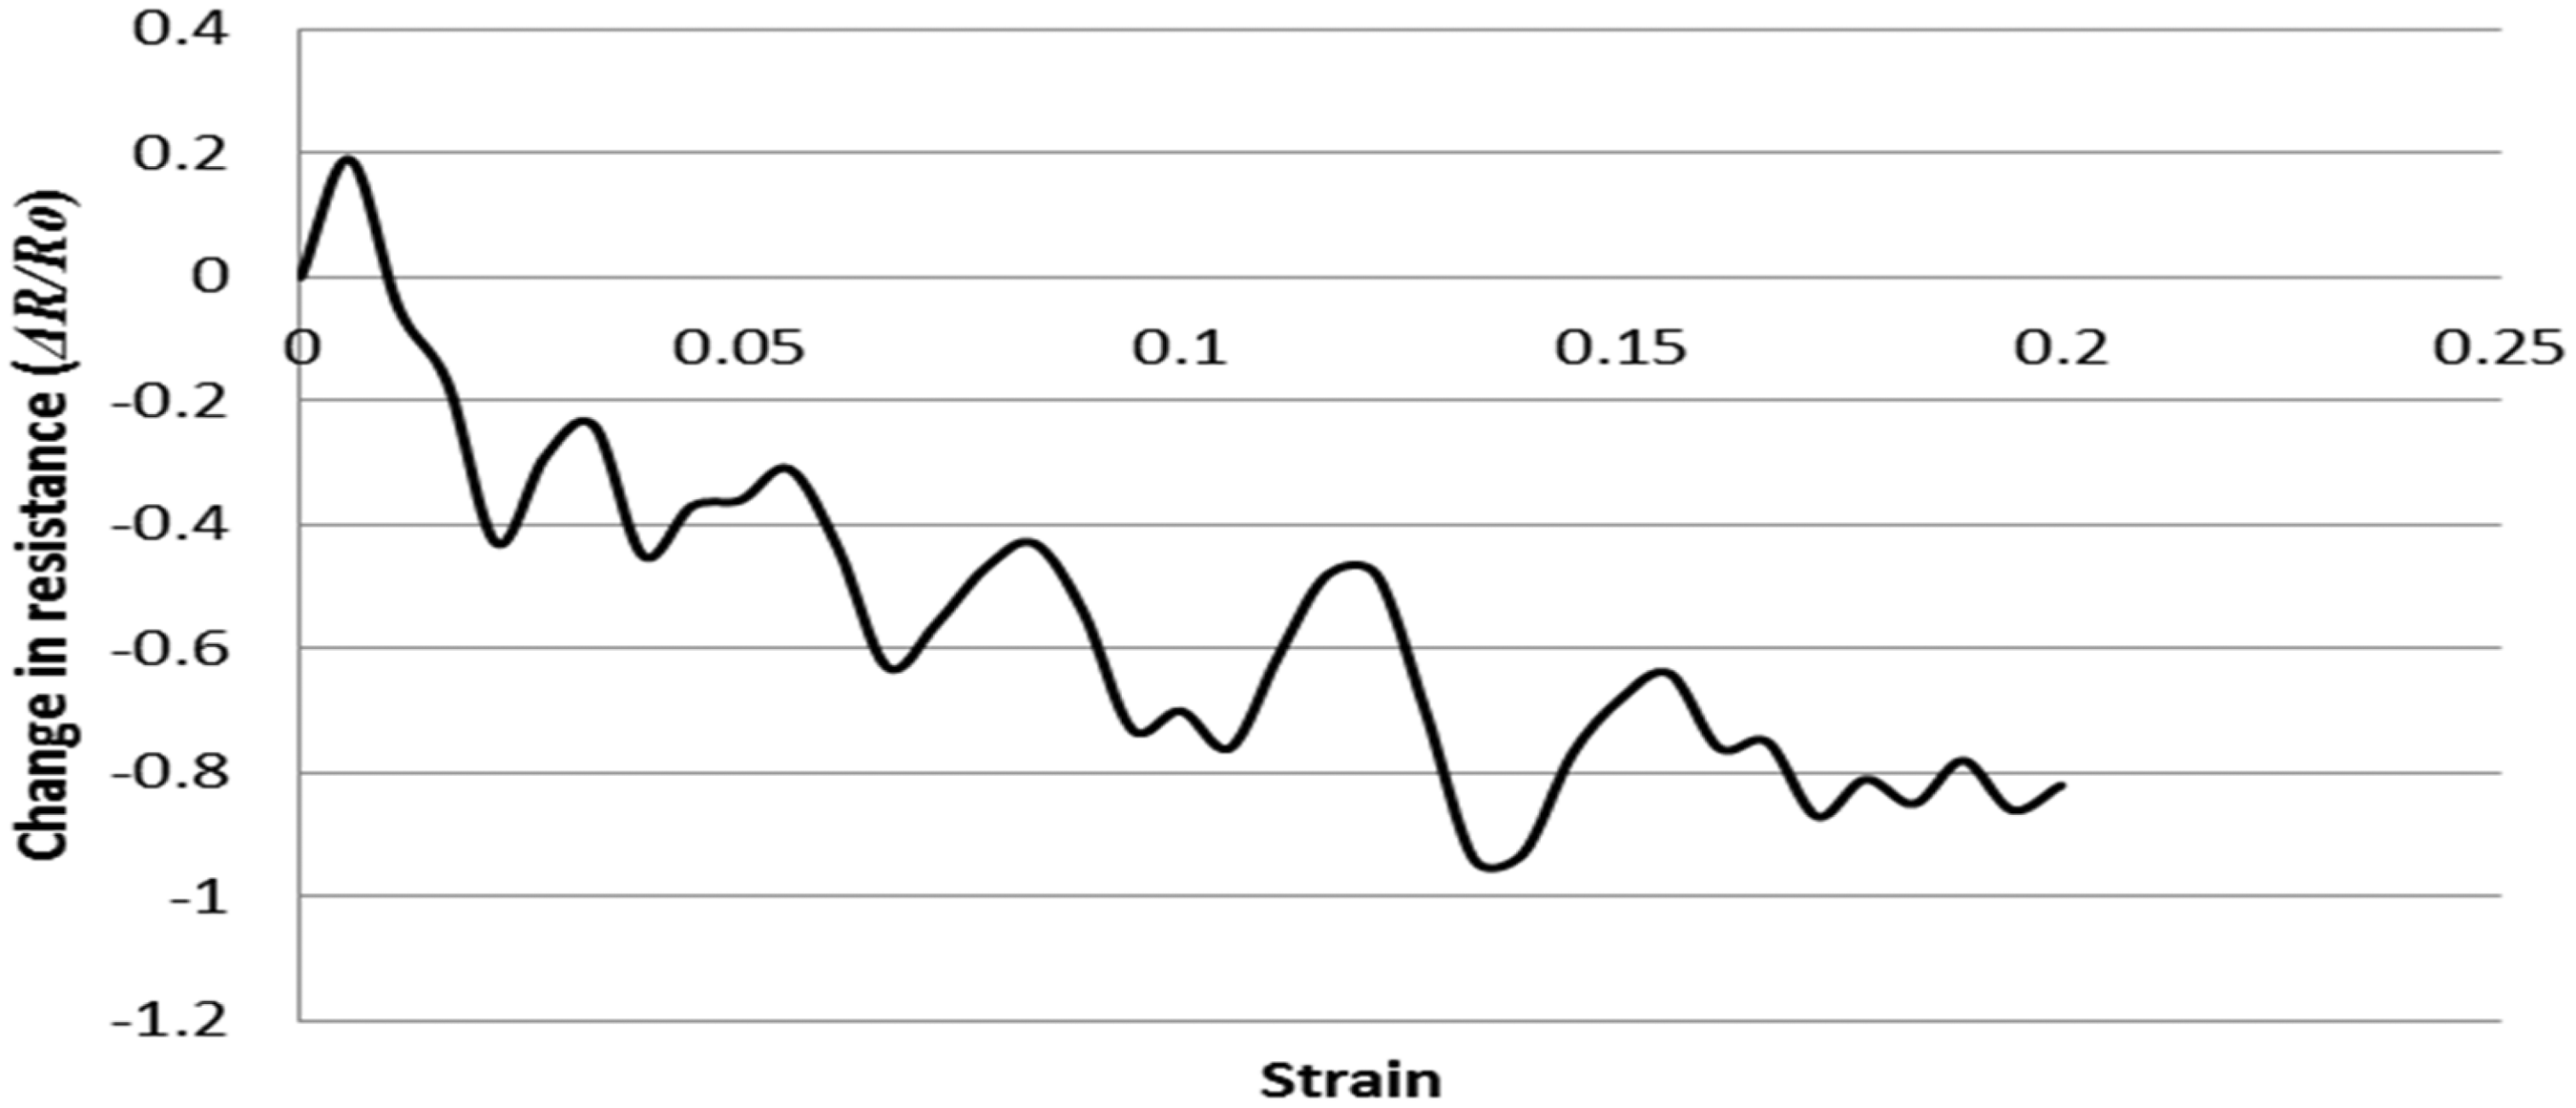
Thereafter, cyclic force loading–unloading tests were performed up to the 20% level of strain as shown in Figure 10. By observing this figure, the peak and the lowest resistance values can be obtained and consecutive cycles show a similar pattern during the test. Thus, this type of structure can be utilised when it is required that the maximum and minimum values are to be used to provide information to the user such as a breathing rate measurement.
Cyclic test results of knitted strain sensor for 20 repetitions.
Resistance–strain relationship of elastomeric plain knitted structure
Figure 11 shows the electro-mechanical tests results for an elastomeric plain knitted structure up to the 100% level of strain.
Resistance–strain relationship of an elastic plain knitted structure up to the 100% strain level.
As seen from Figure 11, there is an increasing trend for resistance change according to the applied strain unlike that of plain structures. The fabric structure of elastic plain fabric is different from plain knitted fabric. There are also overlapping areas within the elastic plain knitted structure in which the head and sinker loops also make contact with each other due to the usage of elastomeric yarn within the conductive zone. Thus, increasing level of strain separates these overlapping areas, and that causes an increase in electrical resistance values, as opposed to the mechanism shown in Figure 9 in which the binding of knitted loops causes a decrease of resistance.
In this case, the gauge factor value of the sensor was calculated up to the 40% strain level and five specimens were used to provide an average for calculations and results as presented in Table 7. As may be seen from Table 7, the gauge factor values are higher than those for the plain knitted structure, and the linearity of the sensors is lower than that of the plain knitted structure. In addition to this, the sensor’s working range is higher than that of the plain knitted structure due to its elastic structure. Figure 12 shows the single loading cycle of an elastic knitted sensor up to 40% elongation.
Single loading cycle of an elastic knitted sensor up to 40% elongation. Gauge factor value of elastic plain knitted strain sensor.

The higher gauge factor and lower linearity values of the sensor can be attributed to its structural properties and a magnified image of the sensor response in Figure 13 can elucidate this situation. Elastomeric yarn was processed with conductive yarn, which had been manufactured using a using plating technique. Thus, conductive yarn and elastomeric yarn were fed to same needle during the knitting process. However, contacts between the conductive yarns in the binding regions were reduced due to the usage of elastomeric yarn within the structure. Overlapping occurred due to the usage of elastomeric yarn in the structure. Thus, neighbouring loops created a contact between each other, though conductive loops could not make full contacts due to the interference of non-conductive elastomeric yarns in the contact regions.
Magnified images (12×) of elastic plain knitted: (a) Before stretching and (b) after stretching (20%).
The elastomeric structure also underwent cyclic testing. Figure 14 shows a graph of the cyclic test for 20 repetitions. Although the sensor has low linearity, it shows a relatively stable output between the cyclic steps that means the output has a predictable pattern for consecutive cycles.
Cyclic test result of knitted strain sensor for 20 repetitions with the strain level of 40%.
Resistance–strain relationship of interlock knitted structure
Figure 15 shows the resistance–strain relationship of the structure up to 100% elongation. The behaviour of the sensor shows a similar trend to that of the plain knitted structure. The electrical resistance of the structure initially drops, and thereafter increases.
Resistance–strain relationship of the interlock sensor up to the 100% strain level.
Gauge factor value of interlock knitted strain sensor.

Figure 16 shows cyclic test results of the sensor and it is apparent that there are instabilities within the cycles and between the cycles. This can be originated from uneven force distribution over the fabric structure. In addition to this, binding regions in the structure does not perform repeatable and uniform contacts during the force loading and unloading stage due to the deformation of the knitted structure.
Cyclic test results of a knitted strain sensor for 20 repetitions.
Resistance–strain relationship of elastic interlock knitted structure
In the case of the elastic interlock conducting knitted structure, the change in resistance with applied strain shows similar behaviour to that of an elastic plain knitted structure. Separation of the neighbouring loops is the determinative factor.
Gauge factor value of elastic interlock knitted strain sensor.

As can be derived from Figure 17, cyclic repetitions produce more uniform results than those from a normal interlock structure. Relatively, more repeatable results can be attributed to the elastic behaviour of the structure. It can also be seen from Figure 18 that there is a drift in sensor output. Plastic deformation of the knitted sample occurs at the beginning of the force loading stage, thereafter sensor structure becomes more stable. Thus, drift behaviour of the sensor decreases over the next cycles.
Resistance–strain relationship of the elastomeric interlock sensor up to the 100% strain level. Cyclic test result of elastic interlock knitted strain sensor for 20 repetitions.

Summary of the results for the sensors realised through the intermeshing of silver plated
Yarn
After the detailed experimental investigation of the conductive intermeshed structures, some important information was gained about the sensing properties of the conducting fabrics. Figures 19 and 20 provide an outline of the results in terms of the absolute gauge factor values and the linearity of the sensor through the R2 values.
Gauge factor values of the sensors. Linearity of the sensors through the R2 values.

As may be seen from Figures 19 and 20, the elastomeric content of some of the structures contributed to them exhibiting higher gauge factor values than conventional (non-elastomeric) versions of these structures and the elastic interlock structures returned the highest linearity values among the other types of conducting sensors. However, irregular outputs according to the applied strain within the same cycle make it extremely difficult to obtain a reliable resistance–strain relationship pattern. Thus, practical usage of the sensors is extremely restricted. However, the electrical resistance values of the knitted sensors are relatively low, as shown in Figure 21, due to the construction of the intermeshed structures.
Average electrical resistance values of the knitted sensors.
Thus, this property creates reliability concerns in terms of measurement accuracy. Therefore, if these sensors are intended to be used for real-time applications, energy usage may also be problem. Equation (9) helps to explain this situation.
It can be clearly seen from equation (9) that relatively low resistance will cause higher levels of power consumption, which is an undesirable property for portable textile-based sensing systems.
Resistance–strain relationship of the sensors realised through the intermeshing of polyester-blended yarn with stainless steel fibres
Figure 22 shows the electro-mechanical test results of plain knitted structures up to the 100% strain level. As seen from Figure 22, the resistance of the sensor decreases until a point close to the 40% strain level and thereafter it remains stable up to 100% strain.
Electrical resistance–strain relationship of plain knitted sensors up to the 100% strain level.
This behaviour originates from the fabric structure itself and from the yarn composition. Figure 23 presents images of polyester-blended stainless steel yarn, initially in the relaxed condition and then under tensile strain. However, as seen from Figure 22, there is a spike around the strain level of 20% due to some discontinuity on the electrical conductivity during the elongation. Polyester fibres may have created barriers between conductive fibres at this point of strain.
Magnified images of polyester-blended stainless steel yarn (380× magnifications): (a) Before extension and (b) after extension (10% strain).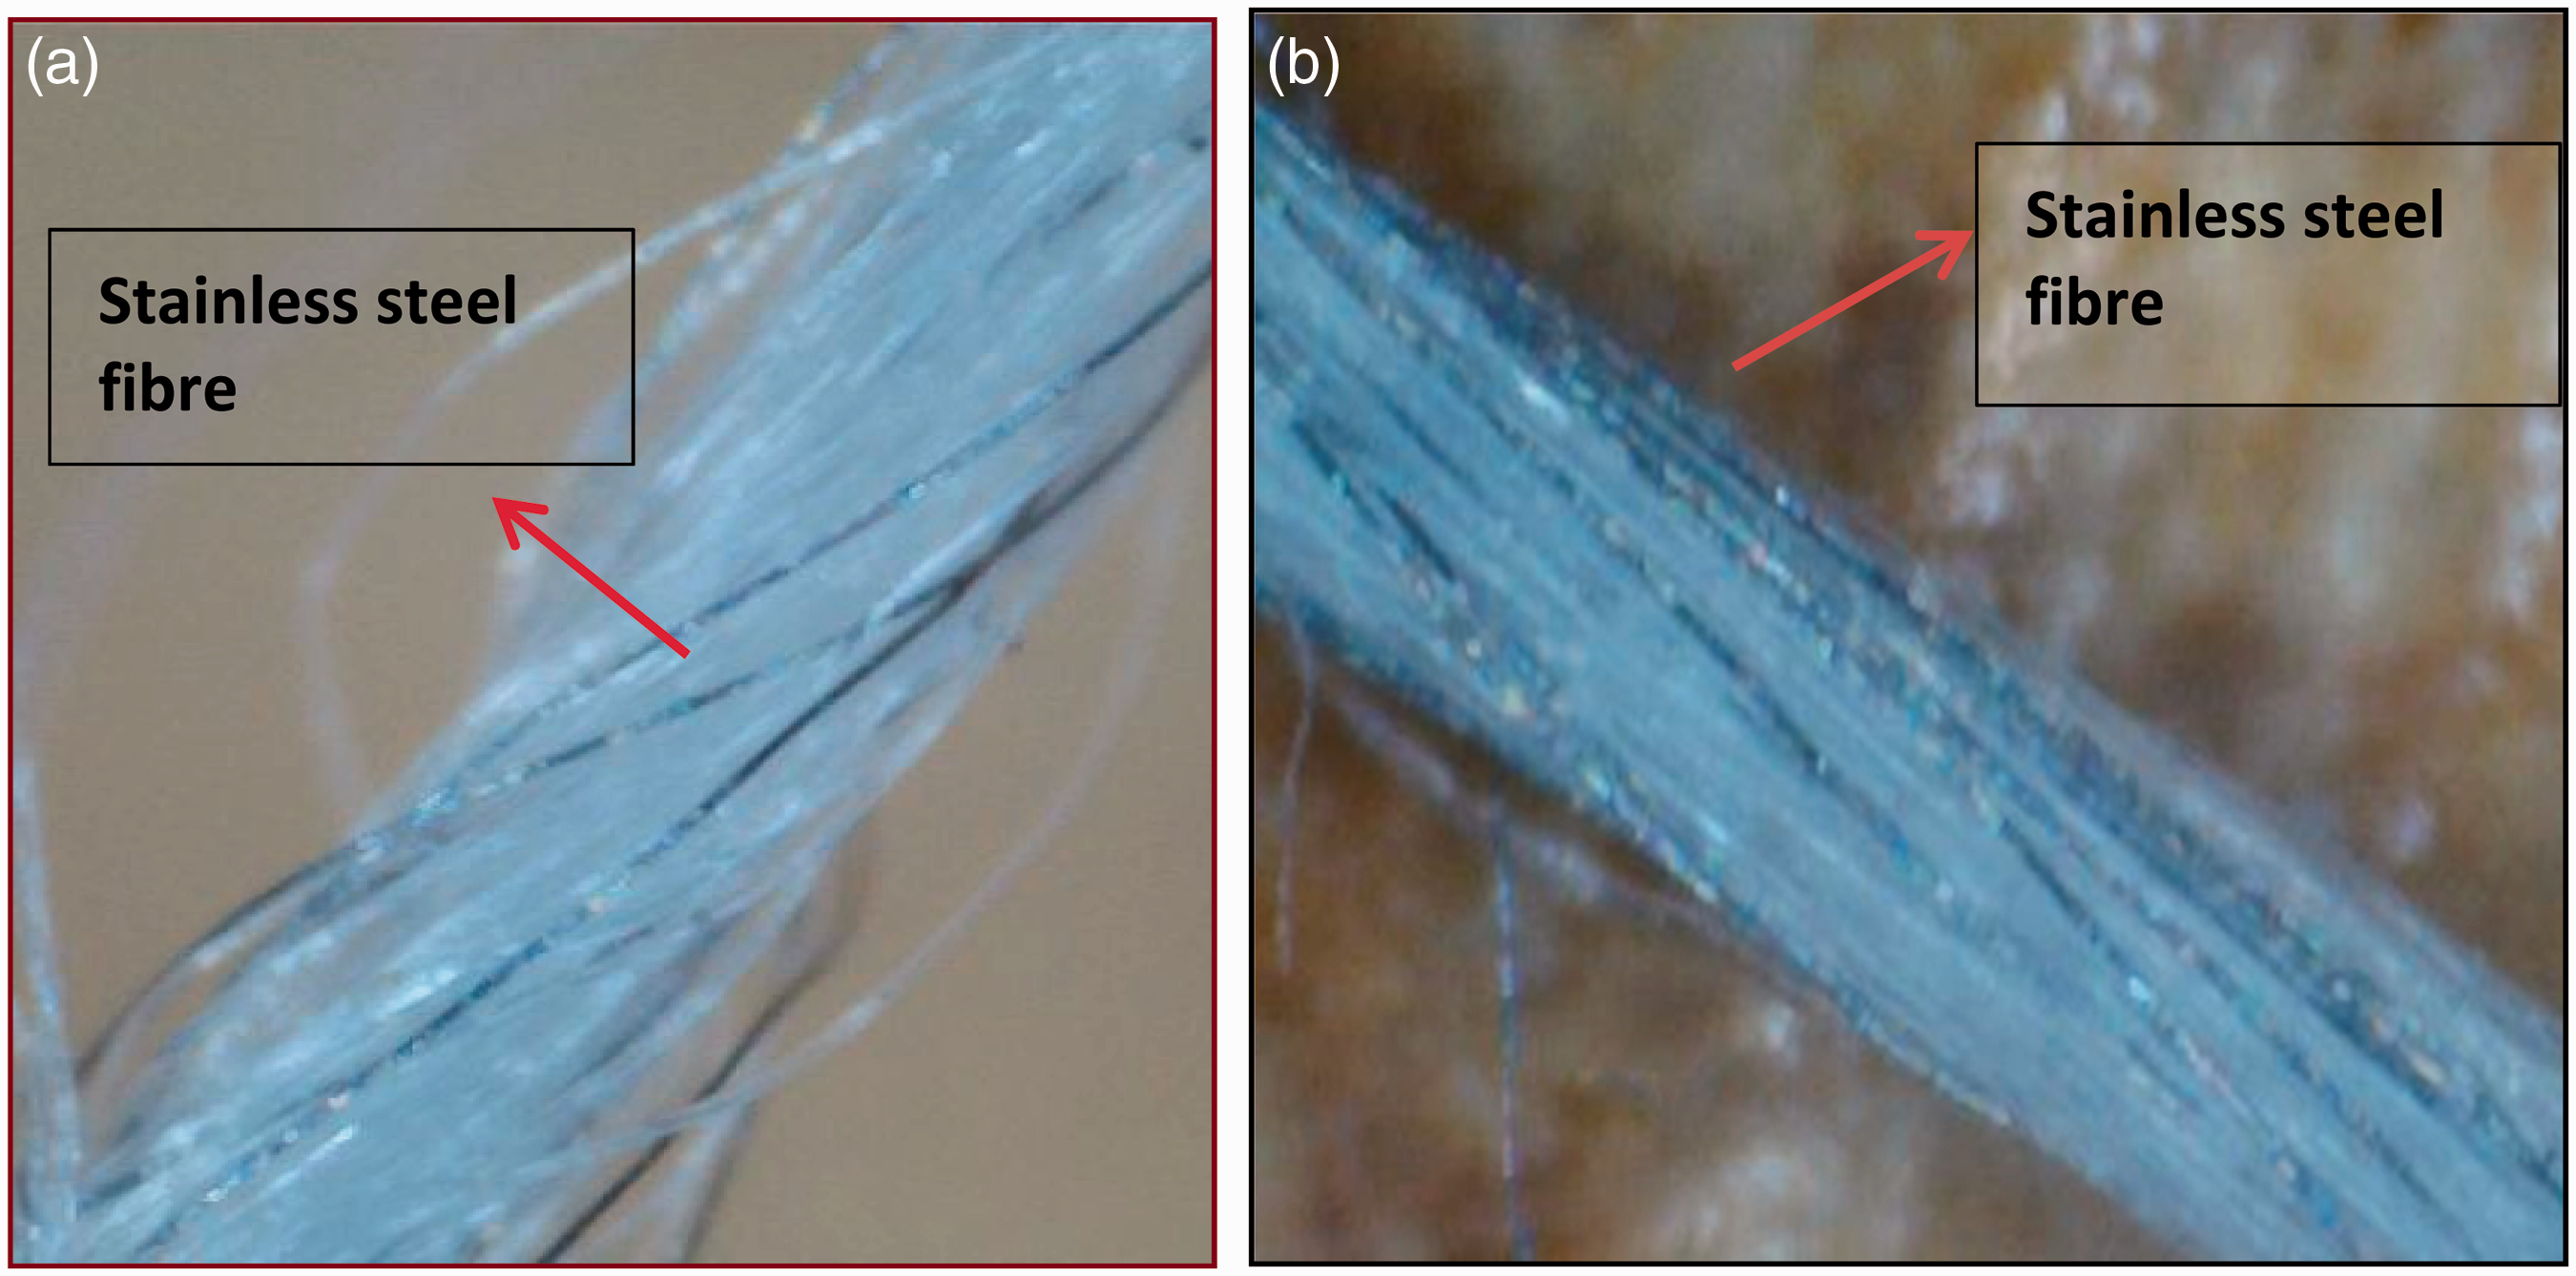
As seen from Figure 23, stainless steel fibres within the polyester yarn are positioned away from each other in the relaxed condition. However, when the yarn is elongated, conductive fibres within the structure are driven closer to each other due to the reduced yarn diameter. Thus, when the yarn is stretched, conductive fibres create enhanced contact with each other, which cause a decrease in the electrical resistance values. Another contribution to the resistance decreasing is enhanced contact on the loop binding regions during uniaxial tensile extension.
As may be seen from Figure 24, there are significant variations in the electrical resistance values during cyclic testing. The sensor output is unpredictable for consecutive cycles. The yarn composition makes an important contribution to this behaviour and Table 10 helps to elucidate this characteristic.
Cyclic test results of the sensor for 20 repetitions. Average electrical resistance values of conductive yarn for 10 cm lengths.

It is clearly shown in Table 10 that there is a significant variation in electrical conductivity for the selected yarn due to irregular orientation of the stainless steel fibres within the structure. When the number of stainless fibres within the yarn structure that cross or touch each other is changed, electrical resistance value of the yarn varies. This undesirable characteristic of the yarn causes unwanted variations of the electrical resistance.
The sensor was also constructed using elastomeric yarn within the conductive zone of the knitted structure and Figure 25 shows the cyclic test results of the sensor for 20 repetitions up to a strain level of 20%.
Cyclic test for elastic sensor for 20 repetitions.
It was not possible to establish gauge factor values for knitted samples due to the increased level of variations among the samples and within the sample. It is clearly shown that the structure gives a response according to the applied strain but the output is unpredictable. Thus, the knitted sample may not be utilised as a strain sensor. Also, Figure 26 presents cyclic test results for interlock knitted structure. The same deficiencies are observed for interlock structures as well.
Cyclic test results for interlock structures for 20 repetitions.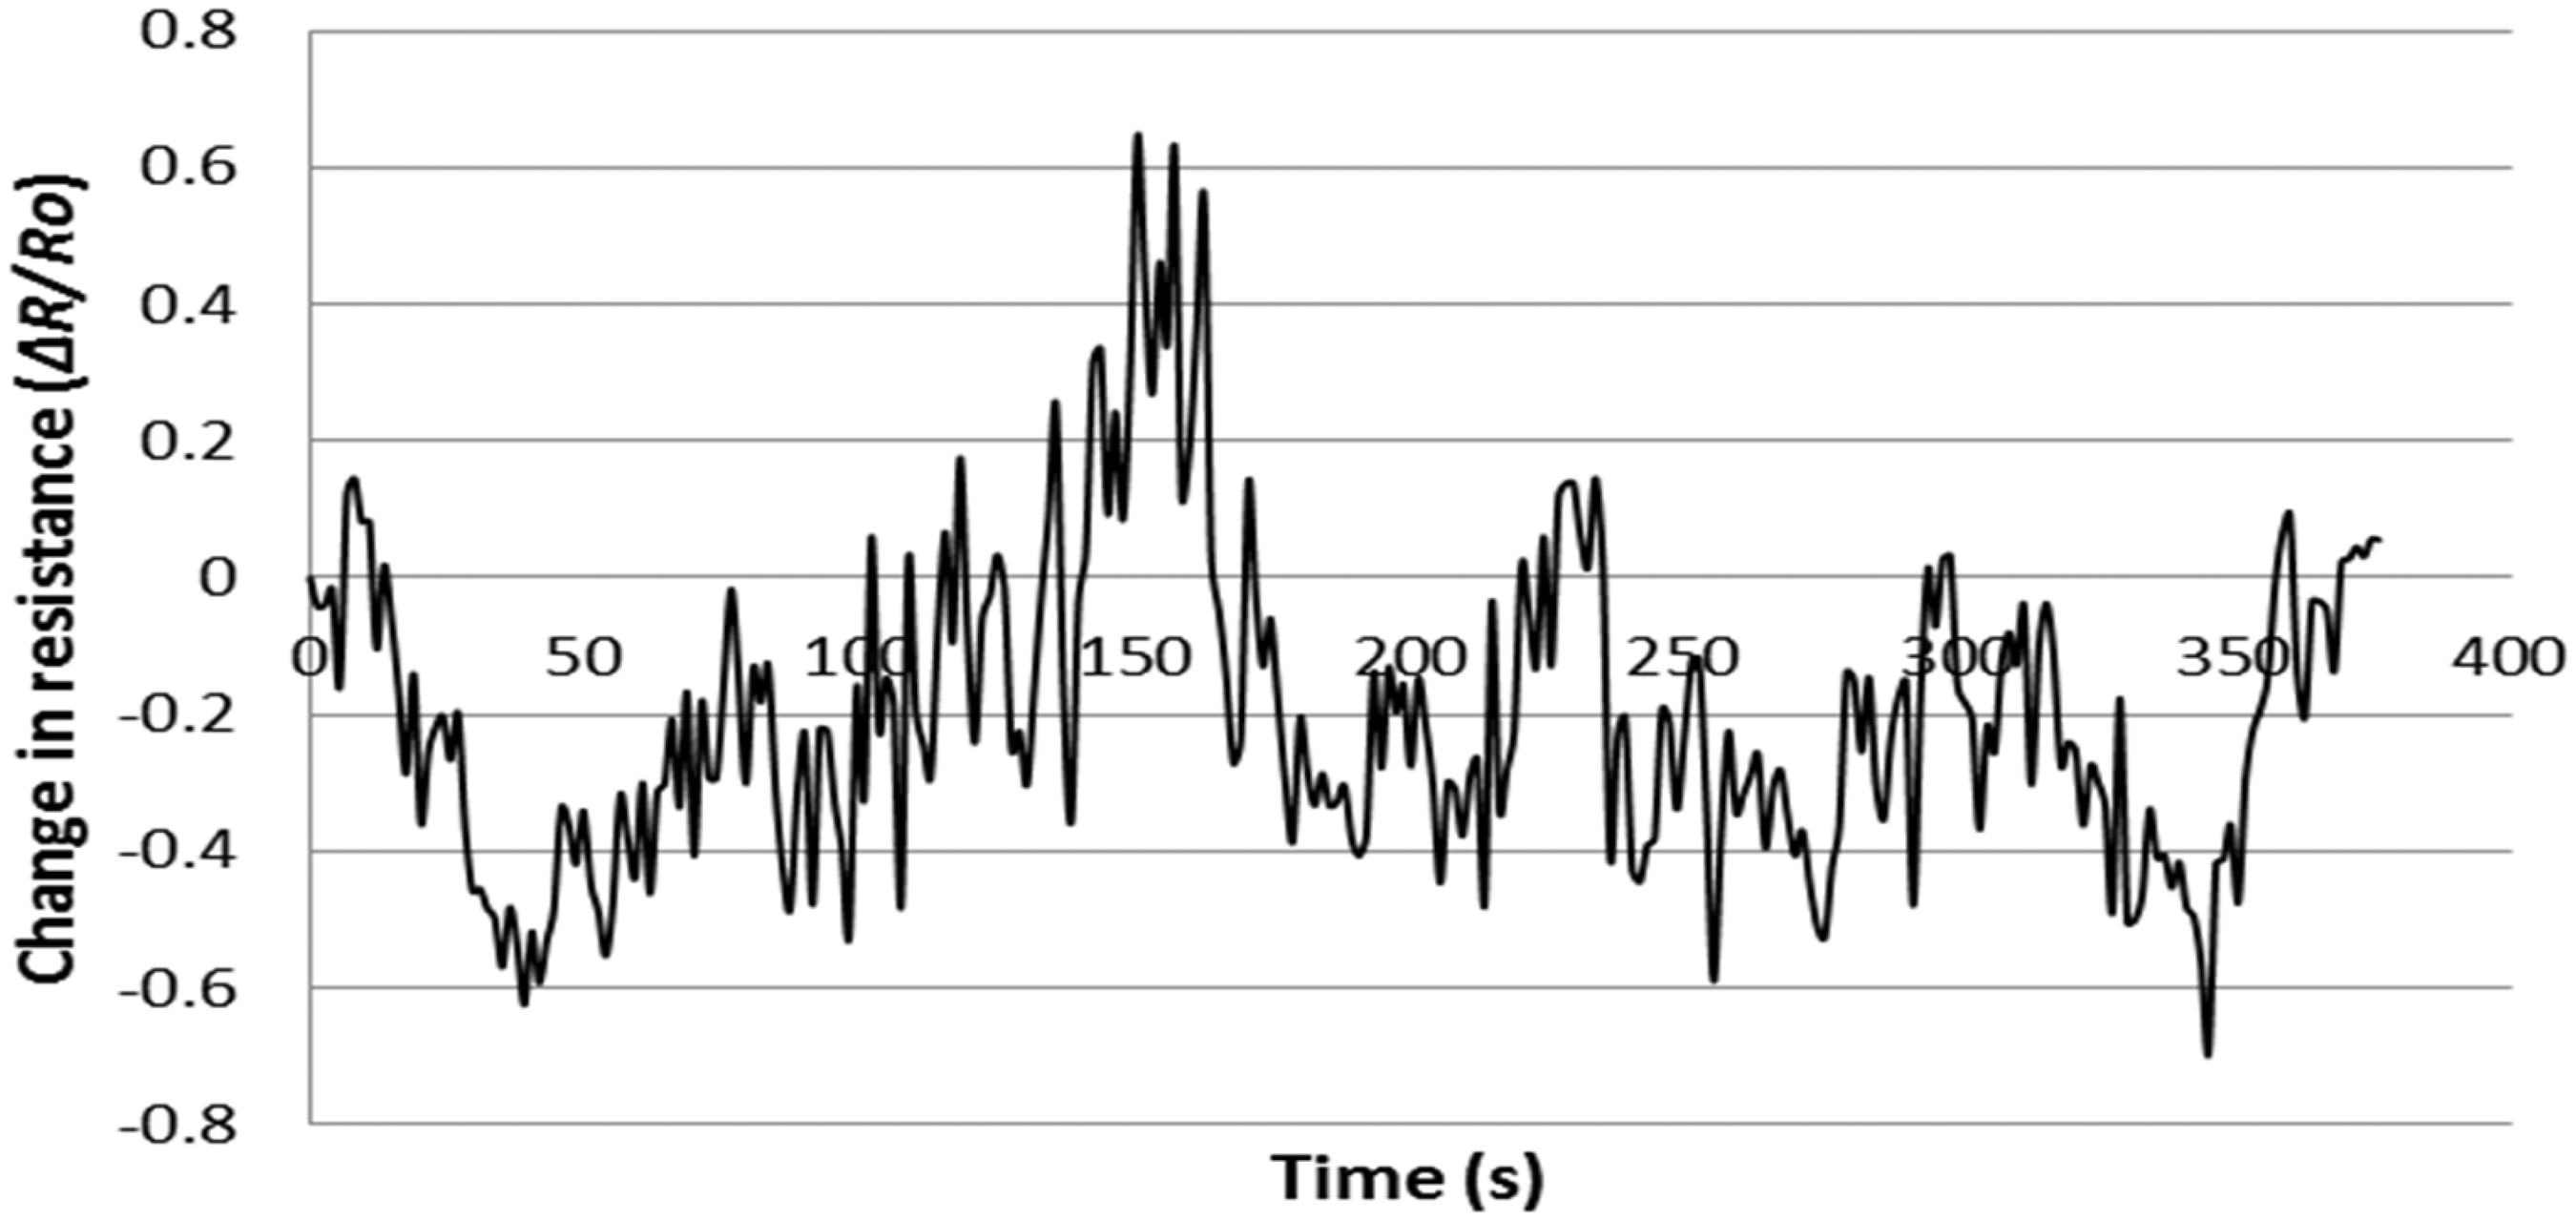
Resistance–strain relationship of the sensors realised through the series of single conductive course
Resistance–strain relationship of the elastic plain knitted sensors realised through the series of single conductive course
Figure 27 shows the electrical response of the sensor up to the 120% level of strain during electro-mechanical testing.
Change in electrical resistance up to 120% level of strain.
As shown in Figure 27, knitted sensors are able to measure change in resistance up to the 60% level of strain, followed shortly thereafter by saturated region in which electrical resistance of the sensor remains stable. It can also be seen from Figure 27 that, during the experiment, applied level of strain stretches the fabric to its elastic recovery limit and buckling is apparent in the knitted sensor when the strain is released. Thus, recovery takes an extended period of time. When force loading is applied to a buckled sample, the knitted sensor is pulled flat and this causes the touching points of the conductive knitted loops to make enhanced conductive contact with each other so there is a slight decrease in resistance in the early stage of straining a distorted sample. Figure 28 presents cyclic test results of the sensor for 20 repetitions.
Cyclic test results of the sensor.
As clearly seen from Figure 28, the sensor is prone to drift during cyclic testing. Each consecutive cycle produce a different peak and trough of electrical resistance values. Gradual drift in electrical resistance occurs due to the structural properties of the knitted sensor. The sensor’s base fabric is constructed in a plain knit arrangement and deformation within the fabric structure causes drift in the sensor’s response. However, the sensor consists of two layer of fabric. Whereas the first layer of fabric is made of non-conductive yarn, the second layer of fabric is made of conductive yarns and there is a gap between the first and second layers of fabric, which may create dimensional instabilities during the tensile test. Thus, this instability can create unstable electrical responses.
Resistance–strain relationship of the proposed sensor realised through a series of single conductive courses within the interlock base fabric structure
A proposed new design of sensor has been developed for this research due to following reasons:
The electrical resistance values of the intermeshed structure – both elastic and normal – are very low. Thus, they are more prone to measurement errors. Their power consumption is too high for practical applications. An electrical resistance change for inelastic structures is due to contacts in the binding regions and is the consequence of yarn elongation at higher strain levels. Thus, repeatable tensile force creates deformation and instability in the binding regions, which creates instability of electrical resistance values. For elastic intermeshed structures, change in resistance values mainly stems from separation of overlapped yarns. However, non-conductive yarn within the conductive zone creates irregular contact areas where the yarns touch and this degrades the sensor output. Usage of blended yarns with conductive fibres resulted in unpredictable electrical resistance values during the experimental tests. When the sensors are intended for human body monitoring applications, conductive zones should not touch the skin because the intrinsic conductivity of the human body will interfere with the electrical signal. Thus, sensing fabrics should be created in such a way as to prevent contact between the conductive zones and the human body. In one approach, tubular fabrics can be created to prevent touching of the conductive zone and the human body. However, experimental results proved that this type of structure was prone to electrical drift during cyclic testing.
One of the aims for this research was to design a knitted strain-sensing structure, which provides solutions to the above-mentioned problems. Thus, a knitted strain-sensing fabric has been designed as shown in Figure 29.
Schematic diagram of sensor design showing the geometry of the conductive yarn.
Elastomeric yarns have been used to create interlock-based structures, because the interlock construction has the highest dimensional stability among the basic weft-knitted structures. Thus, this characteristic enables the creation of more reliable sensors in terms of repeatability. Silver-coated polymeric yarn was used as a sensing element and this was knitted over the interlock base structure as a series of single loops of the fabric, which were arranged to help reduce the conductive yarn structural deformation during long-term force loading. As may be seen from Figure 29, due to the usage of elastomeric yarn in the structure, conductive yarn loops make contact with adjacent loops at their heads and limbs also at their sinker loops, which are pressed together. In addition to this, conductive loops are located within the interlock structure in the form of a zigzag arrangement in which they are alternately located in a higher or lower position relative to each other. This is due to the modification of the conductive plain loops, which are used in the interlock structure. This feature improves the contact area significantly and enables the sensor to measure up to high strain levels. Hence, this type of sensor derives predominantly from practical knitting experience. These are functions of the design of the knitted sensor and are enhanced by the incorporation of elastomeric yarn and through use of the interlock structure.
Initial experimental results for proposed sensor
The sensor was stretched up to its electrical response saturation point and Figure 30 shows a graph of the experimental results.
Change in electrical resistance up to the saturated region.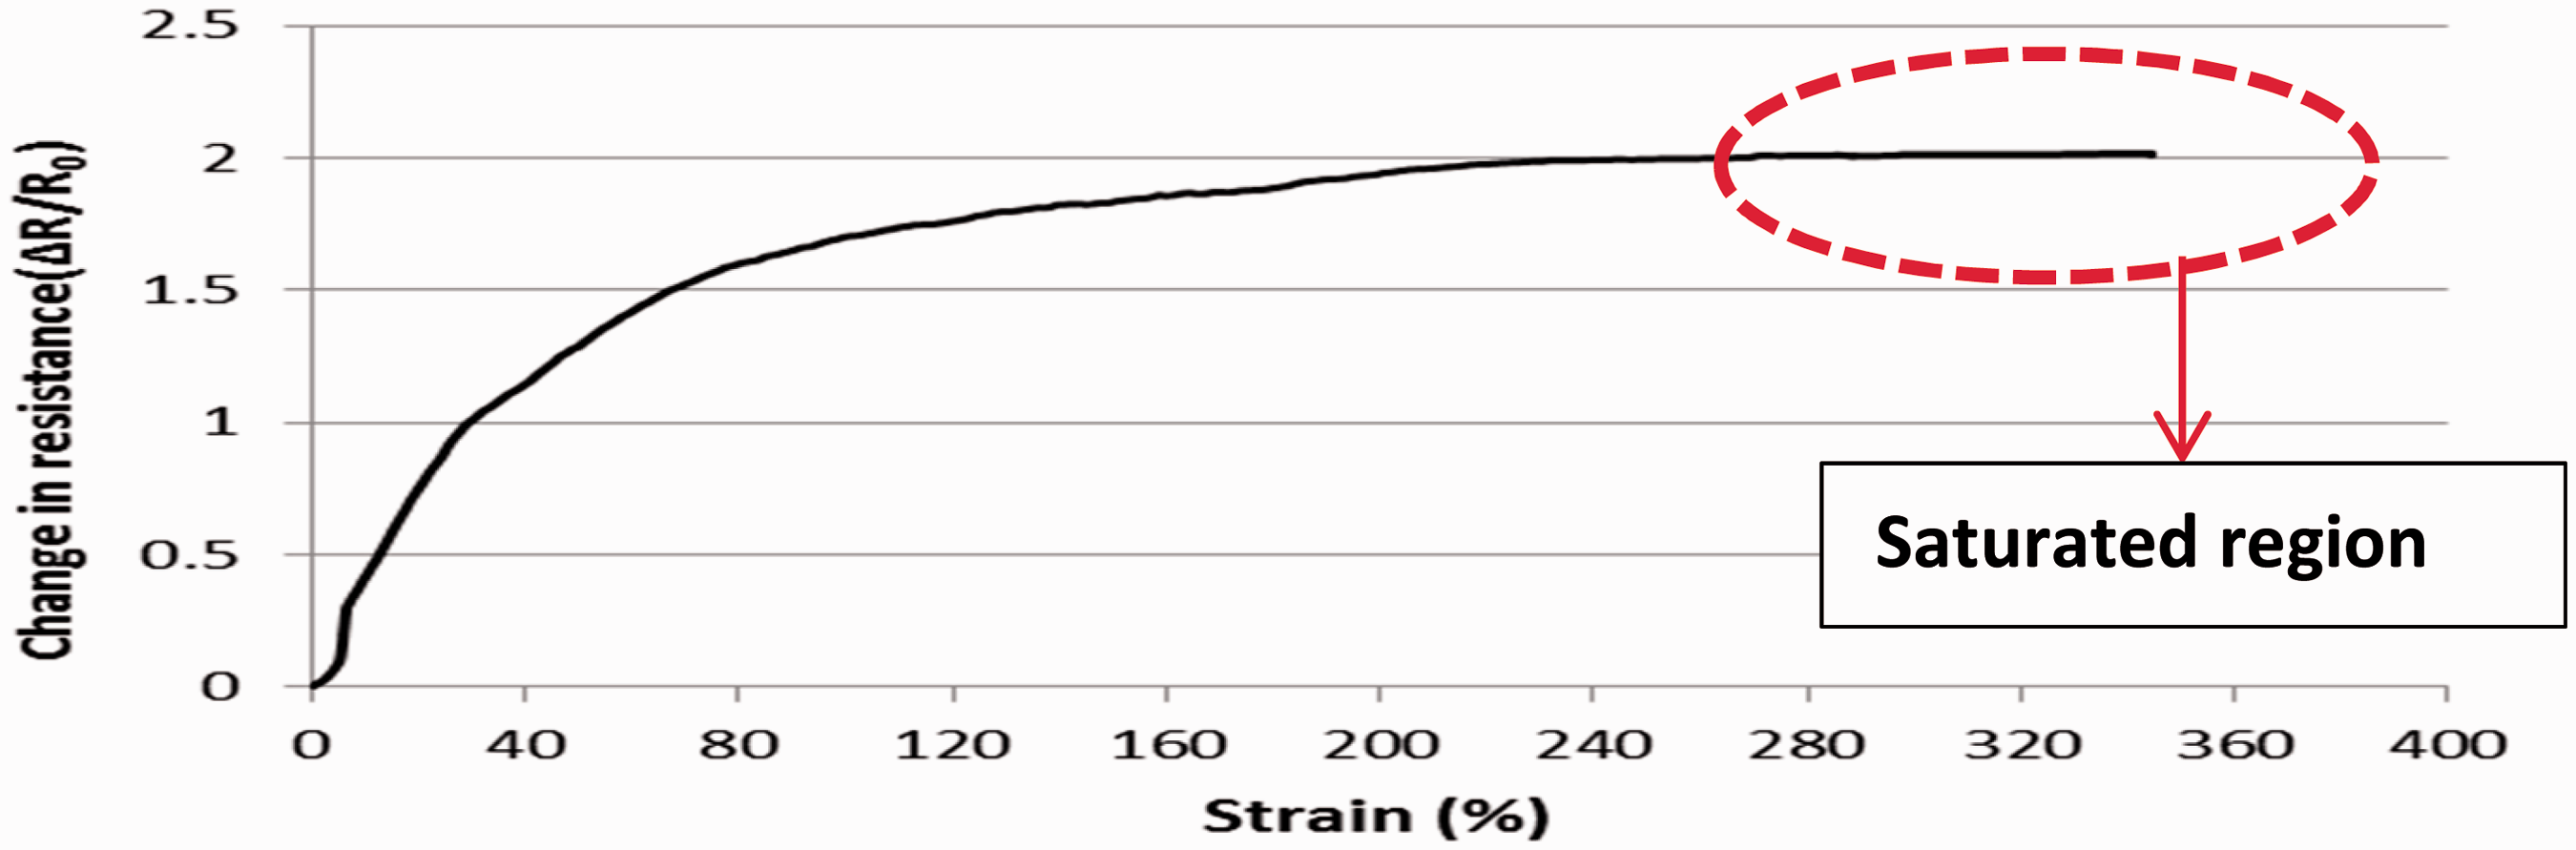
As seen in Figure 30, the sensor is able to give an electrical response up to the 240% level of strain due to the structural properties of the sensing fabric. Figure 31 shows the electrical response of the sensor under cyclic forces. As seen from Figure 31, strain-sensing structure gave repeatable output between the cyclic force loading. Also, it is obvious from Figure 31 that drift between the cycles has significantly reduced.
Cyclic test results for proposed sensor.
Conclusion
Knitted strain-sensing fabrics have been manufactured using different production methods. Intermeshing of conductive yarn was the first approach for the creation of knitted sensors. Sensors were produced either using elastomeric yarn or polyester yarn. Silver-plated yarn and polyester-blended stainless steel yarn were chosen as conductive materials. First, it was found that the electrical resistance values of the plain and interlock sensors produced by silver-plated yarn are relatively low, i.e. <12 Ω due to enhanced conductive contacts within intermeshed structures. This also applies to elastomeric type of these structures. Low resistance values creates reliability problem as well as higher power consumption. Another problems were identified with these structures are low gauge values and low linearity values. However, usage of elastomeric yarn within the knitted structure increased dimensional stability, thus more reliable results have been obtained compared with non-elastomeric structures. Sensors realised through the intermeshing of polyester-blended yarn with stainless steel fibres gave completely unpredictable results. It was even not possible to calculate gauge factor values for knitted samples due to the increased level of variations among the samples and within the sample. Thus, it was concluded that intermeshed structure were not found suitable candidates for strain-sensing applications and detailed information were given about the reasons behind the proposed sensor development.
Thereafter, strain-sensing fabrics were manufactured using a second approach. In this method, conductive yarn (silver-plated nylon yarn) was knitted as a series of single courses within elastomeric structures. However, the plain knitted structure experienced electrical drift problems during cyclic tests. Thus, the proposed sensor design has been created to solve deficiencies found with previous types of knitted strain-sensing structure. It is proved that the proposed sensor gave uniform cyclic patterns over the experimental tests and it offers a good solution to the problem of drift that is seen in previous approaches.
Overall, this article has provided a deep insight into different knitted sensor types and a proposed new sensor has been developed to address the possible problems of the strain sensors during the practical application. Proposed sensor could be used for gait analysis and/or respiration monitoring for future applications.
Footnotes
Declaration of Conflicting Interests
The author(s) declared no potential conflicts of interest with respect to the research, authorship, and/or publication of this article.
Funding
The author(s) received no financial support for the research, authorship, and/or publication of this article.