
Abstract
The shear behavior of 3D spacer knitted fabrics was investigated by using a picture frame fixture. Three different methods were used to find the shear angle during loading rate of 10 mm/min. All the tests were recorded by a CCD monochrome camera. The images acquired during loading process were used for analysis in order to obtain the full-field displacement and shear angles at chosen points on the surface of test specimen. An experimental and analytical investigation of picture frame shear fixture was conducted to determine its suitability for measuring intra-ply shear properties of 3D knitted spacer fabrics. In this work, a fixture was designed to analyze the in-plane shear behavior of these fabrics. The nonlinear behavior of shear force versus shear angle and the deformation mechanism were analyzed. The curves for shear force versus shear angle and position of buckling for in-plane shear test are recorded by considering two different frame lengths in order to compare with each other. Load–displacement curves of intra-ply shear tests are also analyzed. In addition to this, a program was developed in MATLAB using Hough transform to analyze the shear angle in the real-time image taken during displacement of specimen at various positions. The results of image analysis were compared with the actual experimental results. These findings are important requirements for further improvements in designing of picture frame fixture and to study the in-plane shear properties of 3D fabrics.
Keywords
Introduction
The shearing behavior of a fabric determines its performance properties when subjected to a wide variety of complex deformations during its use. The ability of a fabric to be deformed by shearing distinguishes it from other thin sheet materials such as paper or plastic films. This property enables fabric to undergo complex deformations and to conform to the shape of the body. Shear properties influence draping, flexibility and also the handle of fabric. Shear properties are important not only for standard fabrics but for textile reinforced composites preforming as well. Automated manufacturing of textile composite shell-like products typically requires draping of dry or pre-impregnated textile sheets. Large local deformations occur in the textile sheet in order to adapt to the curved shape [1–3].
These deformations affect the local fiber directions, volume fractions and thickness. Several factors together with the consolidation level and the occurrence of flaws (e.g. wrinkling and tearing) determine the product quality. Simulation tools that link product quality to material, mold and process parameters are being developed to support design and process optimization [4,5].
The prediction of local deformations is an essential task within this objective. Although the composites have excellent in-plane mechanical properties, the application range of laminated composites is limited by the through-thickness failure due to the poor interlaminar properties. Three-dimensional (3D) textile structural composites provide excellent strength through thickness, outstanding damage tolerance and good impact and fatigue resistance [6]. As one type of the 3D textile structural reinforcements for composites, the 3D spacer fabric has been widely used in engineering field owing to its easy and efficient processing in warp and weft knitting. In addition, the most attractive advantage of spacer fabric is the 3D shape-forming capacity to manufacture composites. The 3D spacer fabric preforms have excellent mechanical properties and good formability. With the development of the preforming technology, complex shapes and different sizes of the structural parts can be produced. In the structure integrated manufacture of composites, the 3D spacer fabric is preformed according to the shape of the final composite that can be complex [7]. The in-plane behavior and the inter-laminar behavior are the most important deformations in 3D fabrics, and also shear behavior predominates the deformation mode of the material [8].
It is necessary to study the inter/intra-ply shear behavior of 3D fabric because of their wide application in production especially in the case of forming process. The in-plane shear behavior of 2D fabric has been comparatively well investigated. Zhu et al. [9] carefully investigated the in-plane shear characterization of 2D fabric by experimental test and found that the reduction of yarn was a key to wrinkling. Ye et al. [10] studied the shear property of 2D fabrics using picture-frame test method, and pointed out that the shear results were sensitive to the tensions in the yarns during the experiment. The tensile force increased with the increase in shear angle. Willems et al. [11] presented shear tests of unbalanced 2/2 twill glass/PP fabric on picture frame in three different pretension states and studied the influence of tensile load in the yarn direction on the shear resistance for the fabric and the repeatability of the test method.
Lin et al. [12] established the finite element model based on the geometry of 2D fabric to simulate the in-plane shear deformation; the simulation results were identical with experiments. Cao et al. [13] compared the picture frame shear test results from seven different labs for developing a standard test setup and obtaining accurate and appropriate material properties. Chen et al. [14] developed an FEM model to predict in-plane and interlaminar shear properties of laminates. However, the in-plane shear behavior of 3D spacer fabric was rarely reported. Charmetant et al. [15] built a hyperelastic model to simulate the formability of 3D fabric.
In this work, a picture frame shear fixture was developed and a careful study was made on its applicability in testing the in-plane shear behavior of 3D spacer fabrics with different fabric density, thickness and structure. The shear force versus shear angle curves and position of wrinkles during in-plane shear test are recorded by considering two different frame lengths in order to compare with each other and load–displacement curves of inter-ply shear test were also analyzed. In addition, suitable program was developed in MATLAB using Hough transform to analyze the shear angle during deformations. The results of image analysis were compared with the actual experimental data. It can provide the foundation for investigating the performance of picture frame to study formability and theoretical analysis of in-plane shear in 3D spacer fabrics.
Methodology
Materials
In the present study, six different types of spacer fabrics were developed using computerized Mayer & Cie, OVJA 1.6 E 3 WT knitting machine with five feeders and 14 gauge. The first and second feeders were fed with spacer yarn, third and fourth for technical face side and fifth feeder for technical back. The run-in length of spacer yarn is 1600 mm/rack, for technical face yarn is 1250 mm/rack and for technical back yarn is 1250 mm/rack. Run-in ratio is 0.78. The structure and knit pattern of these samples are given in Figure 1.
Structure and knit pattern of knitted spacer fabric.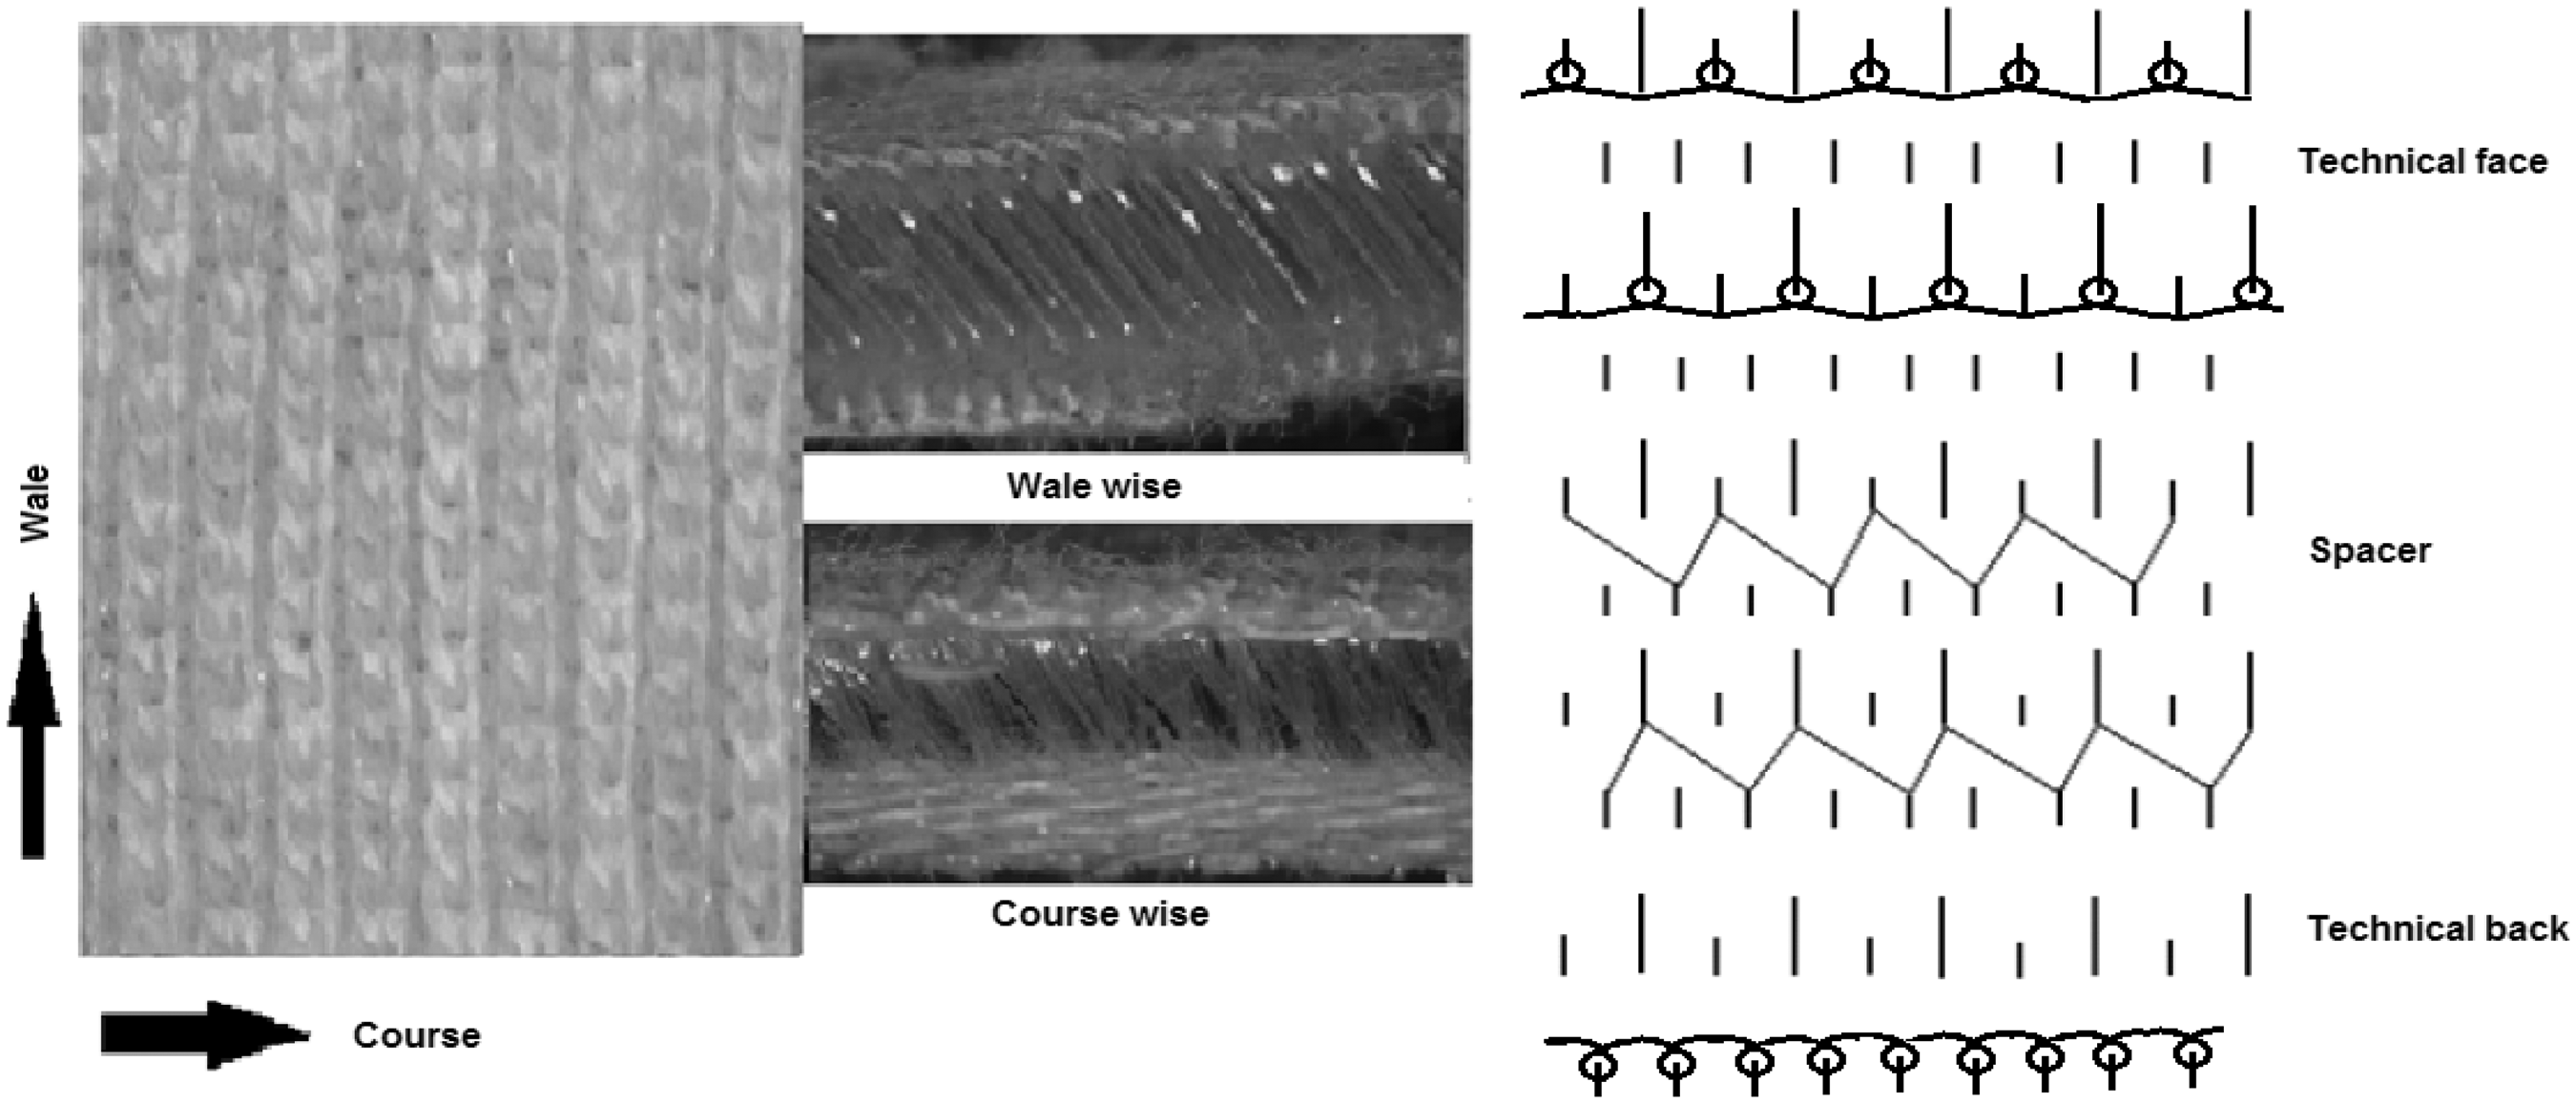

Fabric particulars.
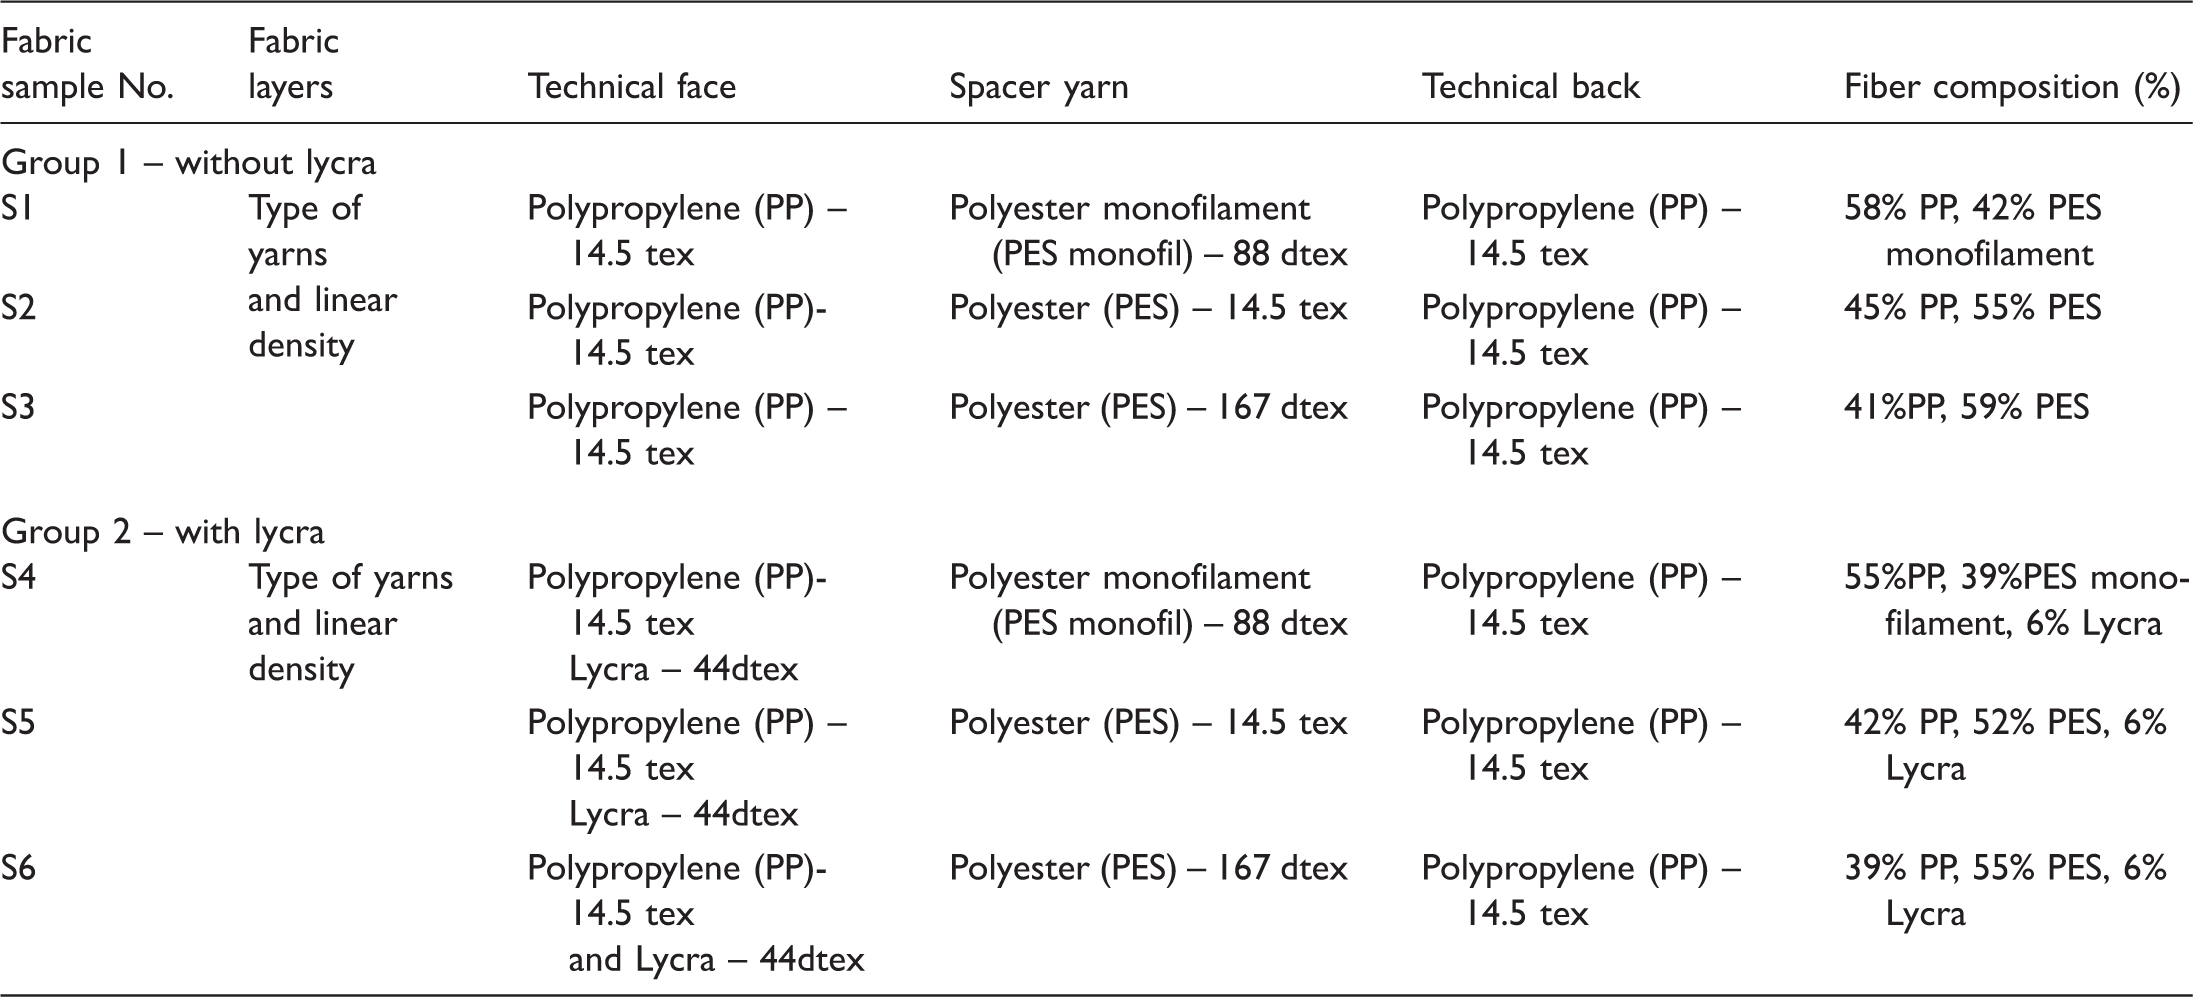
Characteristics of spacer fabrics.

Methods
Picture frame shear tester
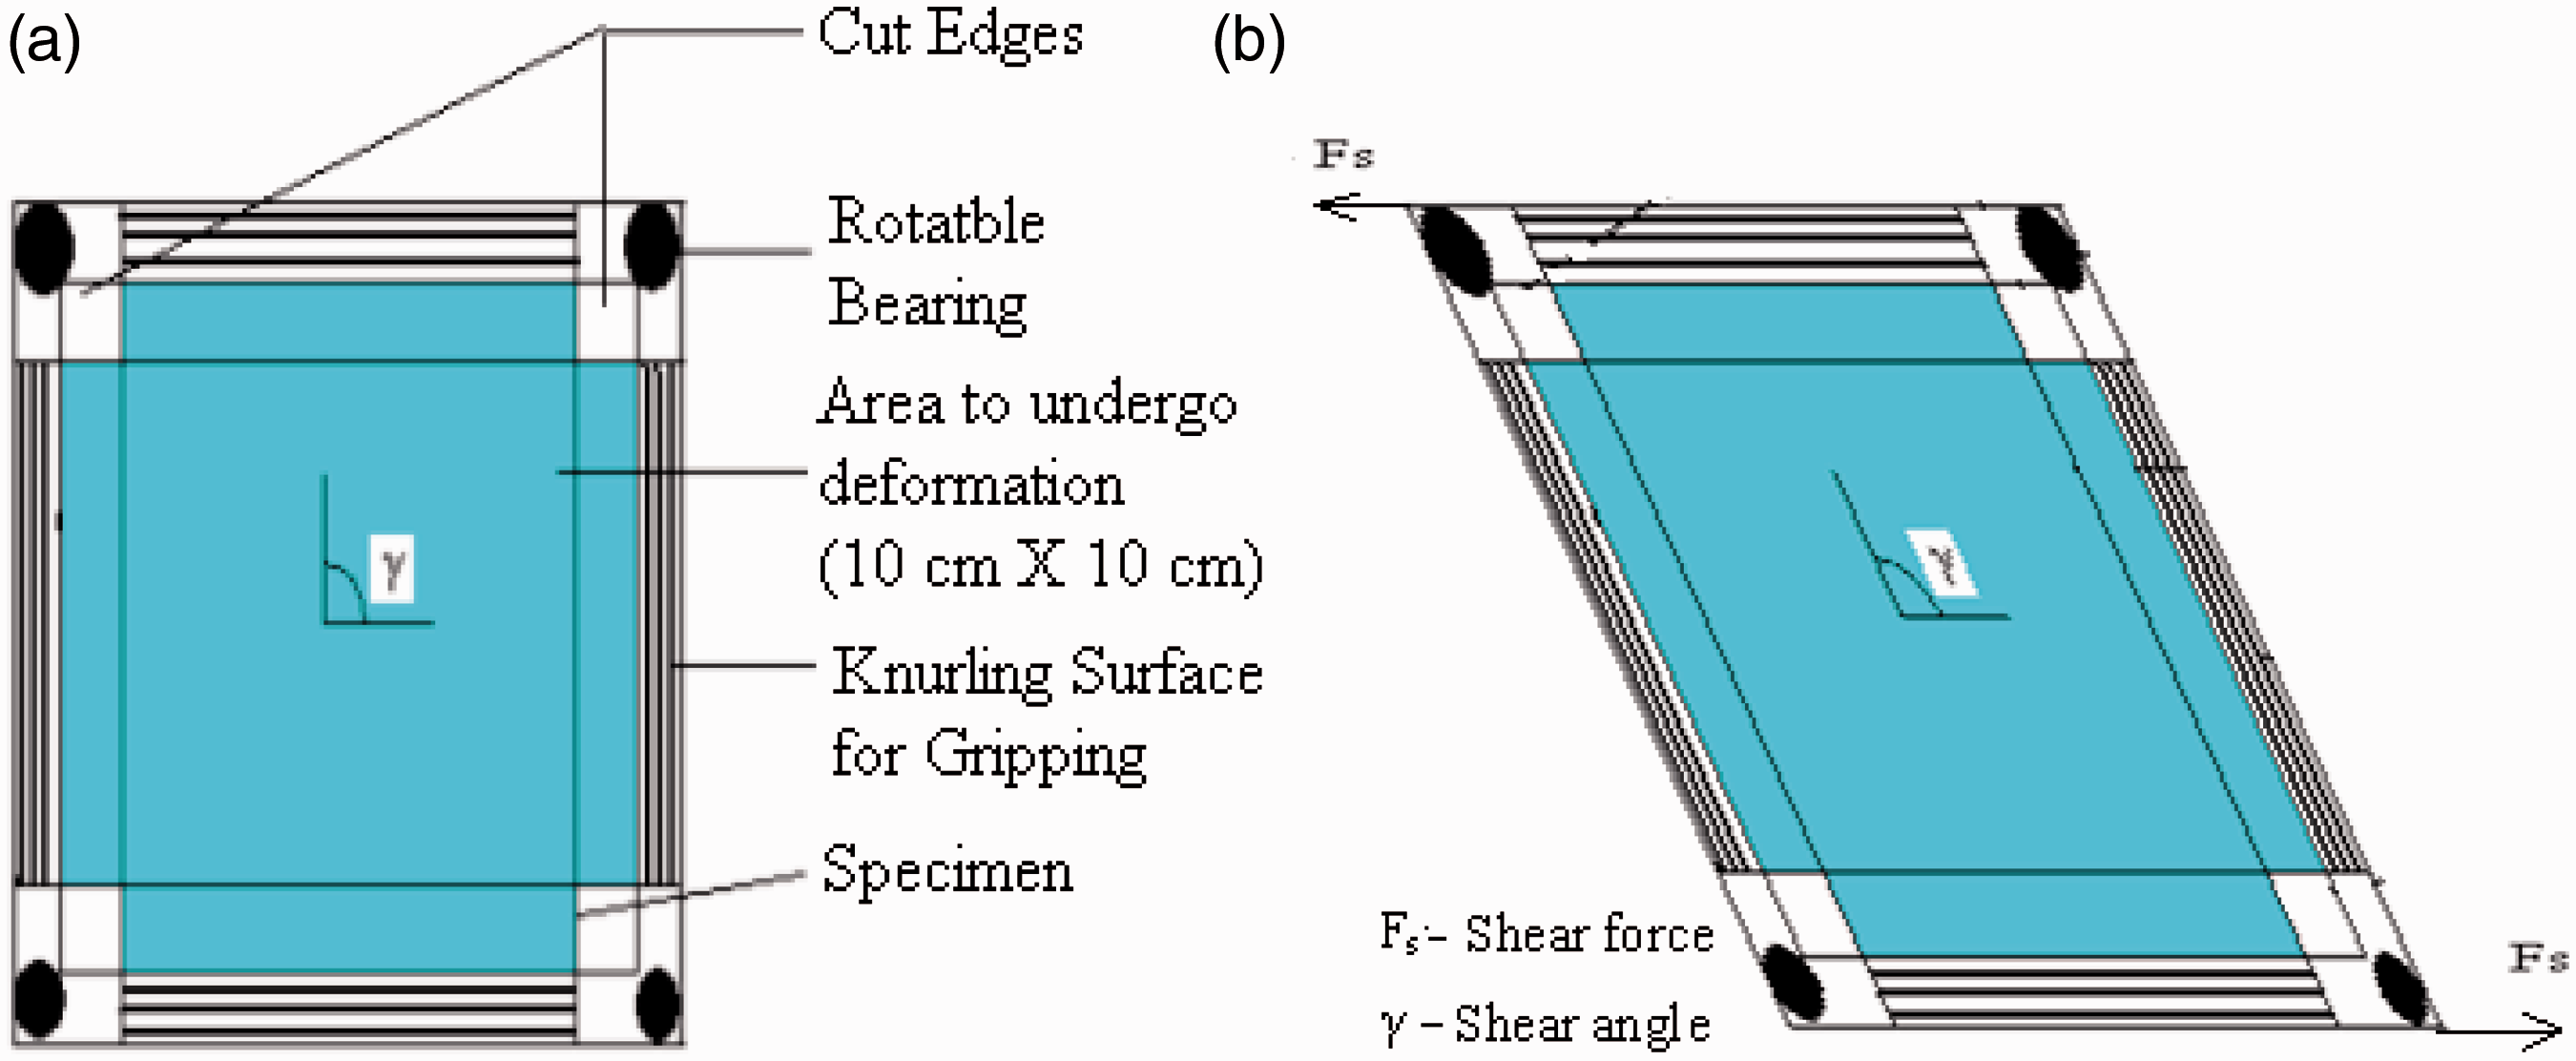
Picture frame test as shown in Figure 2 is an effective way for characterizing intra-ply shear property of fabrics [16]. The picture frame test is preferred by many researchers for shear testing since it generates pure state of strain which can be imposed on the test specimen [17–19]. Shearing is induced by restraining the textile reinforcement in a rhomboid deformation frame with fibers constrained to move parallel to the frame edges. The frame is extended at diagonally opposing corners using simple tensile testing equipment. The 3D spacer fabrics for shear tests were prepared according to the size of the picture frame and the characteristics of samples are described in the Figure 3.
Picture frame fixture design. Shear deformation of frame and specimen. (a) Before deformation (b) After deformation.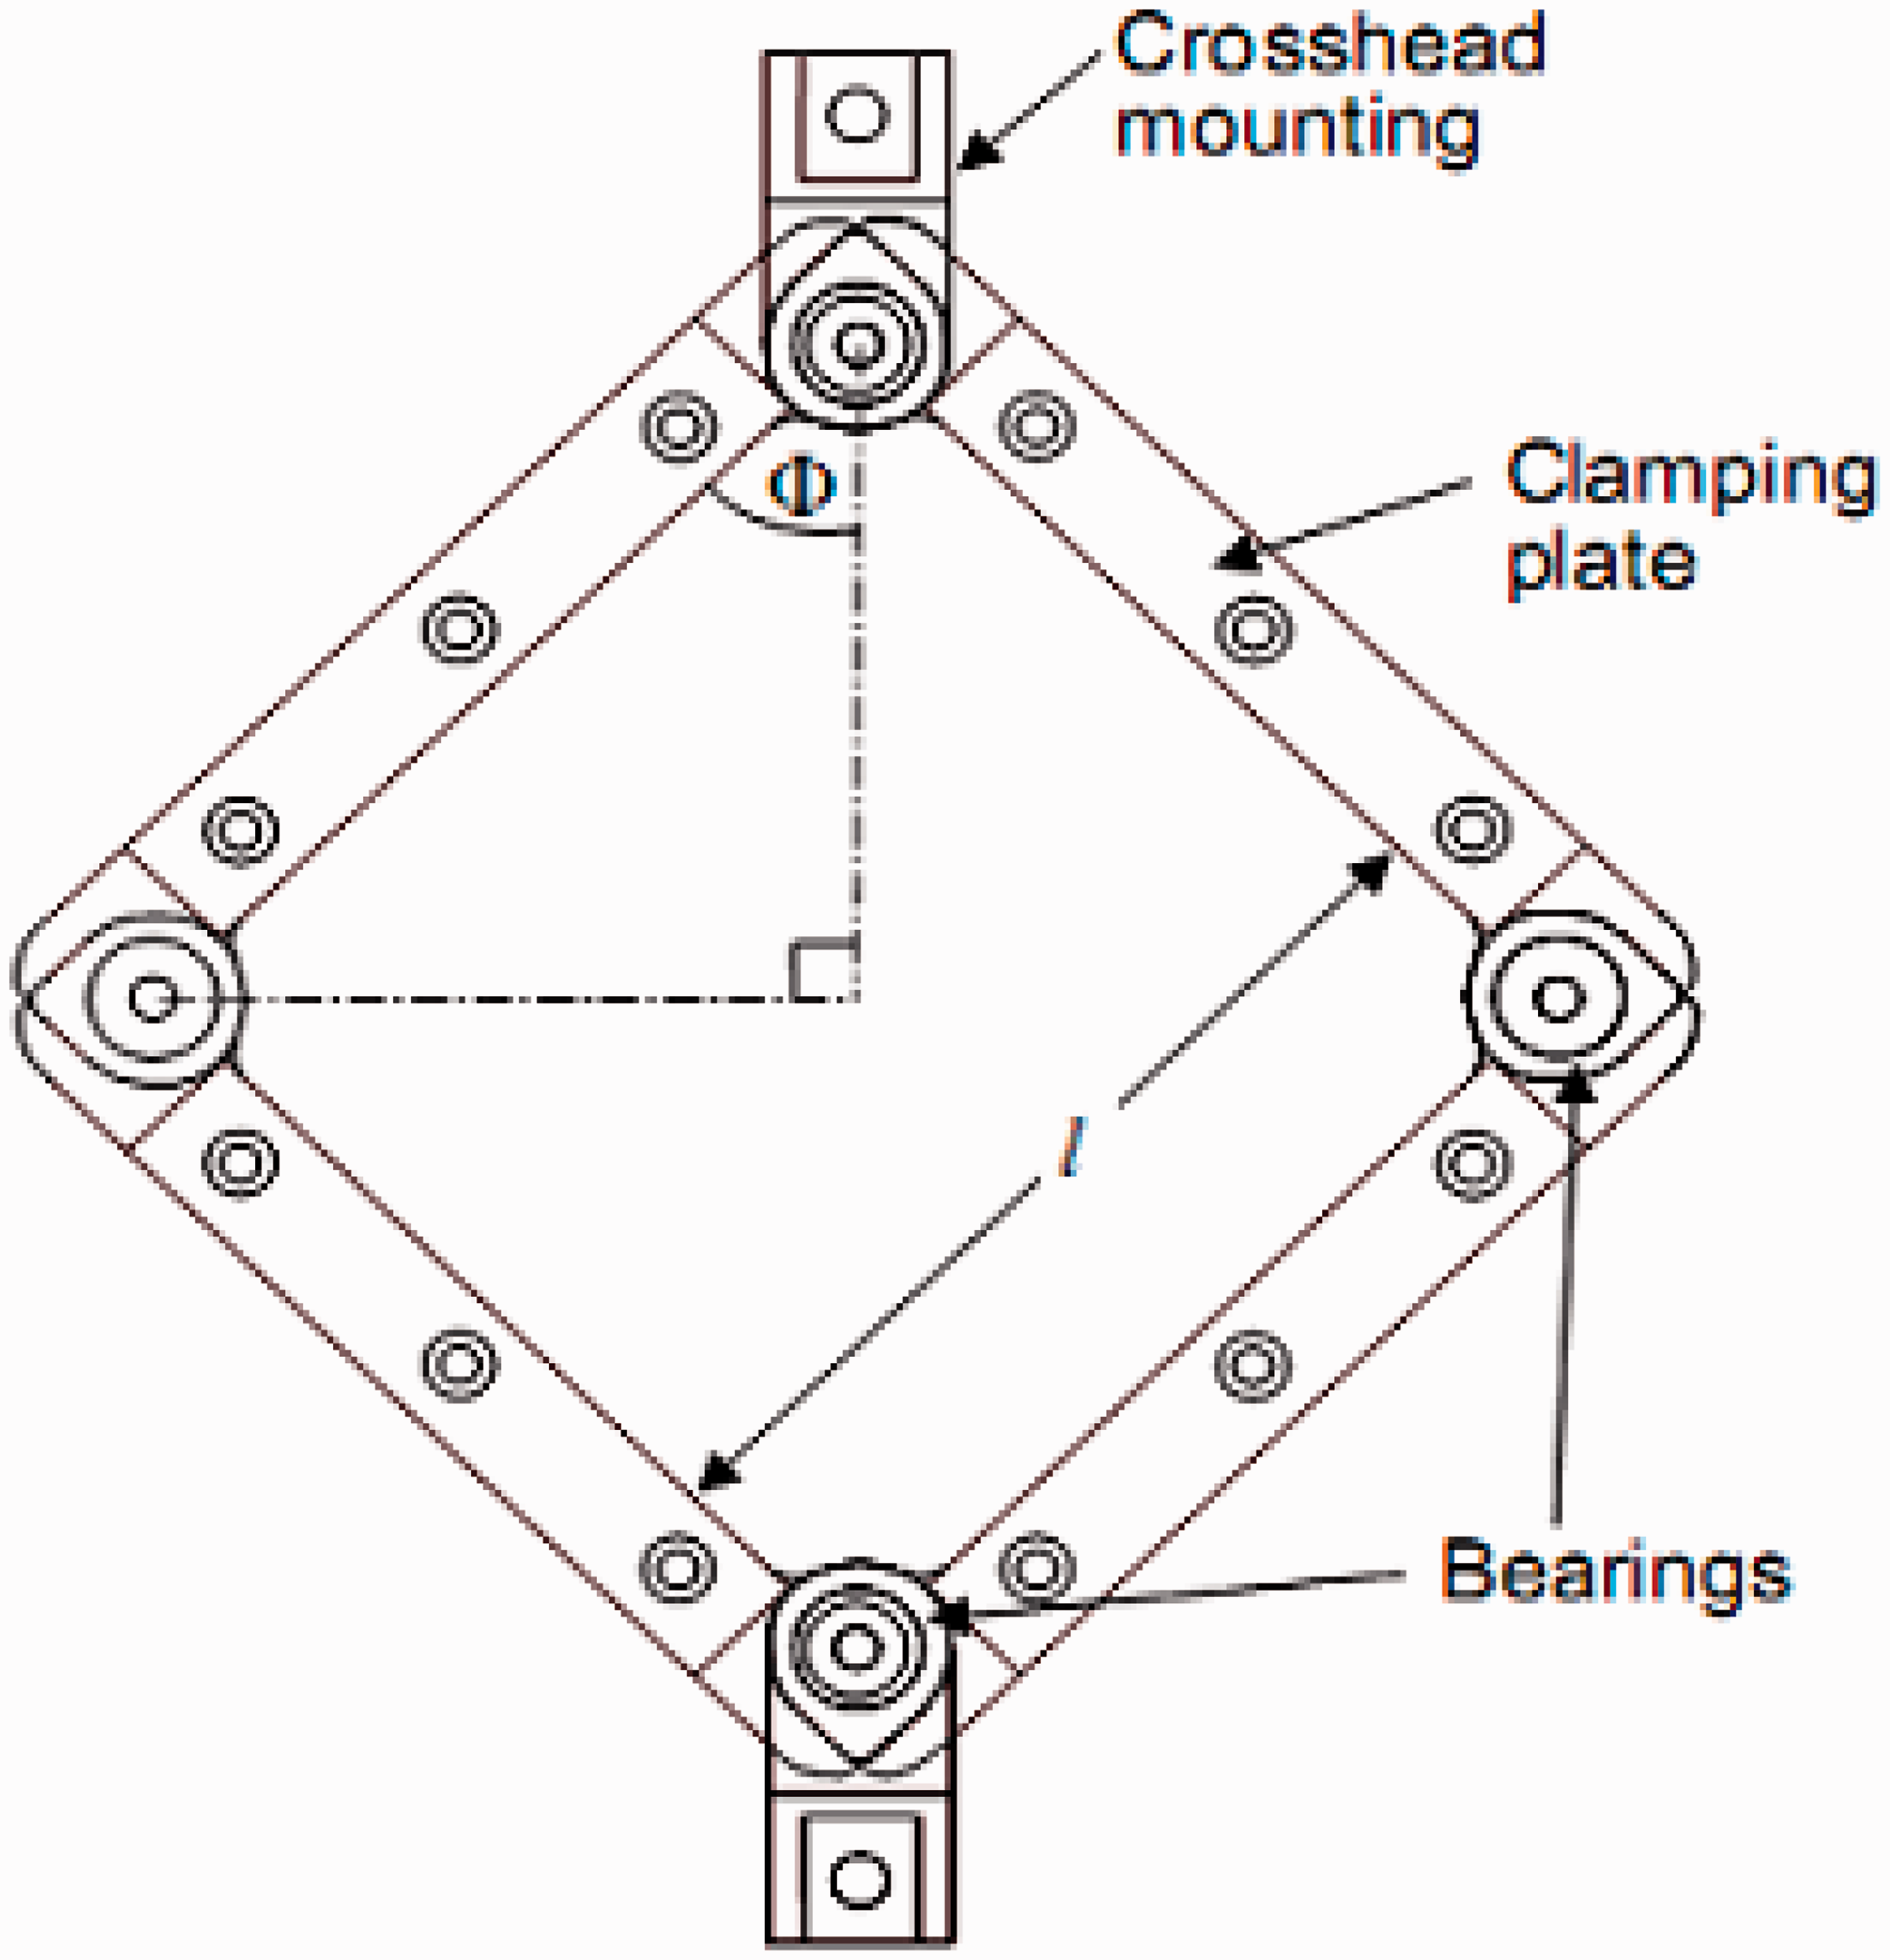
Description of the test method
A 3D view of developed picture frame fixture for shear testing is given in Figure 4. The apparatus has four legs which are hinged to form a picture frame. Further, there is a rod which runs across one of the diagonal of the frame. It should be noted that this rod is not in the plane of the frame but runs behind the frame. The lower end of the rod is hinged with the common hinge of the two legs meeting in that corner. The other opposite corner hinge is resting in the slot provided in the rod. The slot is about 6 cm long for maximum deformation of frame. Further, at the lower end the rod is again hinged to individual legs of the frame. The lower end of the rod is fixed in crossheads of the loading machine. By adjusting the distance between the upper and lower crossheads, the angles between the arms of fixture reach 90o. The distance can be set as the original reference value, i.e. the zero displacement position, in computer, so that later on, all the experiments can automatically begin from this zero point. Also, the force can be set to zero at this position. Thus, when the load is applied through the upper end of the rod, it pushes these two legs apart and deforms the frame. These two legs in turn push their adjacent legs making their common hinge to slide in the slot of the rod. The plate deforms into a diamond shape.
3D view of picture frame shear fixture.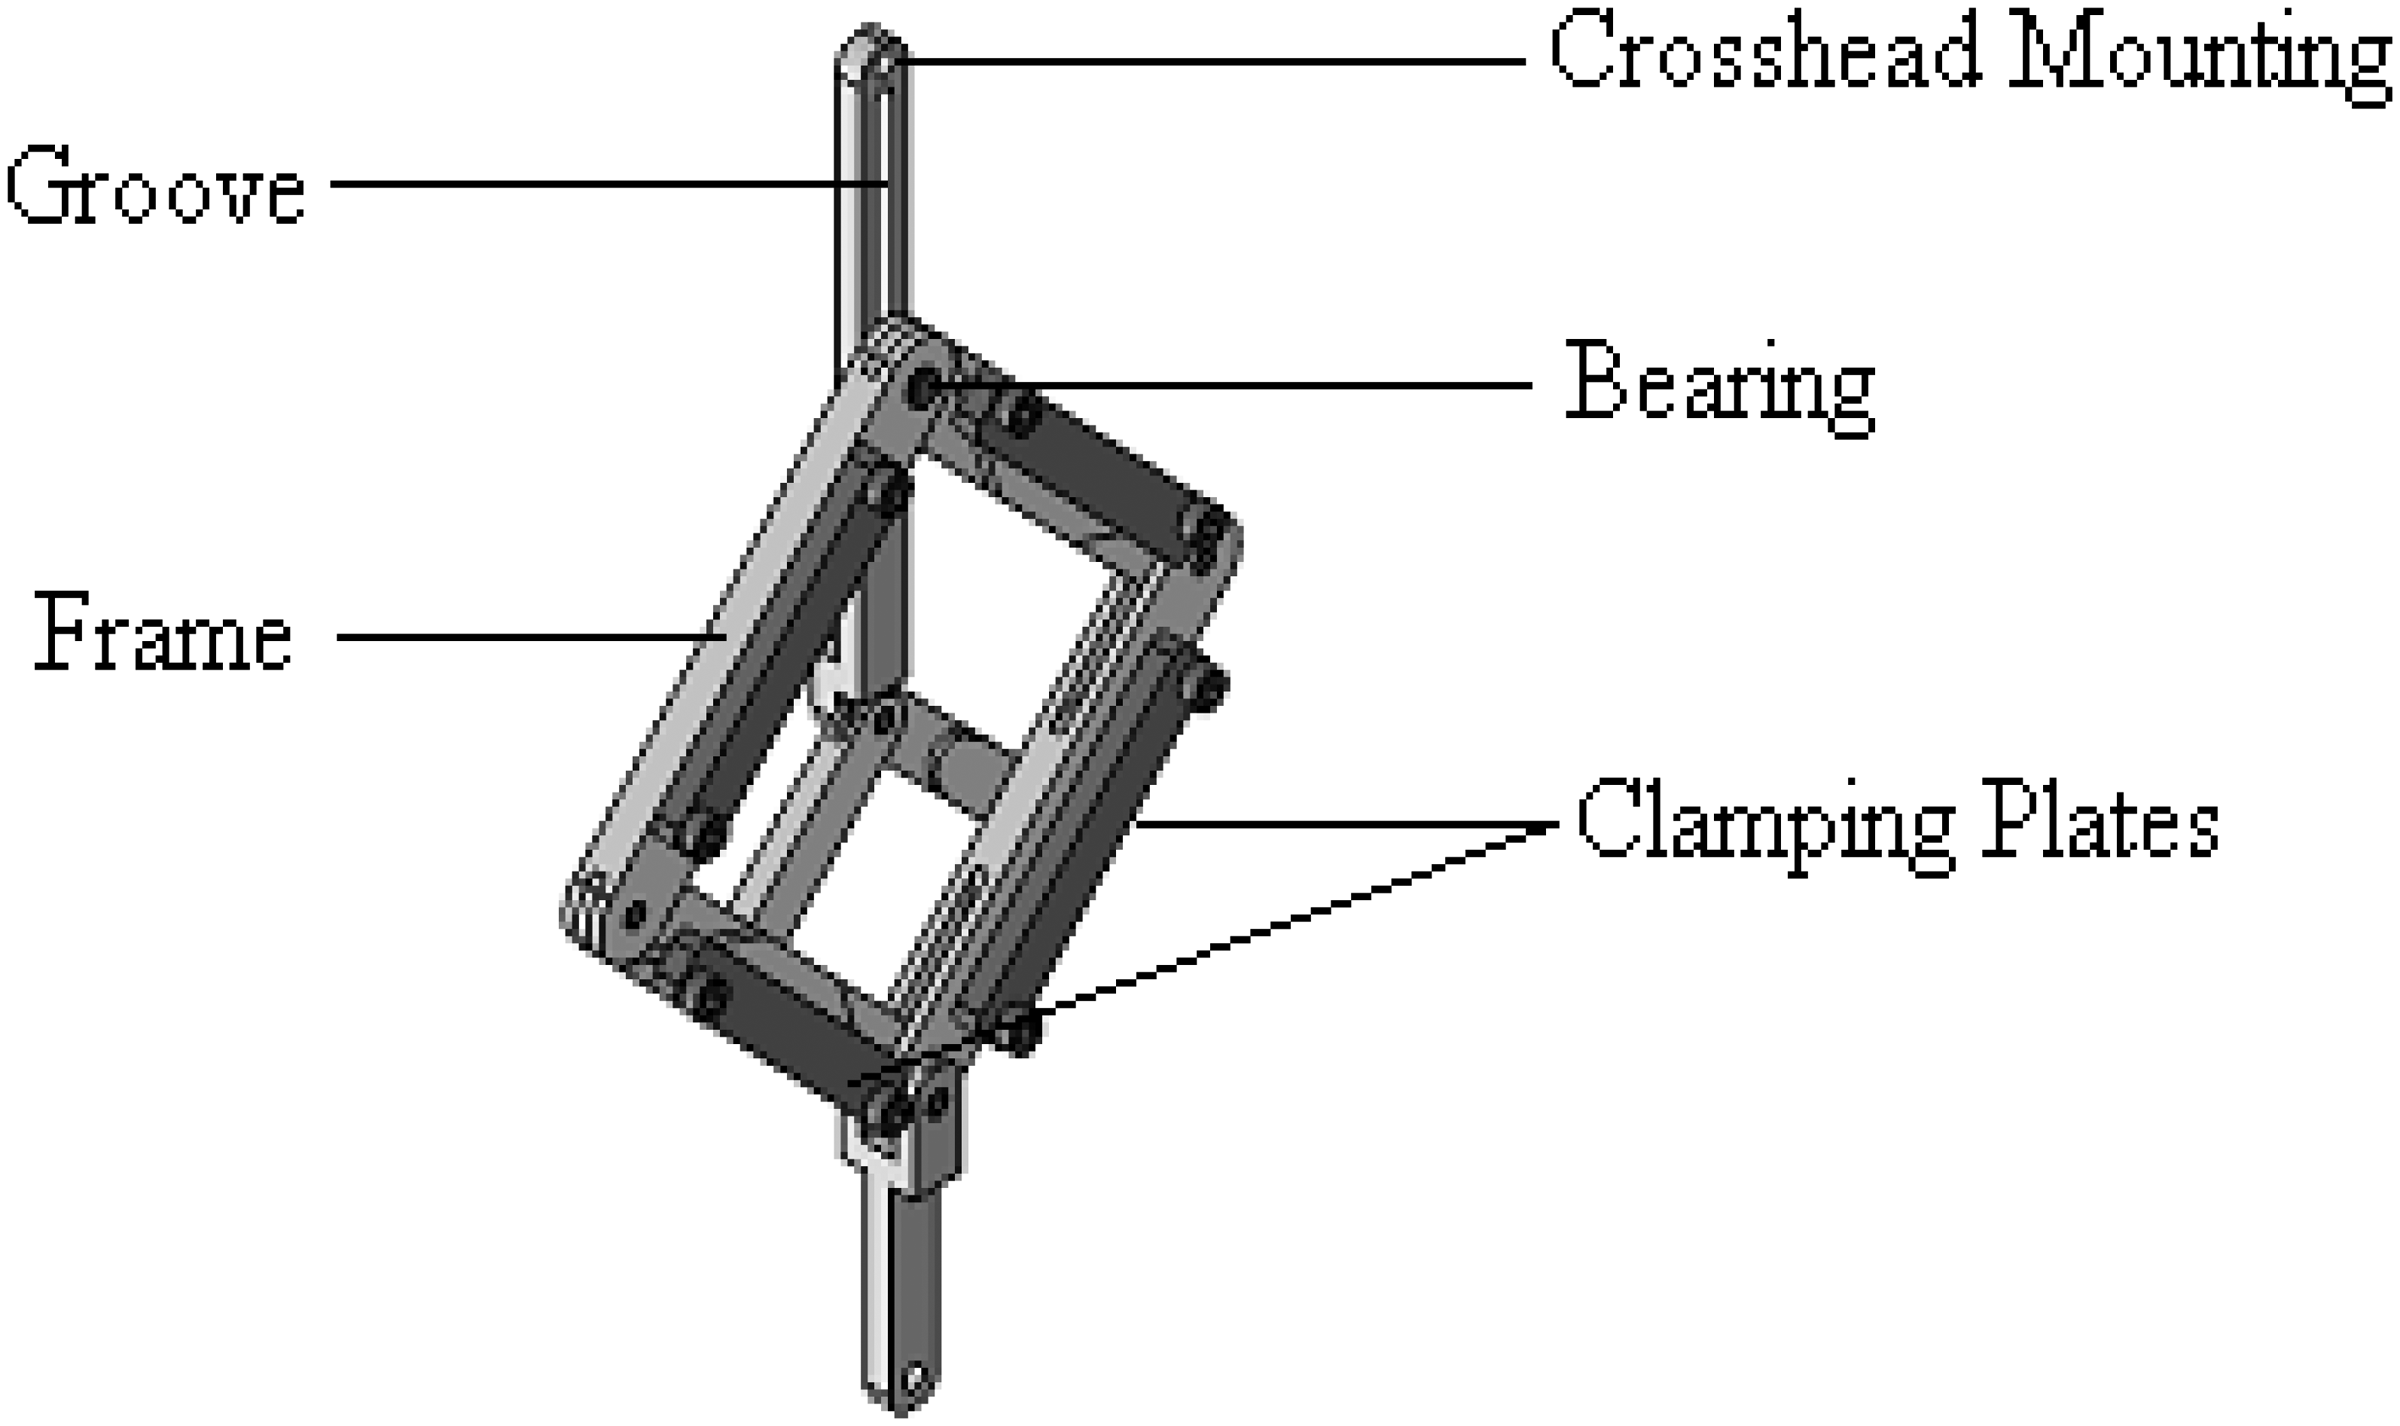
The spacer fabric is clamped to the frame with the help of clamping plates as shown in Figure 5. These clamping plates are 3 cm in width and it has diamond knurled surface for better gripping. The empty frame is tested under the same condition to find the frictional effects between bearings and slots. After several trials of this test, the average value of load at each displacement point is calculated. This is to record the load-displacement behavior of the empty fixture under the same condition as in the real shear experiment. Thus the frictional effect is considered and eliminated during sample testing. To eliminate the error caused by the weight and inertia of the fixture, the net load obtained was subtracted from the machine-recorded load when the fabric is being deformed in the picture frame. Then this resultant load is considered and accounted as an actual load. In order to prevent the pressures from imposing on test samples by the fixture during the large deformation, the central area of shear deformation was 100 mm × 100 mm, and the four corner parts were cut off (Figure 3) in order to avoid edge buckling. Shear tests were conducted on a TIRA – universal tensile testing machine with a crosshead speed of 10 mm/min. The test was conducted for five samples of each type under the same conditions.
Clamping of sample in fixture.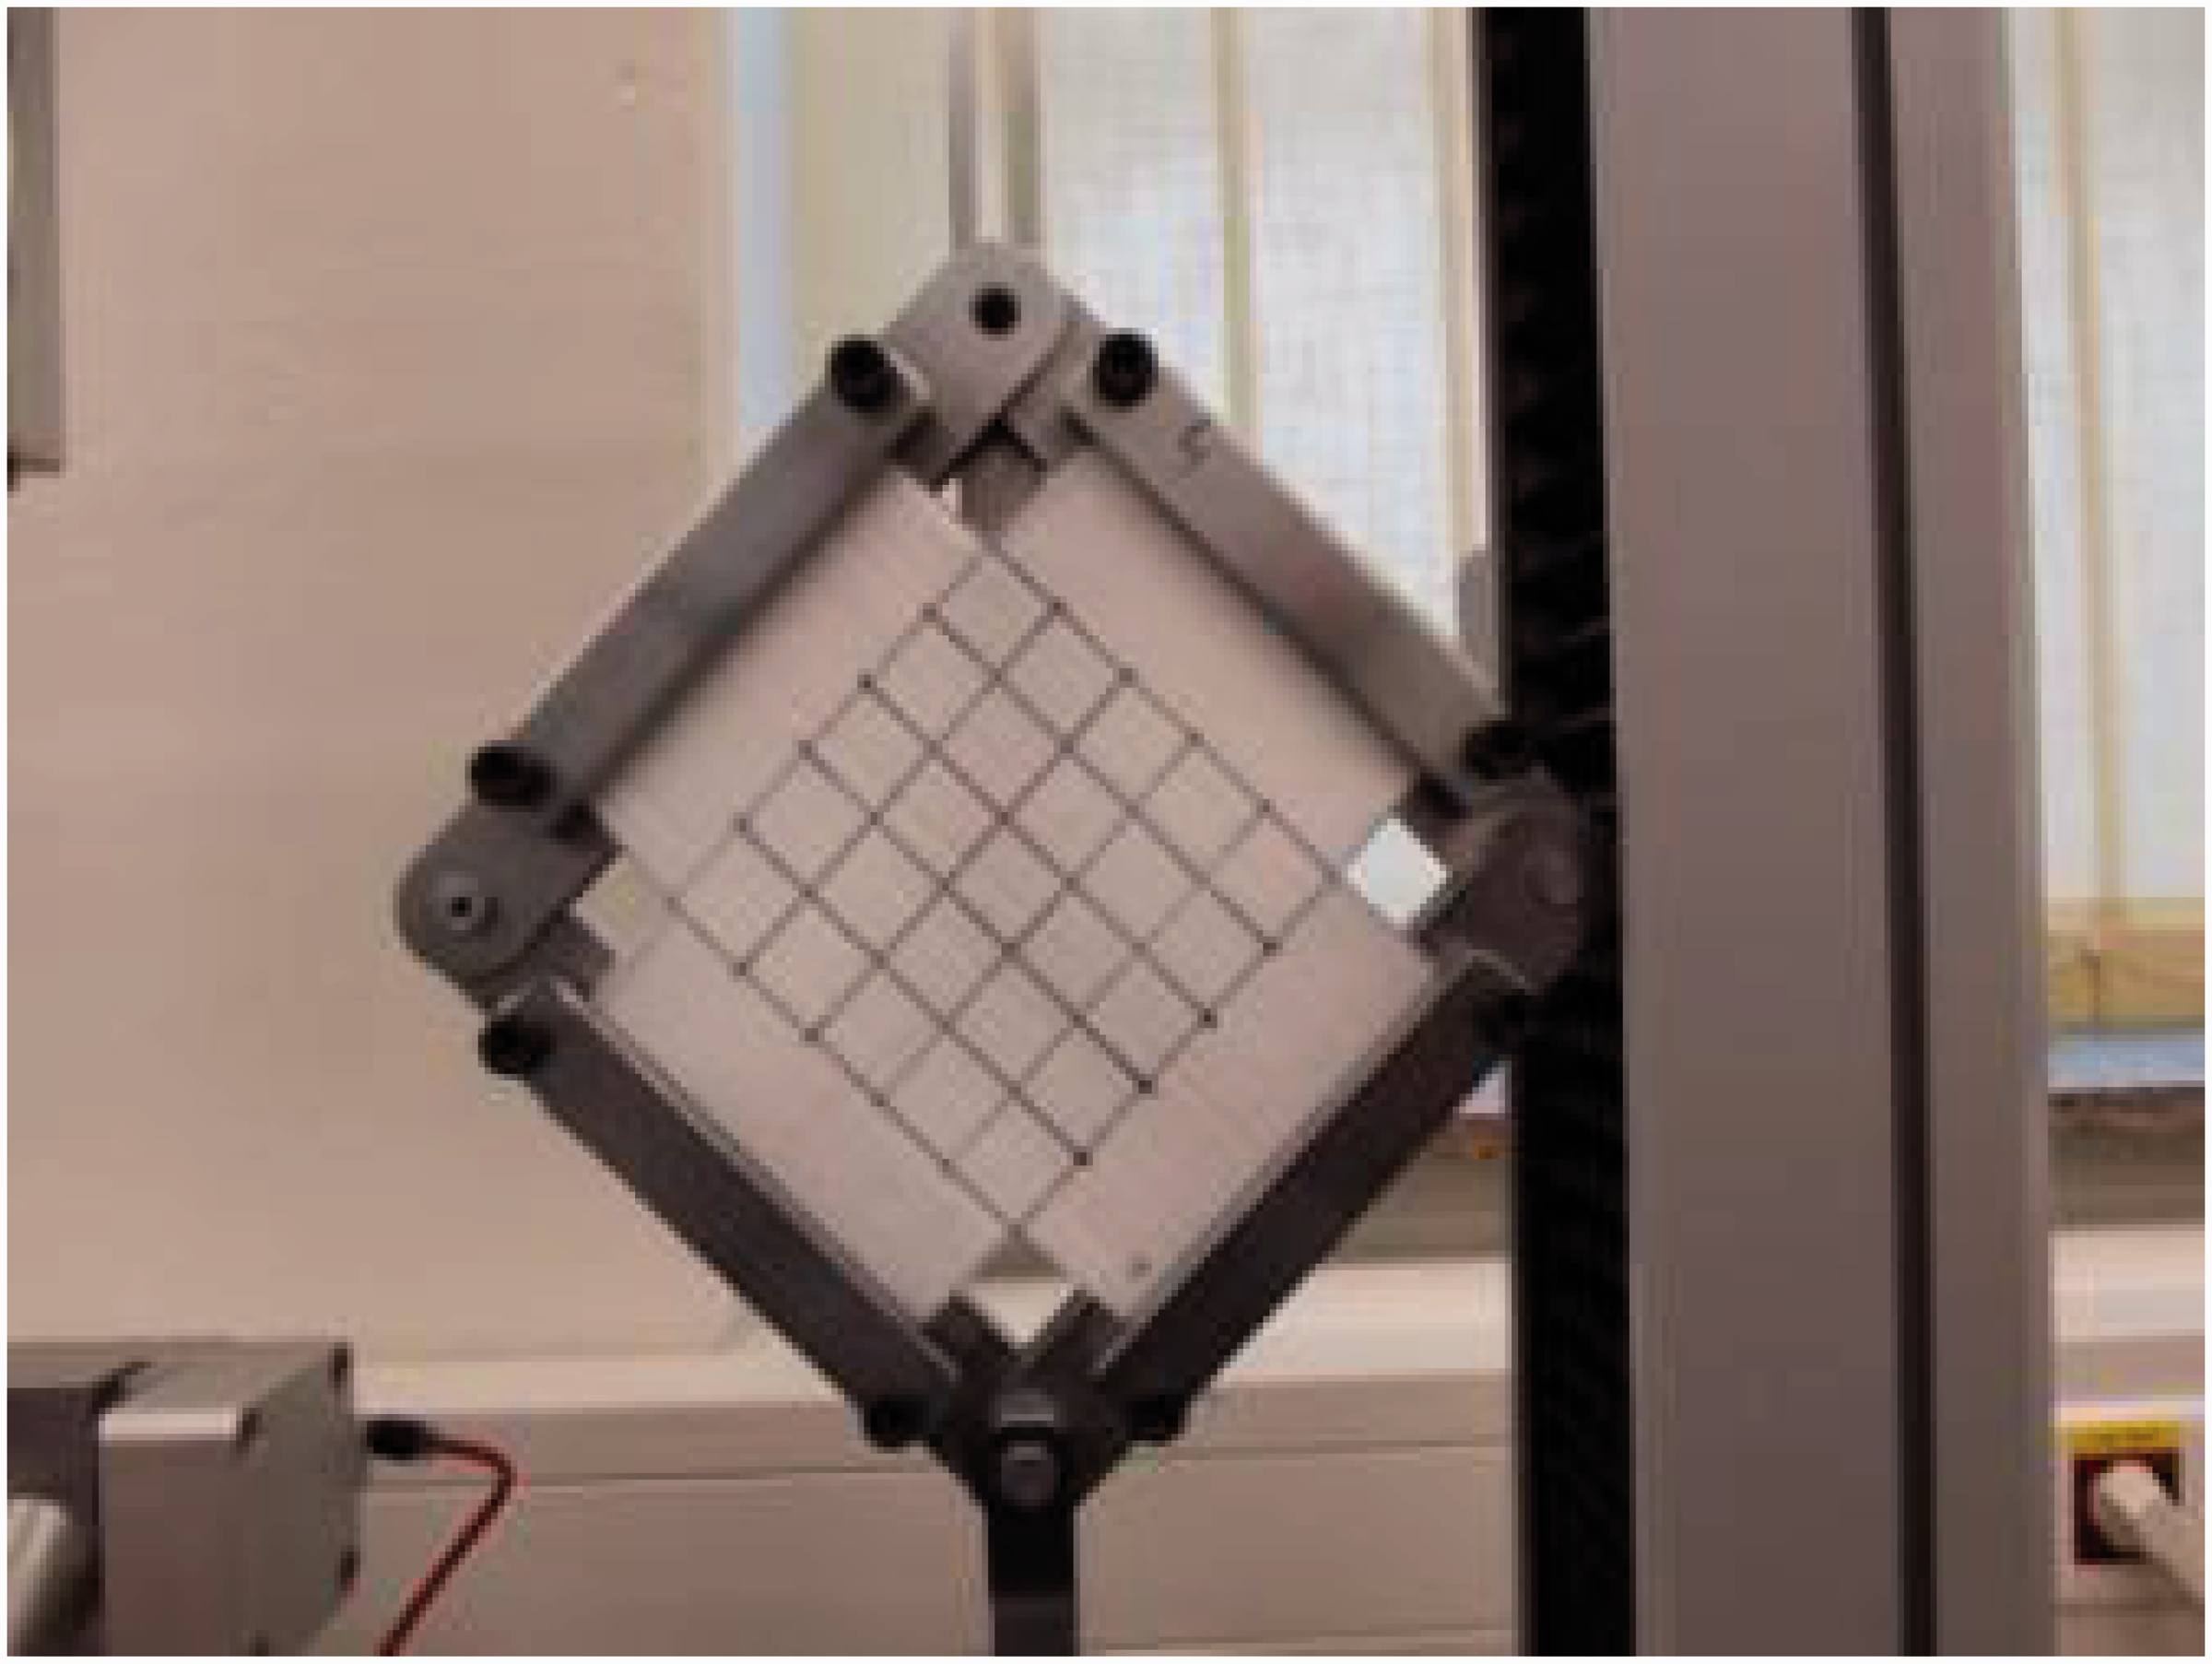
Deformation kinematics of fixture
A tensile force is applied at the crosshead mounting. The rig is jointed at each corner such that its sides can rotate and the interior angle between adjacent sides can change. The initially square frame thus becomes of rhomboid (or diamond) shape as shown in Figure 4. Material inside the rig is subjected to pure shear deformation kinematics (Figure 6). The force required to deform the material is recorded at the crosshead mounting as a function of crosshead displacement [20–24].
Deformation kinematics of picture frame.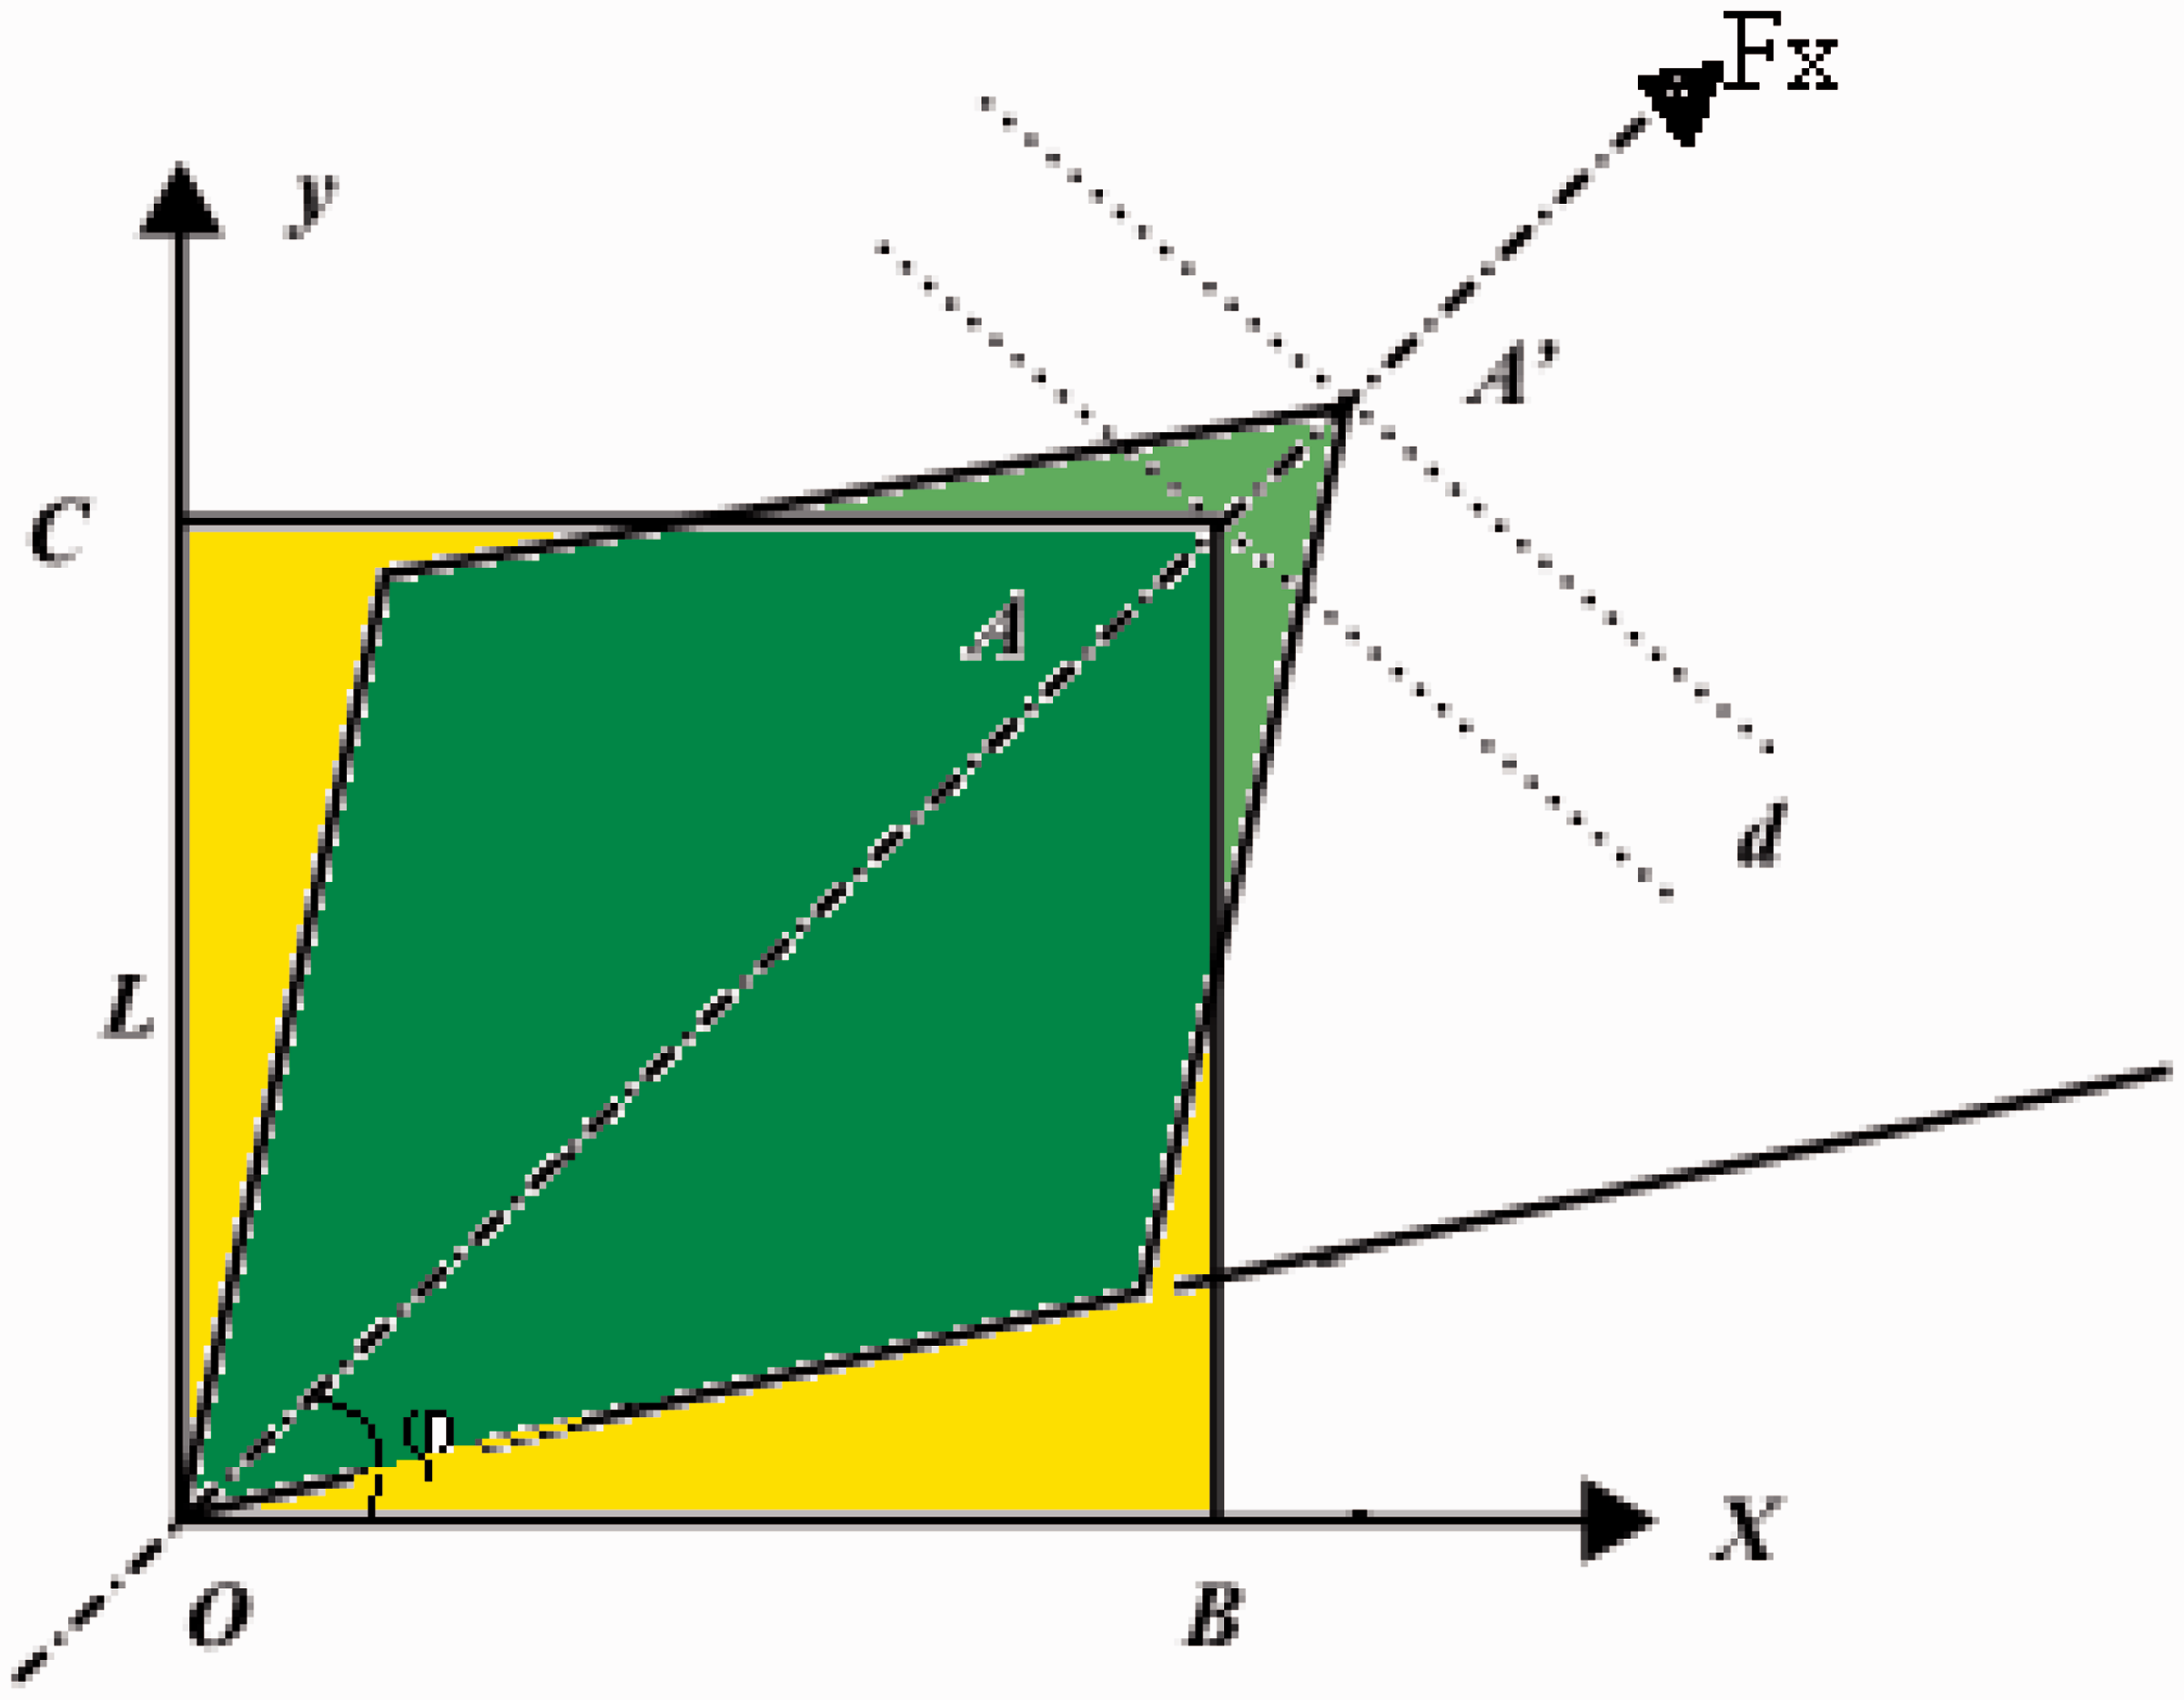
Direct measurement of axial load and shear angle is possible through this following relationship [25,26].


Image analysis using MATLAB
Image analysis can aid in the determination of the shear angle and displacement at any particular point on the surface of fabric specimen. Grid pattern was applied on the specimen surface before the test and used as the reference points of image analysis. The complete displacement of the specimens during loading process was obtained by image analysis methods. The images were captured at certain regular interval of time using digital camera. A special program is developed in MATLAB 7.10 (R 2010a) using Hough’s transform to find the angle between the lines on the specimens. The results of experimental methods and image analysis were compared with each other.
Results and discussions
Effect of fabric characteristics on in-plane shear behavior of spacer fabrics
The picture frame test method is verified for the 3D spacer fabrics under consideration. Figure 6 shows the array of images for a 3D spacer fabric specimen captured during the loading process at each 5-mm displacement for every 30 s. In the beginning (Figure 7a), there is no shearing. Subsequently, the shear deformation resistance is mainly from the friction between the wale and course direction loops before reaching the limiting locking angle. The limiting locking angle is the ultimate shear deformation observed by means of local wrinkling. Based on the deformed configuration of the fixture, shear angle is calculated using the relationship shown in equation (3). A vertical displacement of 40 mm, which corresponds to a shear angle of around 50o, was found to be the maximum displacement, but the pre-buckling occurs after 20-mm displacement with shear angle range of 20–30° (Figure 7e). The local buckling is calculated using image analysis software. Figure 8 presents the linear fit curve between time and displacement.
Shear deformation of specimen at different displacement levels. Linear fit curve between time and displacement (10 mm/min).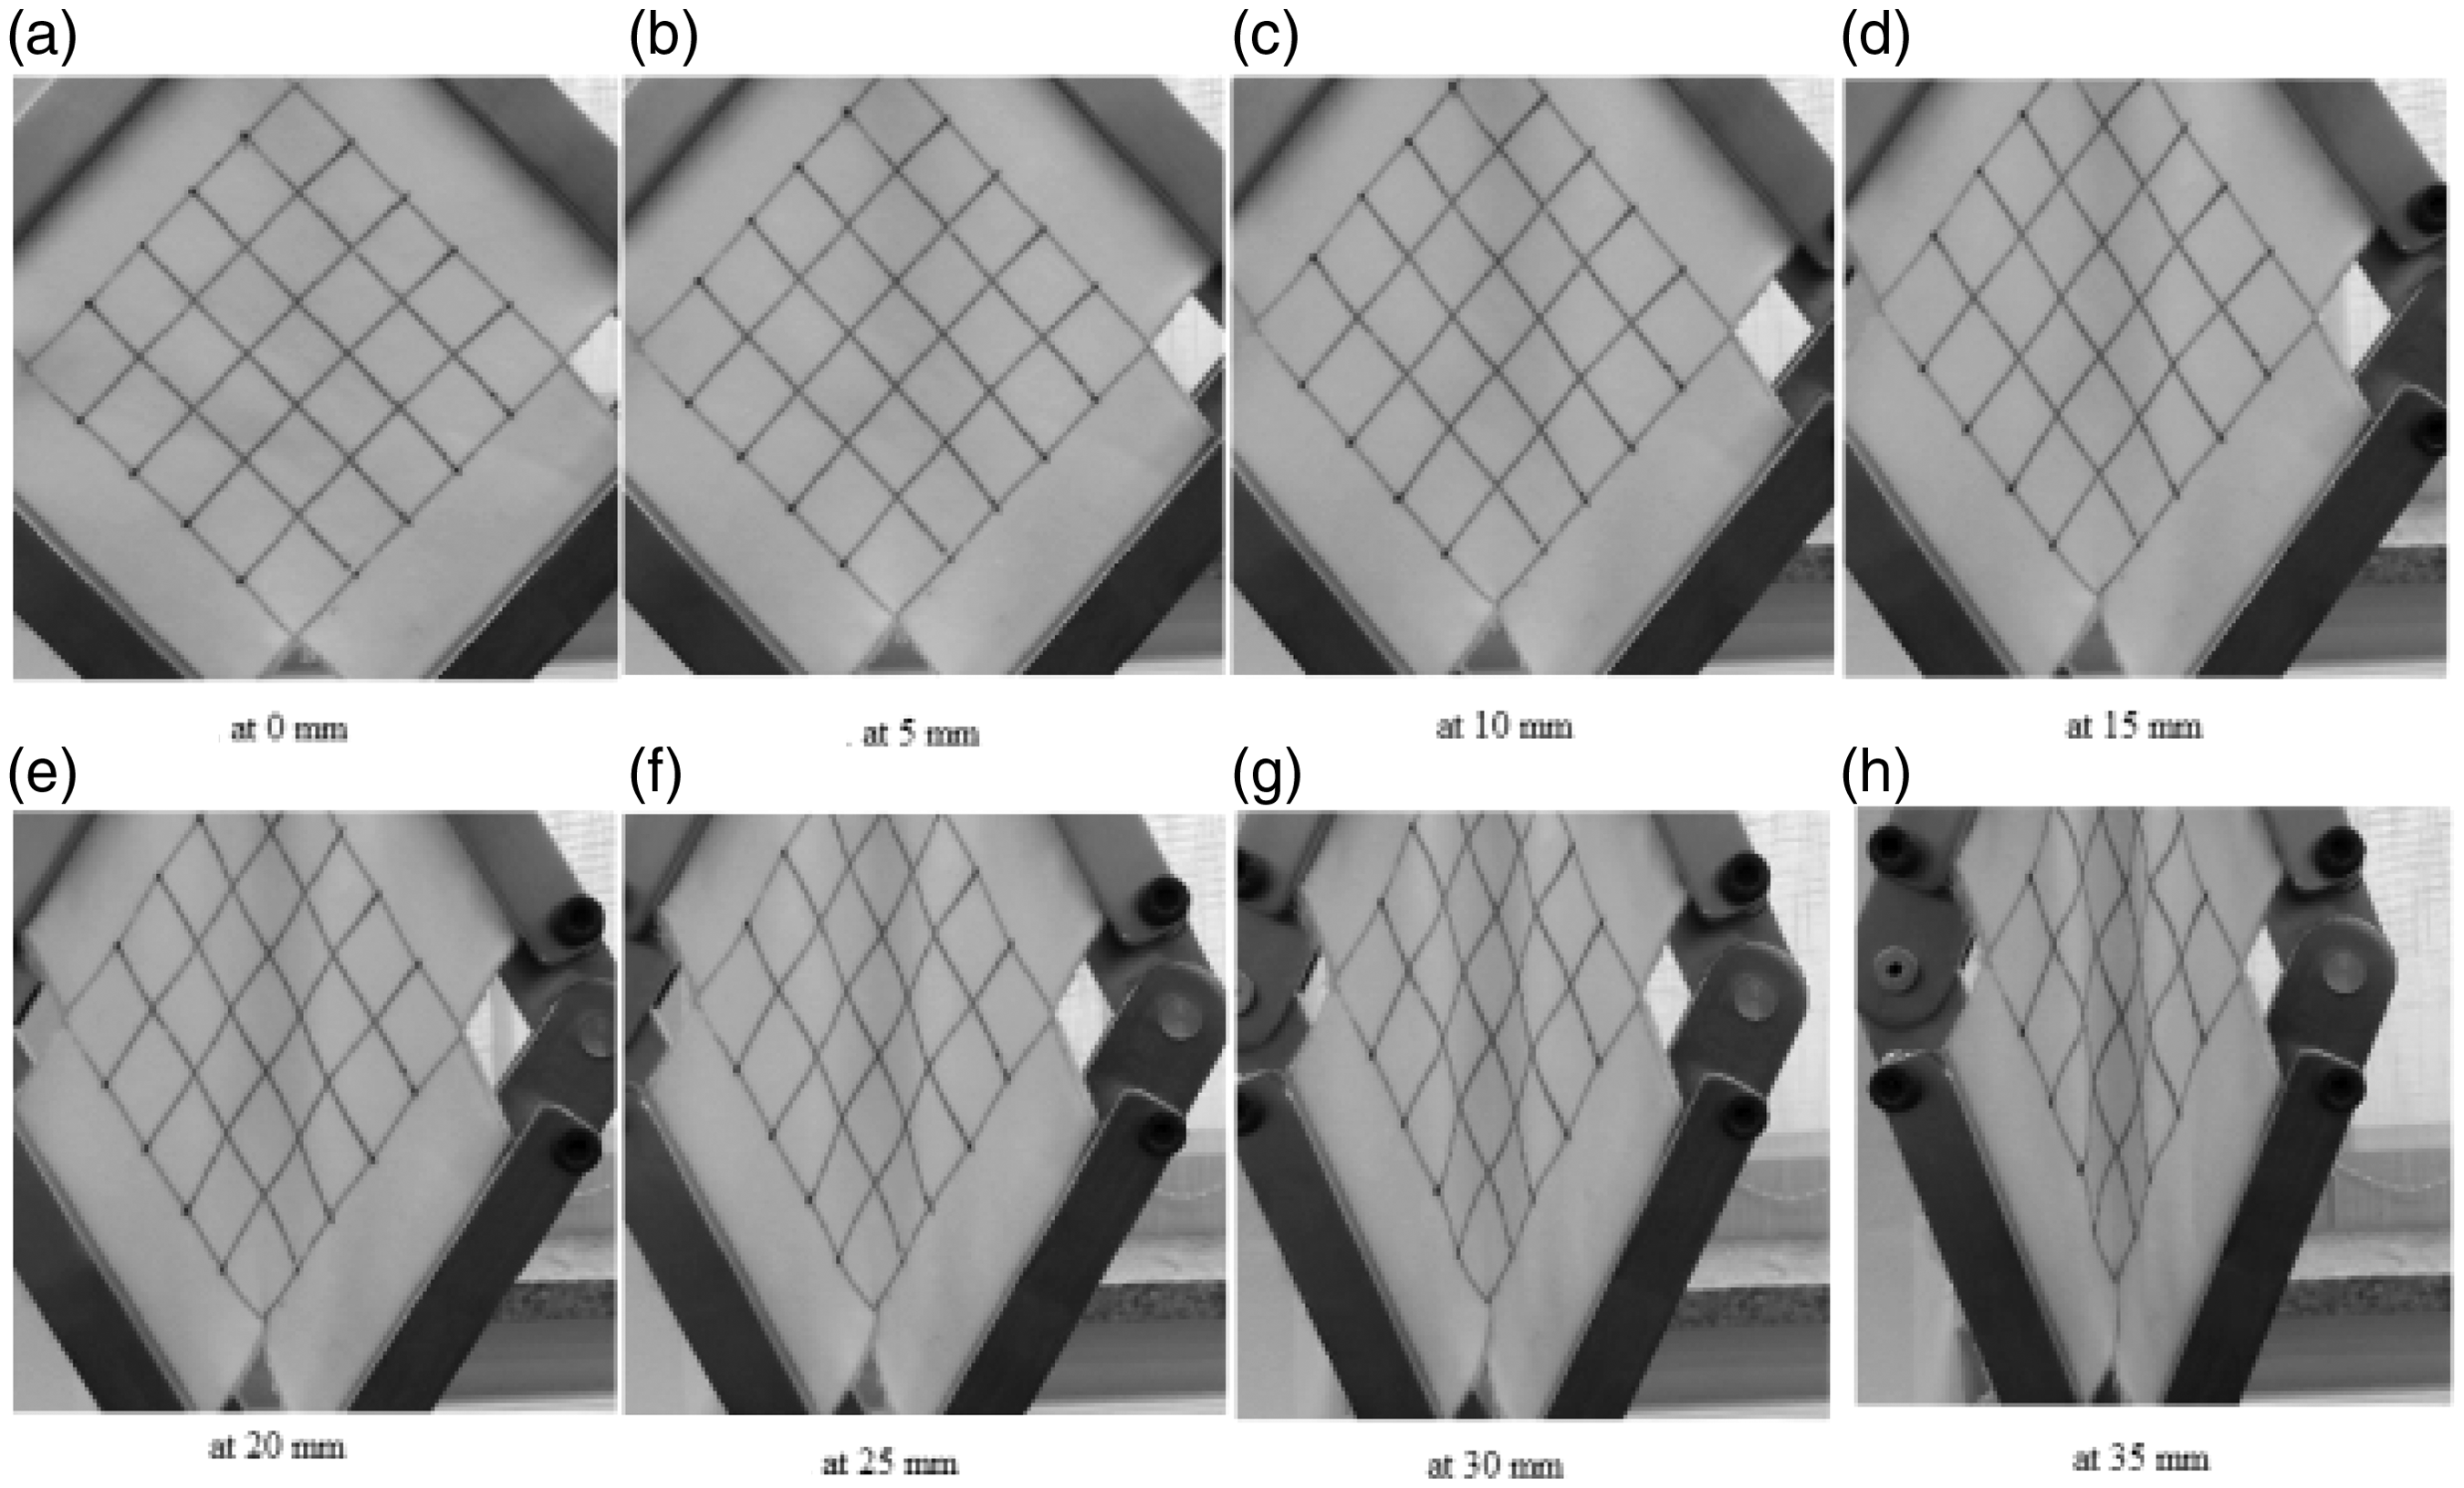
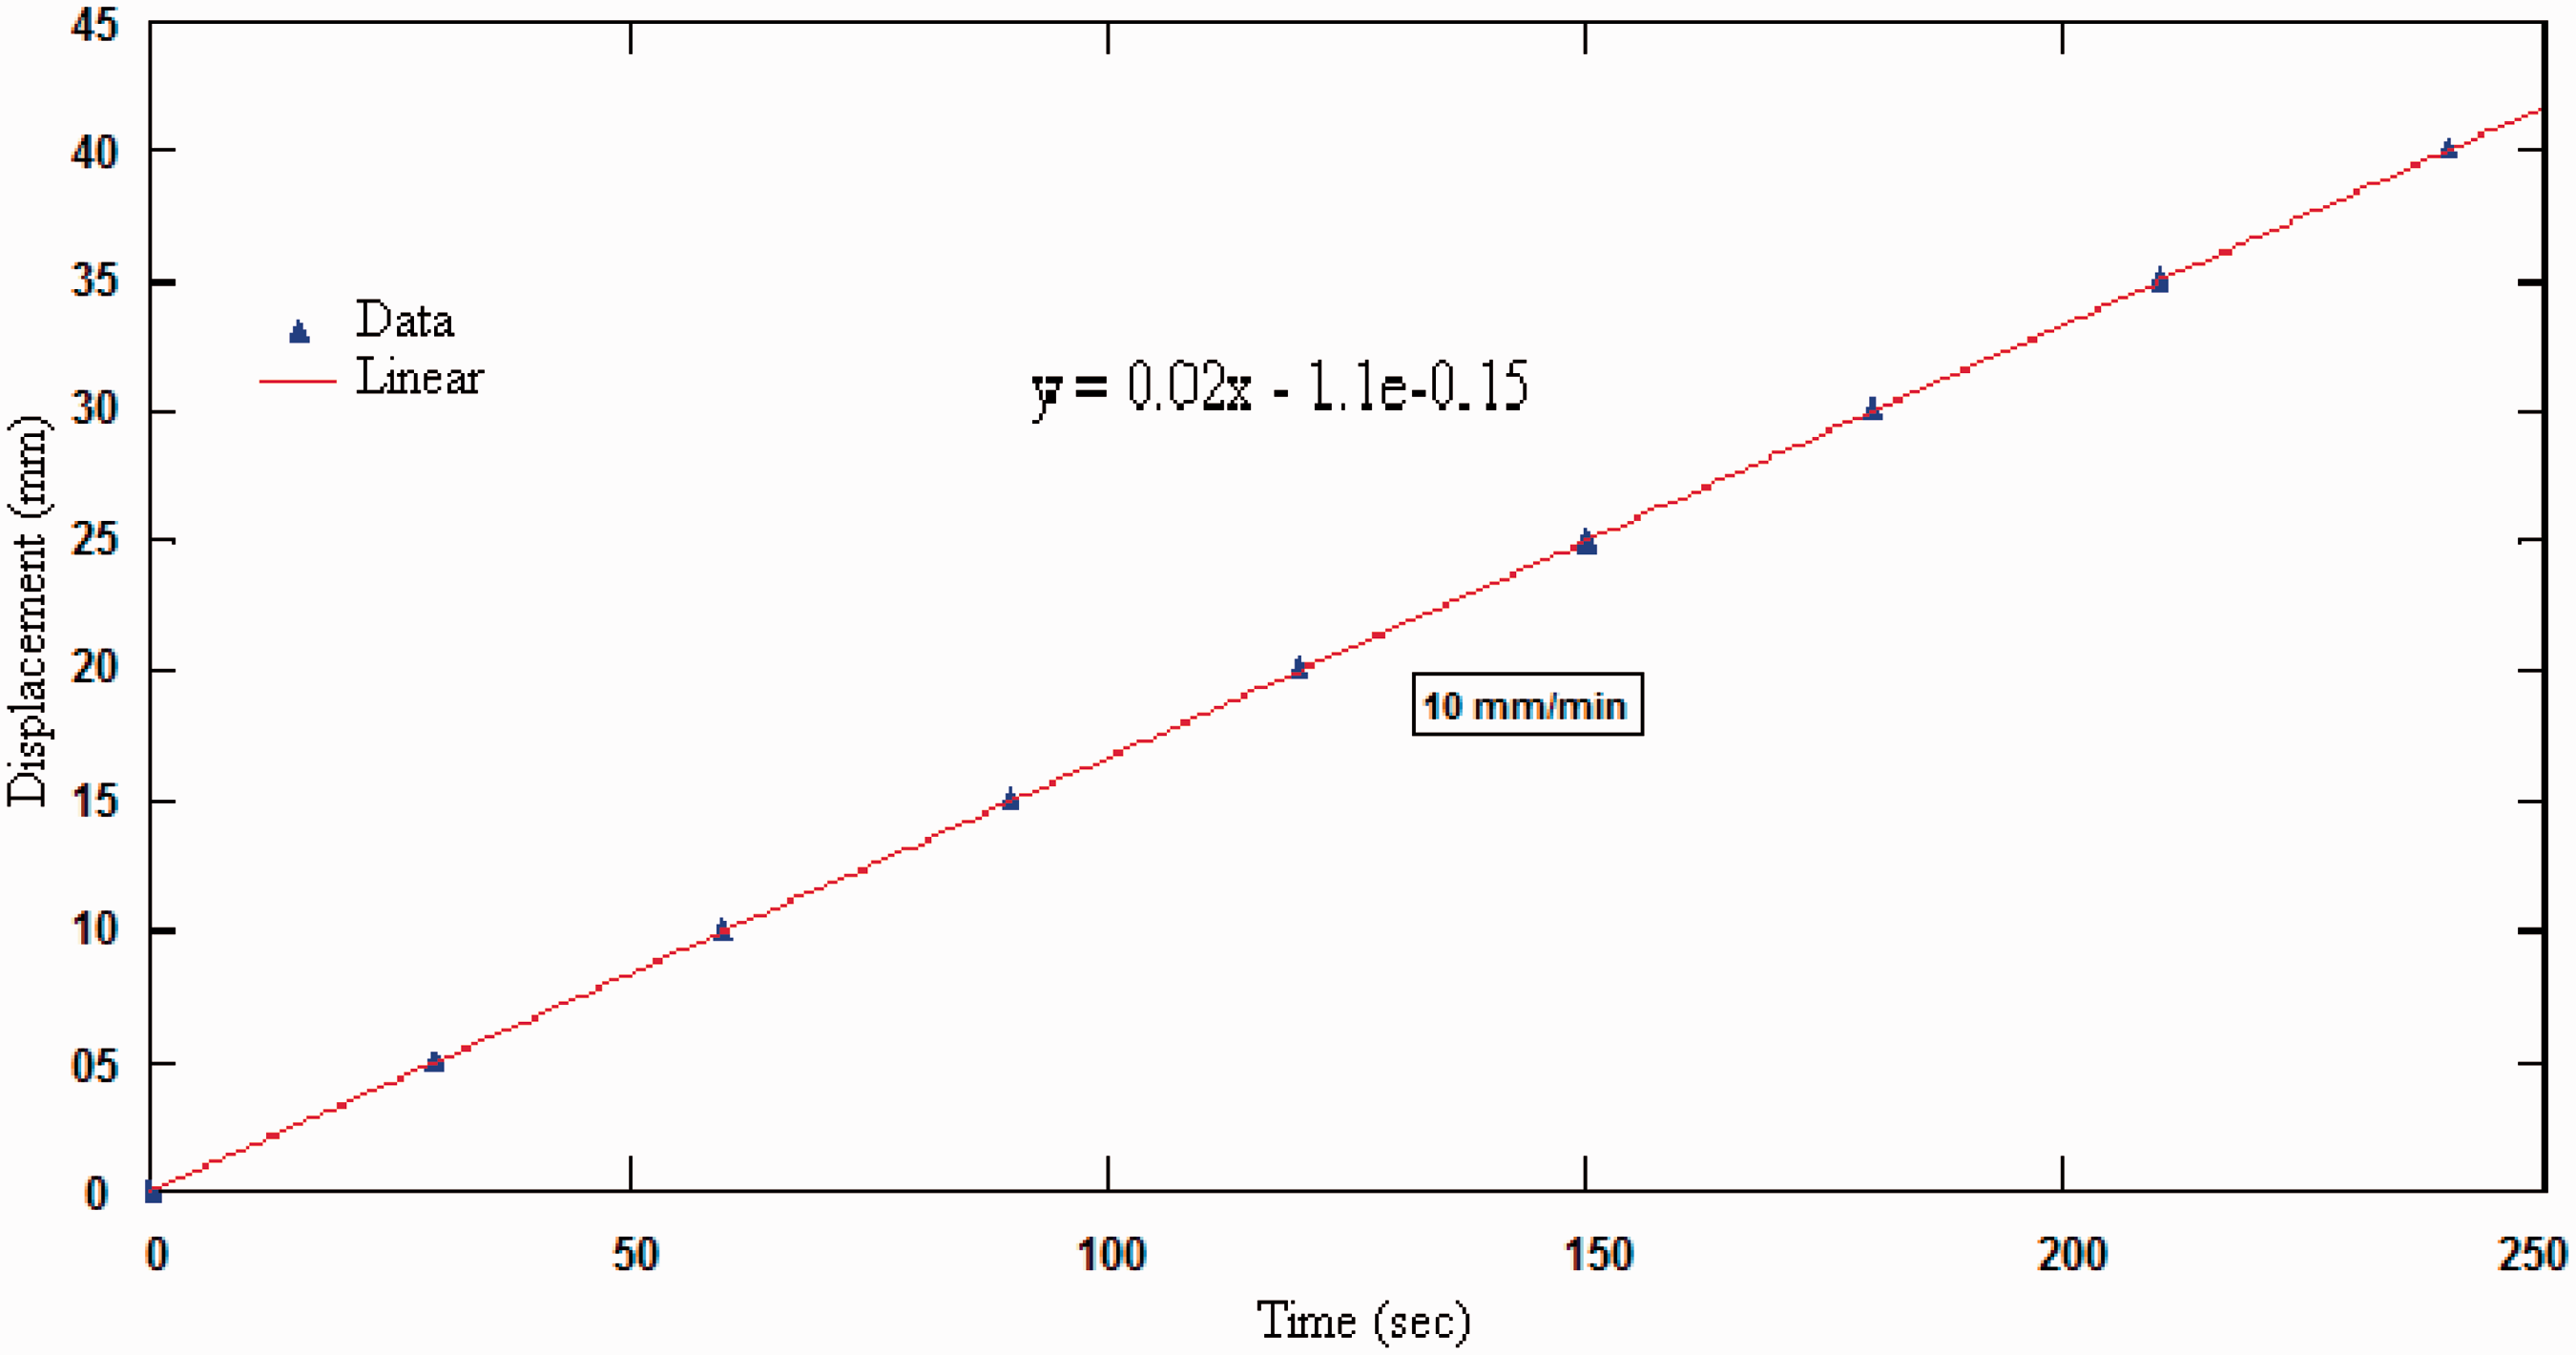
It was a challenge to maintain uniform rate of loading on the tensile testing device. Therefore, uniform displacement method was selected. In order to ensure that the frictional effects of the clamping device and picture frame do not influence the uniform displacement, the linear fit curve was plotted between time and displacement as shown in Figure 8.
The variation in shear angle mainly depends on the different fabric characteristics in samples like stitch density and thickness. The effect of lycra on in-plane shear behavior of spacer-knitted fabric samples is not pronounced. The reason is that, lycra is used only as a spacer yarn with only a small contribution on the surface fabrics. Thus the influence of lycra on inter-yarn friction resisting the angular deformation is almost negligible. The typical load–deformation curves for the six types of 3D spacer fabrics with different stitch density and compositions are shown in Figure 9.
Axial force–displacement curves of specimens.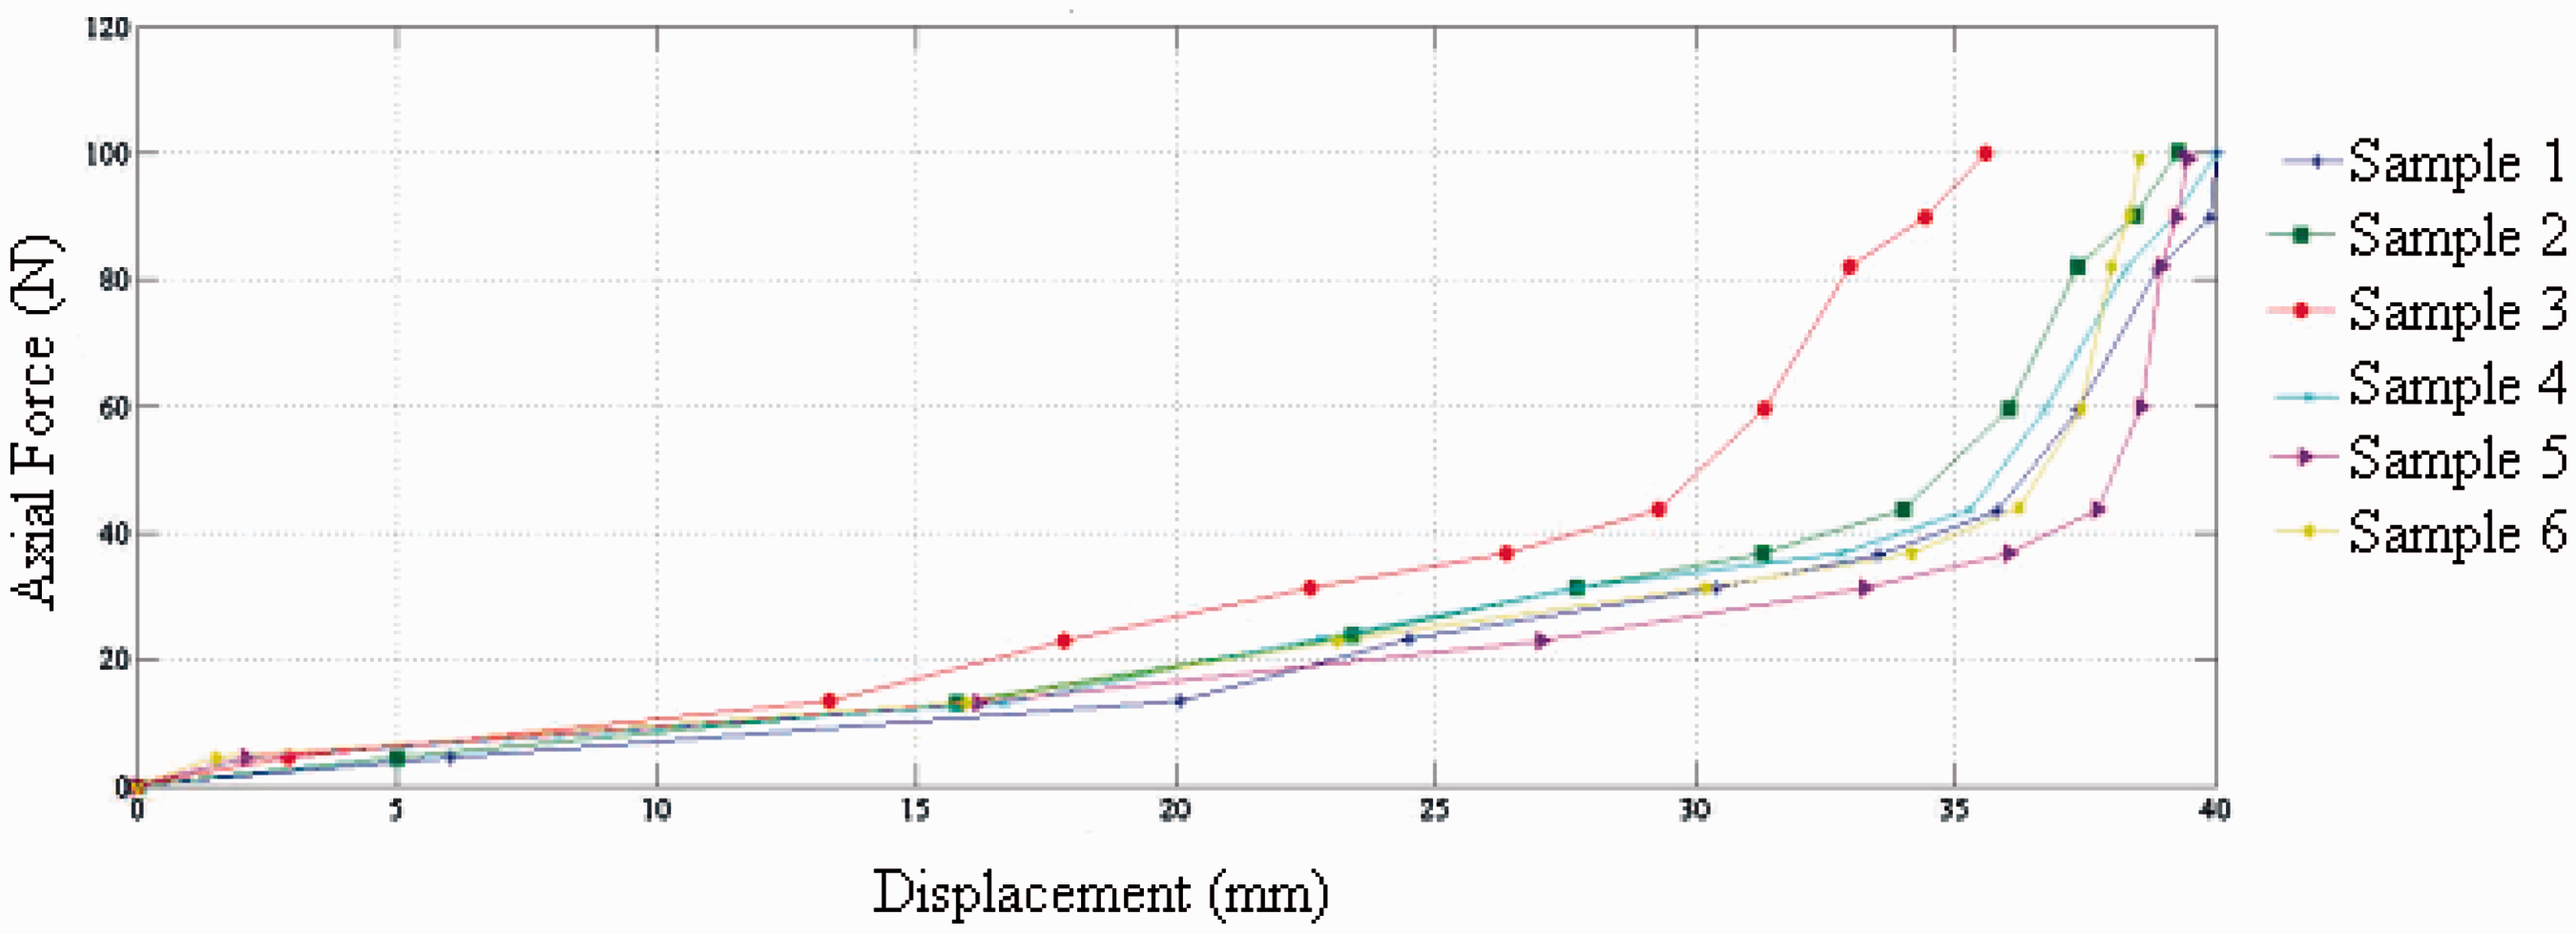
The overall shear stiffness increases with increasing stitch density and the non-linearly for all curves increase in the whole shear process. In order to observe the wrinkling more distinctly, the curves of shear force–shear angles are plotted (Figure 10). There are significant differences between the six curves due to the difference of the fabric density and thickness. The standard deviation and CV% was calculated for all results. Less than 8% CV was obtained in all measurements.
In-plane shear force–shear angle curves of 3D spacer fabrics using frame rig length 200 mm.
The effect of stitch density on shear behavior was significant with less than 5% CV. In the case of 3D spacer fabrics, fabric width decreases rapidly during shear mechanism which results in the spacer yarns to be compressed into a flat form. Thus the shear deformation is influenced also by the presence of spacer yarns in the z direction. It introduces obstacles to the in-plane yarns while shearing.
It is apparent that fabrics using monofilament as spacer yarn generally have higher compression resistance than those using multifilament yarn because the behavior of monofilament yarns is similar to a linear spring when the fabric is compressed. The inherent resilience behavior of multifilament yarns is less than the monofilament. When the results for spacer fabrics using the monofilament and multifilament spacer yarn were compared, it was found that the shear angle of a sample is closely related to the types of spacer yarn as shown in Figure. During the shear process, the gap between the yarns vanishes gradually and the adjacent yarns contact each other, but the width of yarn almost does not decrease. The width of yarn starts to decrease under lateral compression after limiting locking angle during the large shear deformation, which can offer more space for the fabric to be sheared before wrinkling. The wrinkles occur in the central zone of the sample along the load direction due to the lateral compression from the left and right joints of picture frame. The in-plane shear deformation of 3D fabrics is still predominated by the deformation mode.
Determination of shear angle using image analysis method
Figure 10 shows the image of a fabric specimen captured during the loading process without displacement. This image was analyzed to obtain shear angle and displacement of the specimen during the test. The image file string is examined and then the appropriate image reading function is called by MATLAB imread. The image is then converted to a gray image and then normalized to a matrix of values ranging from zero to one. This matrix is returned by the function in the variable I. Image analysis can aid in the determination of the shear angle and displacement at any particular point on the surface of fabric specimen. Grid pattern was applied on the specimen surface before the test and used as the reference points of image analysis. Around 16 points (25 square cells (4 cm2 each) with 90o angle at four points) can be chosen on a 100 mm × 100 mm specimen for image analysis to determine the displacements and shear angles at the chosen points. First, by manually choosing the points on a reference image, the X and Y coordinates of each point can be determined in pixel as shown in Figure 11. The difference of X and Y coordinates of each chosen point between the reference image and the image chosen for analysis represents the displacements in X and Y directions.
Determination of shear angle using image analysis.
Figure 11 shows the main idea of Hough transform applied to find the shear angle in image analysis technique. The Hough transform is widely used in image analysis, computer vision and digital image processing to find shapes in a binary digital image. This approach is preferred when the objective is to find lines or curves in an image. The parameter ρ represents the distance between line and origin, θ is the angle of the vector from origin to this point.
Figure 11 shows the points where the lines intersect giving the distance and angle. This distance and angle indicate the line which bisects the points being tested at each 5 mm displacement in every 30-s interval. It helps researchers to understand more about detections of angles using houghs transform. In Figure 12, it is clearly shown that detected points for two different levels of displacement are highly different, at 0 mm (θ = 90°) and at 10 mm (θ = around 80°). Figure 13 (a and b) shows behavior of specimen during imposing of axial force by considering buckling effects. At 10-mm displacement the lines detected on surface of the specimen clearly indicate that the buckling has not happened as the regular intersection of lines are visible (Figure 13a). But in case of 25-mm dispalcement, the irregular intersections of lines has occured due to wrinkling effects (buckling). The bucking starts at around 20 mm displacement and having maximum buckling at 35 mm. In Figure 13, the X, Y angle is presented on gray image for better understanding in sample and shear angle (13° and 33.22°) is calculated using this information.
Detected lines and points in Hough’s histogram at two displacement levels. Gray image – shear angle at two displacement levels with consideration of buckling effects.

Figure 14. shows the comparison of shear angles between all six samples at different displacement levels using image analysis.
Shear angle using image analysis with respect to displacement.
Comparative discussion
The shear angles are calculated by considering sample length as a substitute for L in equation (2) and it is further used for calculation of shear force. Figure 15 shows the comparison of shear angles between image analysis and experimental measurements for all six specimens. The differences between image analysis and calculated shear angle using sample length at the chosen points are relatively small. Less than 8% CV was obtained in all measurements. It does not show any significant difference until pre-buckling occurs (up to 20-mm displacement) but significant difference is observed after 20-mm displacement. It is also believed that during image processing in MATLAB, detection of X and Y coordinates on the image is not accurate due to wrinkling in the central zone of samples. Also, it is noted that dimension of the frame and rig length can cause big difference in shear angle as shown in Figure 15. Further study is required on the effect of different frame rig length and ratio of frame length-to-specimen size on in-plane shear behavior of 3D spacer fabrics.
Comparison of shear behavior of samples using different methods.
Conclusion
The shear is a complex mechanical behavior of fibrous structures. In woven fabrics, the frictional restraint between warp and weft plays the crucial role in deciding the shear rigidity. Whereas in case of knitted fabrics, the interlooping friction and the stitch density decide shear properties. Measurement of shear in knitted fabrics is relatively more challenging due to instability of normal weft-knitted fabrics. However, warp-knitted and weft-knitted 3D spacer fabrics are relatively stable and can be prepared for shear testing. Clamping of bulkier spacer fabrics needs special care not to induce preloading and buckling before shearing action.
The in-plane shear properties are partially influenced by the spacer yarns. The type of spacer yarn (monofilament or multifilament) has a strong influence on the shear properties. It is found that fabrics using monofilament as spacer yarn generally have higher compression resistance than those using multifilament yarn because the behavior of monofilament yarns is similar to a linear spring when the fabric is compressed. The inherent resilience behavior of multifilament yarns is less than the monofilament. The effect of lycra on in-plane shear behavior of spacer knitted fabric samples is not pronounced as lycra is used only as a spacer yarn with only a small contribution on the surface fabrics. Thus the influence of lycra on inter-yarn friction, resisting the angular deformation, is almost negligible.
The comparison of shear deformation in spacer knitted fabrics using different methods does not show any significant difference until pre-buckling but significant difference is observed after the displacement limit. The shear angles of 3D knitted spacer fabrics using different methods are almost identical to each other before shear locking (buckling) effect takes place. The non-linearity of shear deformation increases after limiting locking angle which initiates the buckling of 3D spacer knitted fabric sample. The image analysis procedure can provide much more detailed information about the shear behavior of 3D spacer knitted fabrics than stroke measurement. Further research needs to be carried out for development in fixture design in order to measure inter-ply shear properties of 3D spacer knitted fabrics.
Footnotes
Declaration of Conflicting Interests
The author(s) declared no potential conflicts of interest with respect to the research, authorship, and/or publication of this article.
Funding
The author(s) disclosed receipt of the following financial support for the research, authorship, and/or publication of this article: This work was supported by project No. L1213 of program NPU in Czech Republic and internal project No. 21025 by students' grant scheme.