
Abstract
The impact response to twill weave carbon fabric/epoxy composite laminate structure has been investigated by employing two types of the stacking sequences of composite laminate structure to low-velocity impact loadings by using a Drop-Weight Machine (CEAST 9350 drop tower). An engine hood is the intended application for the composites. The air-coupled ultrasonic C-scan technique (NAUT21) has been selected in order to characterize impact damage size, delamination, flaw detection, and damage in composite laminate structures. The effect of increasing impact energy was illustrated with both types of the stacking sequences of the composite laminate structures until complete perforation of specimens at 25 J due to degradation of mechanical properties of composite laminates. The failure processes of damaged specimens for different three impact energies (5 J, 15 J, and 25 J) were being evaluated comparing load–displacement curves and images of damaged samples were taken from both impacted and nonimpacted sides through C-scan. The performance index and absorbed energy of the tested structures were investigated. The primary damage modes were found to be fiber fracture, delamination, and matrix cracks.
Introduction
Composite materials have been competitive alternatives to traditional metallic materials for a while, attributed to their lower density, higher stiffness, higher strength, and better fatigue resistance when compared to steel or aluminum. Such properties enable composites to be an ultimate candidate for structural applications for aerospace and automotive products. Carbon fiber–reinforced plastics (CFRP) with laminated structures are one of the most promising types of composites, thus has attracted researcher's attention in the last two decades. The incentives to study the impact damage inspection strategies of CFRP-laminated structures are not only due to the increase in their demand but also due to the fact that CFRP structures suffer more severely from such damage than other composite materials [1]. Ultrasonic testing has been used as a method for examining parts and components in production, as a means of verifying product quality and for inspecting in service parts for damage and defects. ACUT Lamb wave C-scan images were also obtained on a suite of composite sandwich structures with engineered triangular disbonds between the face sheet and honeycomb core of each sample. The results concluded that air-coupled ultrasonic testing seems to be a promising process for achieving composite maintenances [2]. Rheinfurth et al. studied evaluation of fatigue damage in composites with various defects using air-coupled guided waves. The results show that the presented noncontact methodology, observed applicable to all kinds of FRP structural components, is a versatile indicator for manufacturing and operation-induced damage [3]. Stéphane et al. studied the effect of matrix micro-cracking within a SiC–SiC composite on its macroscopic behavior. Experimentally, ultrasonic evaluation under load is used. The results show coupled with an ultrasonic evaluation, which allows the complete assessment of the accumulated damage in the composite structures. Various nondestructive testing (NDT) modalities, such as X-ray CT, thermography, ultrasonic, acoustic emission, etc., have been used to detect and identify damage types in composites. Over the last 20–30 years, there has been significant work performed in experimental ultrasonic testing to detect and characterize damage modes in composites [4–6]. The noncontact air-coupled ultrasonic testing, which has been used to detect the damage in composite structures and also has been employed to inspect a sample with rough surfaces or those with very low or high temperature. The technique is used to detect the decay and defects of material with very high or low temperature, or to inspect curved surfaces of aircraft and the delamination of carbon composite material used for automobiles [7]. The NAUT21 detection system can be used in composite material, lithium ion battery, brake pad, ceramic materials, concrete, and wood, and rubber, plastic, and other materials in the detection. C-scan observations help in determining the shape of the different delamination and their locations in the composite plates [8]. Most of the previous air-coupled ultrasonic investigations were based on through-transmission and pitch-catch configuration of transducers [2,9–12]. Two recently developed technologies, the acoustography and the ultrasound camera (acoustocam), may hold the potential for providing large area ultrasonic images in real time or near real time without the need for performing a C-Scan [13]. The selection of the two different stacking sequences of the composite laminate for this study is due to the recent use of carbon fiber and CFRP in the automotive industry instead of steel and aluminum, especially in engine hoods because material selection for automotive closures is influenced by different factors such as cost, weight, and structural performance. Most of all the automobile hood must fulfill the requirements of pedestrian safety [14]. In the current studies, impact and C-scan of the laminate composite structure have been investigated. Two types of stacking sequences were chosen for this study; [0/90, ±45]2 and [[0/90, ±45]2, [0/90]5]. Damage modes and damage mechanism process of the laminate composite structure under varied impact energies are also discussed. Nondestructive technique has been used to detect delaminated areas of the specimens. Laminates composite structure with different stacking sequence was evaluated on an Instron CEAST 9350 drop tower impact tester. The effects of stacking sequence were discussed. The effect of increasing impact energy was performed on two types of laminates composite stacking sequences at the 25 J level of the impact energy. Furthermore, in order to assess the extent of damage modes and damage process, the damaged specimens were visually inspected.
Materials and experimental
Laminates fabrication
Carbon woven fabrics, 200 g/m2 T300 3 K 2 × 2 twill, were used to fabricate the laminates. EPIKOTETM Resin RIMR135 and hardener RIMH 137 were used with a mixing ratio of 100:30 ± 2 by weight. The setup schematic of vacuum-assisted resin infusion (VARI) used is shown in Figure 1. During the curing process, composite structures were maintained at a constant pressure (0.1 MPa) and 60 ℃ for 6 h. Two stacking sequences were adopted: [0/90, ± 45]2 and [[0/90, ± 45]2, [0/90]5]. The panel size was 150 × 100 mm with nominal thickness 1.5–3 mm. The fabricated composite laminates are intended for use as an engine hood, as shown in Figure 2. The calculated mechanical properties of lamina used are presented in Table 1 and the following equations were used to deduce the mechanical properties of the lamina
Setup schematic of VARI process. Setup schematic of engine hood. Mechanical properties of the lamina.


Impact testing
INSTRON CEAST 9350 drop tower impact tester machine, Figure 3, was used to conduct the impact test. The test was performed by dropping a 16-mm diameter hemispherical striker with 5.277 kg weight on the specimens from various heights. The striker weight includes a carrying weight of 4.3 kg, a striker of 0.63 kg, and additional 0.347 kg. Various energy, 5 J, 15 J, or 25 J, are applied to the laminates. The incident velocities are 1.38, 2.38, or 3.08 m/s and drop heights are 96.7, 289.78, or 483.044 mm, respectively. The tests were done according to ASTM 7136 standard [15]. At least three samples were subjected to the test at each impact energy level.
CEAST 9350 impact tester (a) test chamber and (b) device system.
Noncontact air-coupled ultrasonic testing (NAUT21)
Noncontact detection ultrasonic method is employed such that the coupling agent is not required to be applied on the specimen to eliminate the risk of contamination to the specimen. The facility, NAUT21, is shown in Figure 4.
Noncontact air-coupled ultrasonic testing facility.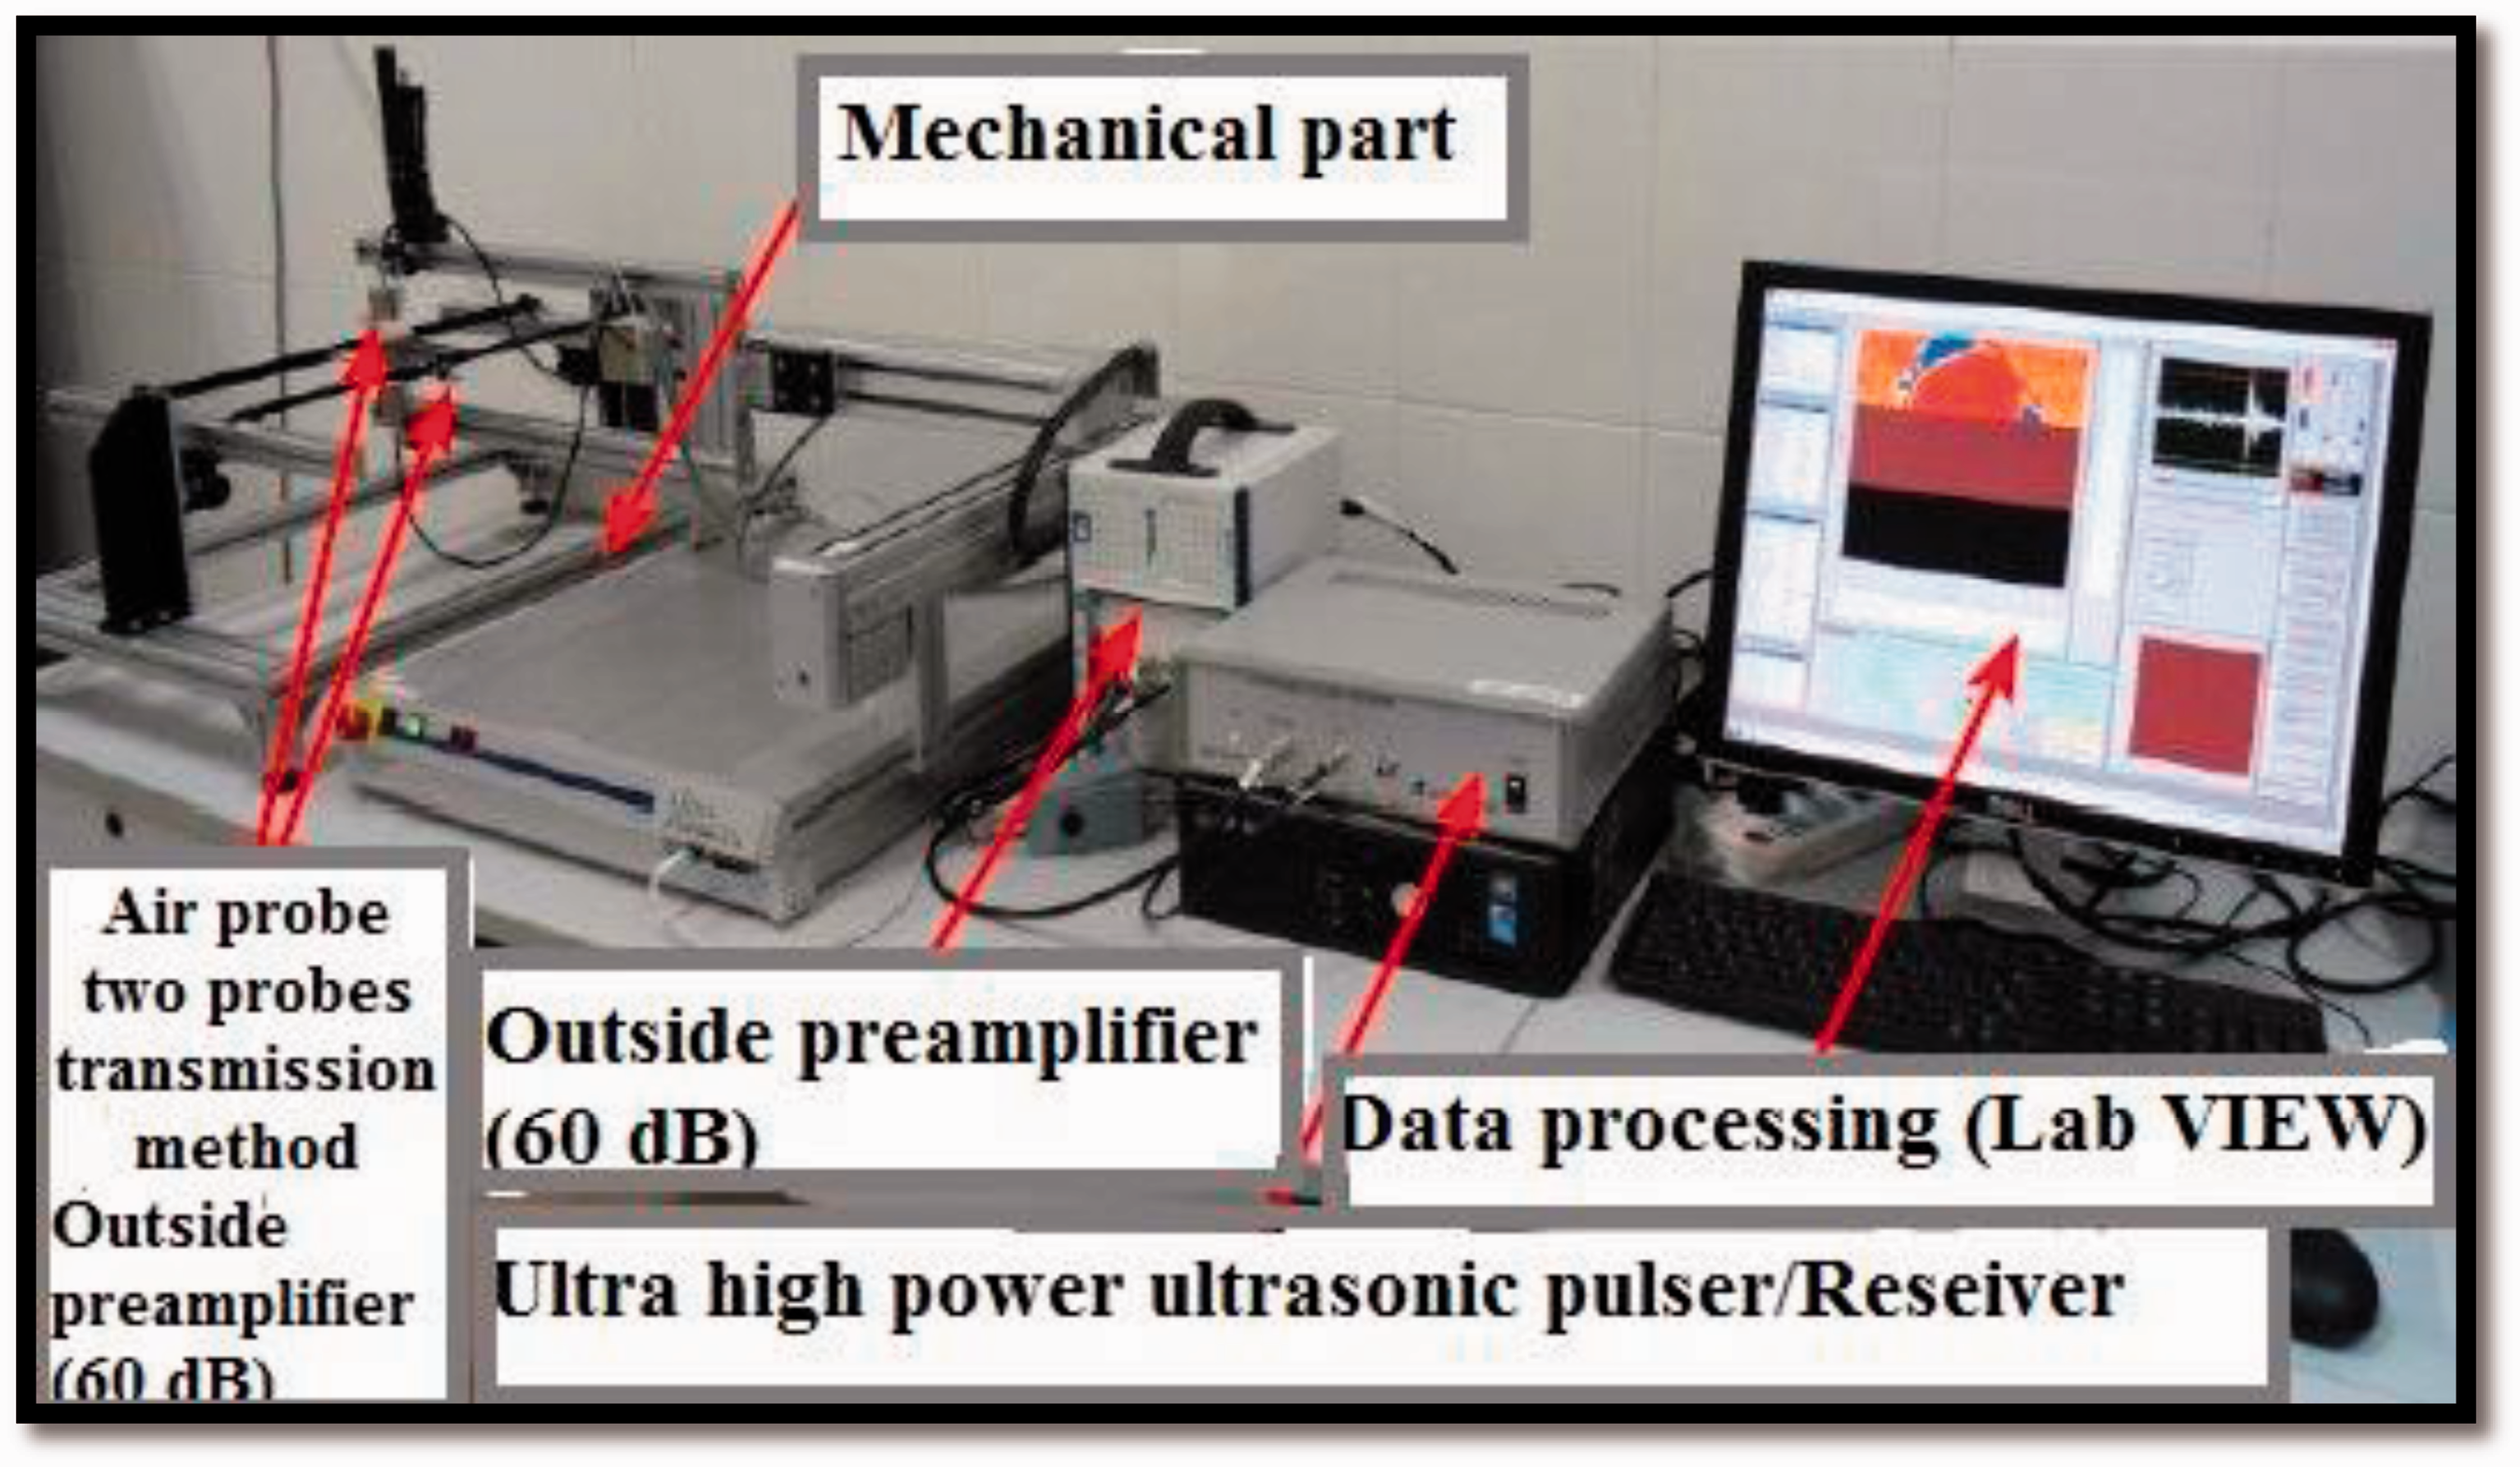
The detection part is shown in Figure 5. It consists of a top probe (pulser) and the bottom probe (receiver) with 400-kHz frequency. The probe diameter is 20 mm.
Detection part with transmission and receiving probe.
Principle of operation procedure
Firstly, the material under inspection was put between the left and right clamp holders (removable to fit the sample size), as shown in Figure 5, and the holder height was adjusted so that the sample is kept at the same distance to the pulser and to the receiver. Secondly, the pulser and receiver devices were moved above and below the undamaged area to get the fundamental healthy material pulse. Thirdly, the testing parameters of: amplitude, frequency, measurement range, and scanning speed were perfectly set. Finally, the sample was scanned in order to get final C-scan image.
Results and discussion
Impact damage testing
The load–displacement plots of different energy levels have been obtained in order to evaluate the impact damage and failure modes of the laminates. A number of tests were performed under three impact energies (5 J, 15 J, and 25 J) in order to examine the damage process of the stacking sequences [0/90, ± 45]2 and [[0/90, ± 45]2, [0/90]5]. The overall damage expansion of specimens after an impact event was evaluated by visual inspection and C-scan. The failure modes involved in impact damage due to varied impact energies of the laminate composite structure of different stacking sequences were characterized as combinations of matrix cracking, surface buckling, delamination, fiber shear-out, fiber fracture, and penetration. The impactor completely perforates the impacted surface, which usually interacted with each other. The delamination of composites under impact is caused by several complex interrelated processes. The delamination was propagated and aligned along the direction of the fibers [8,16,17].
Figures 6 and 7 illustrate the load–displacement plots of laminate composite structures of [0/90, ± 45]2 and [[0/90, ± 45]2, [0/90]5] at 5 J, 15 J, and 25 J impact energy. From Figures 6 to 7, the response of composite laminate structure to impact damage with different impact energy levels (5 J, 15 J, and 25 J) can be observed. The response was found to vary with peak loads, damage modes, curve types, absorbed energy, and displacement and penetration depth in composite specimens. The load–displacement curves are characterized by an increase of the load up to a maximum load termed peak load, followed by a drop after the peak load, force oscillation, matrix crack, delamination, and rebounding case as shown in Figures 6 and 7 at 5 J stage. The maximum load of the first sample, as shown in Figure 6, was 937.3 N, 737.54 N, and 740.9 N when the impact energy was 5 J, 15 J, and 25 J, respectively. While in the second sample (Figure 7), for impact energy of 5 J, 15 J, and 25 J, peak forces were found to be 2197.64 N, 2193.05 N, and 2149.8 N, respectively.
Load–displacement curves for low-velocity impact tests of laminate composites with [0/90, ± 45]2 at 5 J, 15 J, and 25 J. Load–displacement curves for low-velocity impact tests of laminate composites with [[0/90, ± 45]2, [0/90]5] at 5 J, 15 J, and 25 J.
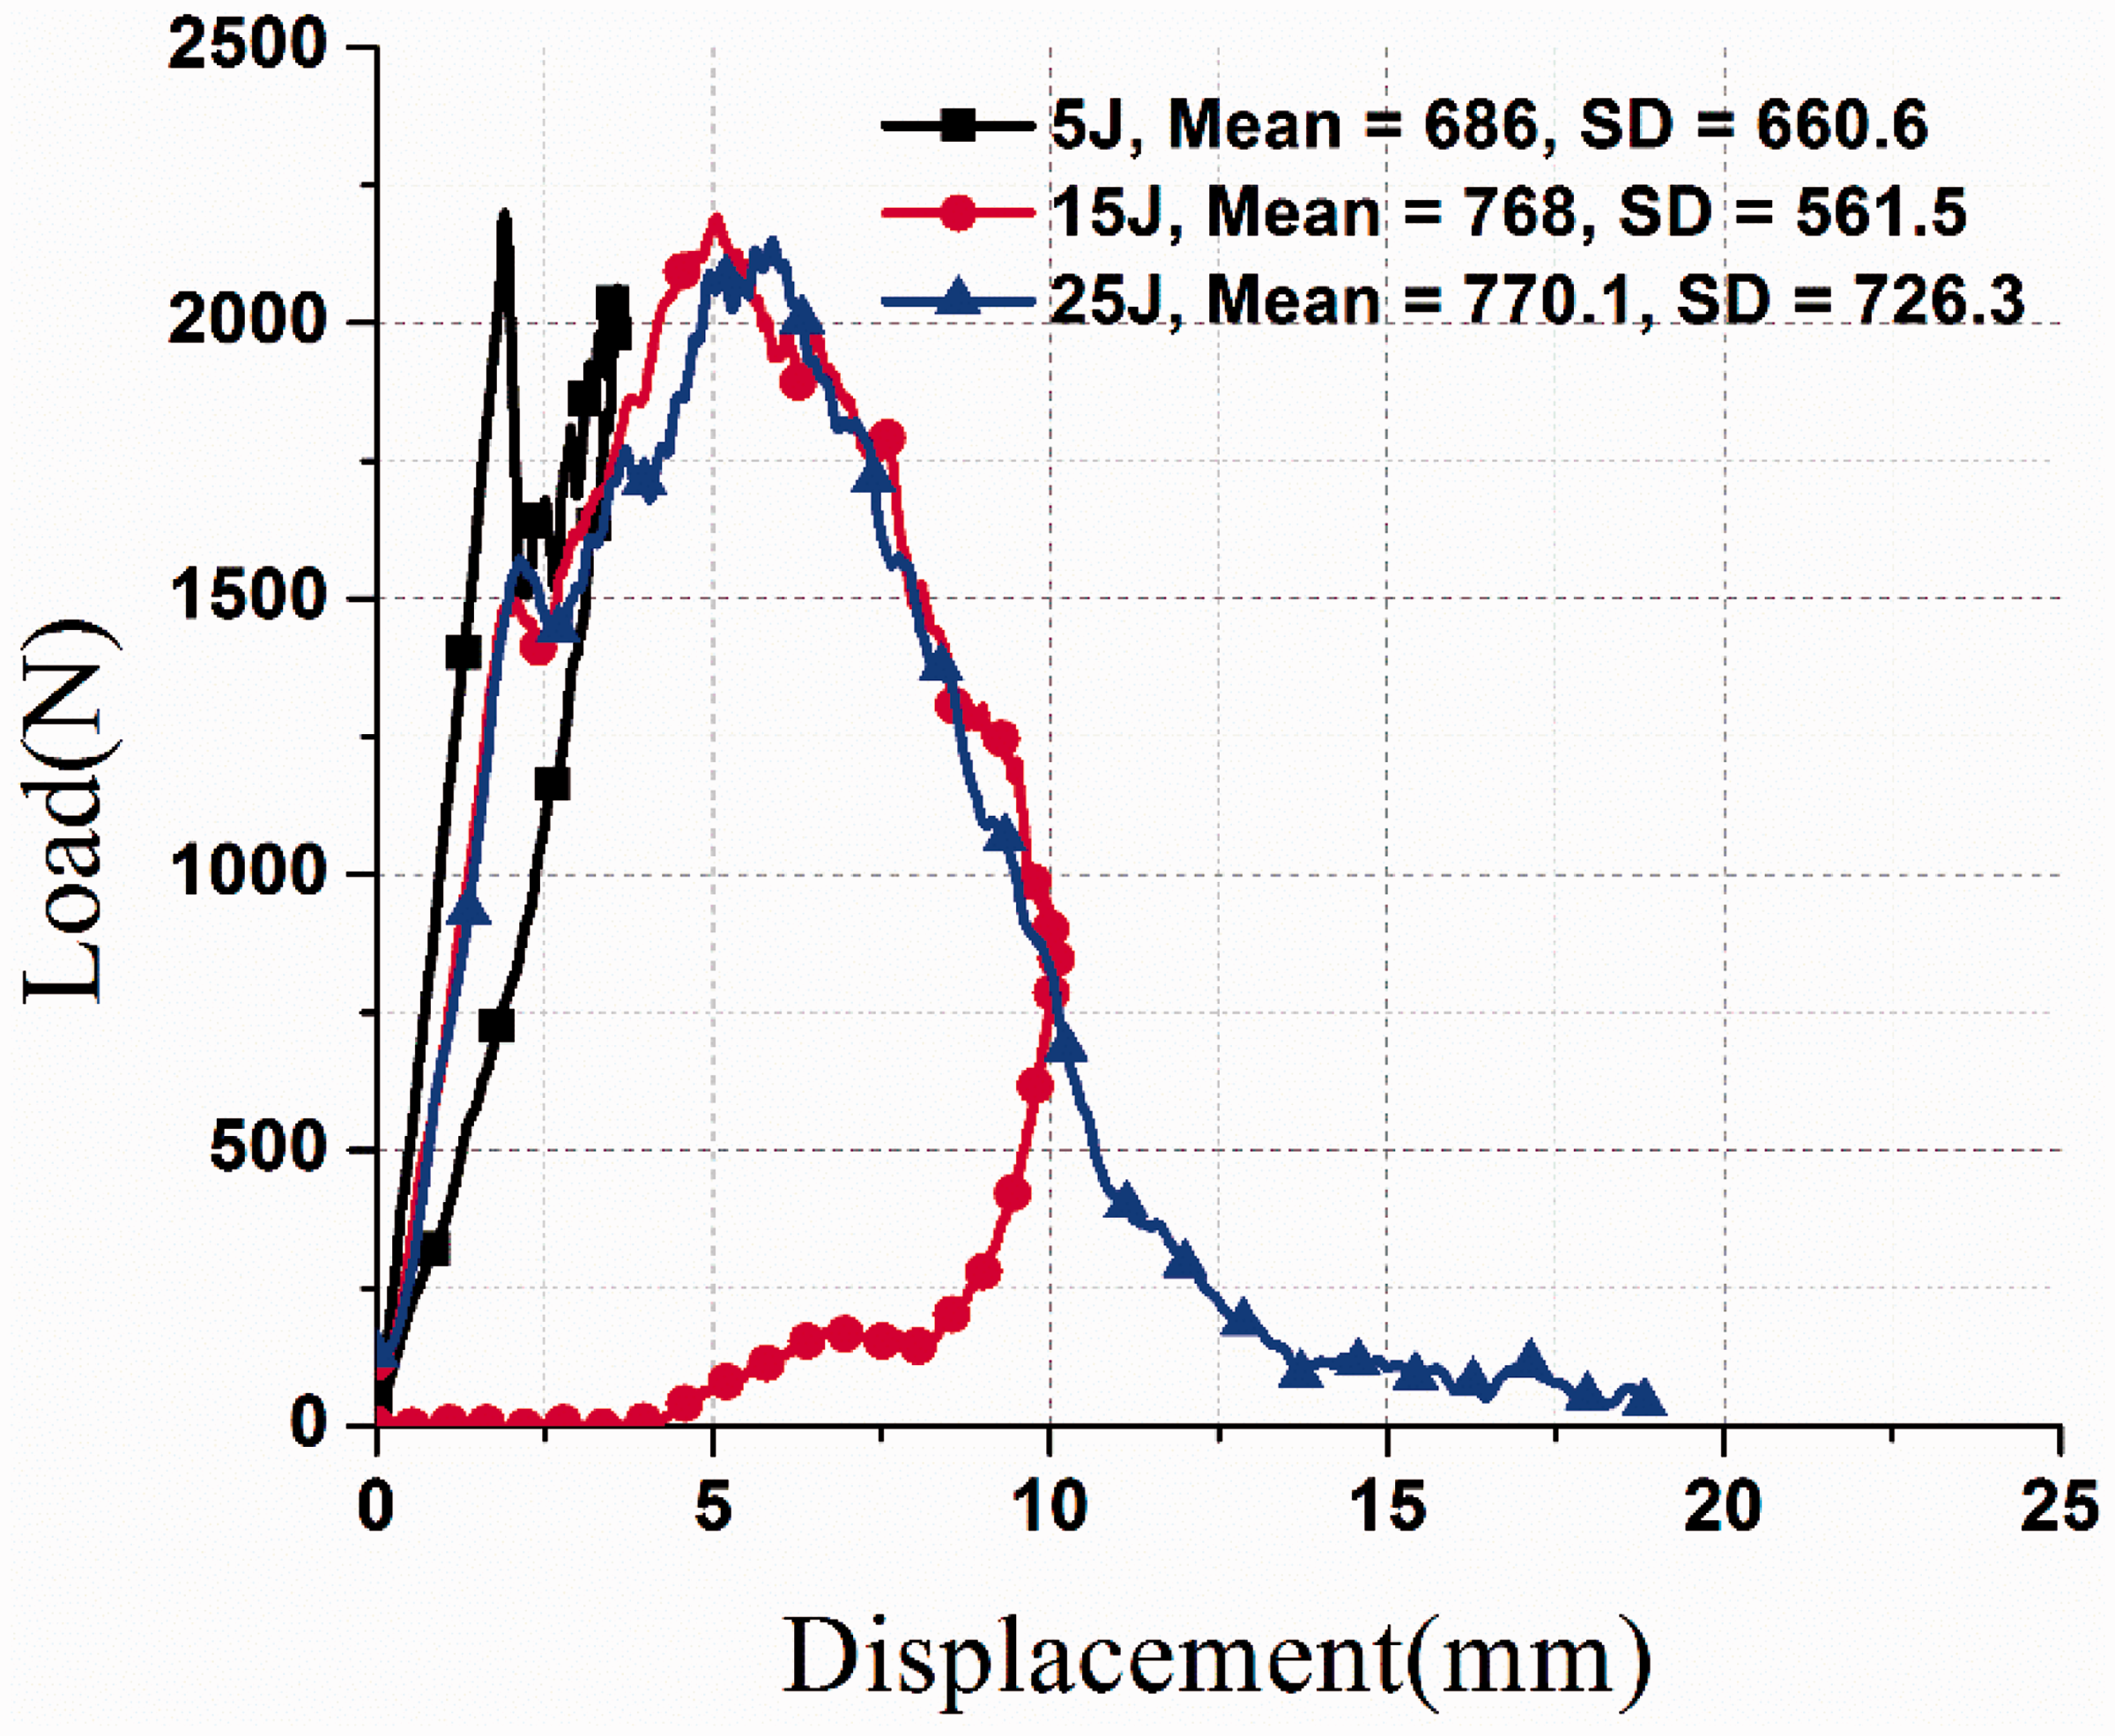
Individually, each curve has an ascending section of loading reaching a maximum load value and a descending section of unloading. After reaching the maximum load value, a descent in force occurs as a result of the impactor bouncing off the examined material surface or damage of the material. The slope of the ascending section of each curve is termed the impact bending stiffness. It represents the stiffness of composites under impact and bending induced at the beginning of the impact process [18]. Typical load–displacement curves of the laminate composite structure subjected to impact loading have shown three kinds of situations, including rebounding in 5 J case due to impact energy was not high enough to infiltrate full penetration and frictional force between the impactor and the composite plate [19], penetration in 15 J and perforation in 25 J. The rebounding case results in closed curves indicating the rebounding of the impactor from the specimen surface. The closed-type curves return from the maximum load or the peak force value toward the axis of abscissas means to 0 N force without a sudden load drop due to the loss of stiffness from unstable damage development [20].
Load–displacement curves, can be classified as, closed-type curves in both types of stacking sequences were observed in 5 J case in Figure 6 and in 5 J and 15 J in Figure 7. Open-type curves were observed in 15 J and 25 J in Figure 6 that could be as a result of variation in layup, the critical point to carry additional load of composite, mechanical properties of laminate, and the amount of the total absorbed energy. The area under the load–displacement curve indicates absorbed energy, which corresponds to the sum of initiation energy at yield point (peak force) and propagation energy. The energy at the maximum load point can also be identified as initiation energy (Ei), and Et represents the total energy absorbed by the specimen at complete penetration. The energy dissipated after the yield point is defined as Ep (propagation energy). Moreover, the ductility index, DI = Ep/Ei reflects the ductility of the material. A higher ductility index would mean that most of the total energy is expanded in crack propagation [21]. When the impact energy increases, the closed-type curve bounds larger areas and displacement increases while rebounding sections become smaller. As the impact energy continues to increase, the curve type changes from the closed to the open type. If a curve is of an open type, the specimen is either penetrated or perforated by the impactor. In [0/90, ± 45]2 stacking sequences, the behavior of the curve after impact tests was observed to be similar only for 15 J and 25 J impact energies, which could be attributed to the composite laminates not being able to carry high loads. Thus, the explanation as to why the high load of the composite laminates in these two levels of the impact energy is almost the same as that shown in Figure 6. In [[0/90, ± 45]2, [0/90]5] stacking sequence, the behavior of the curve after the impact test was observed not to be similar to that of 15 J and 25 J. This could be attributed to the fact that until 15 J, the composite laminate has resistance to impact damage and it also does not reach a critical point to carry high loads in this case. This explains the variation of high load of the composite laminates in two levels of the impact energy as illustrated in Figure 7. Load–displacement curves in Figure 6 show oscillations before peak load for all samples at all energy levels, which may result from vibrations of the supports, some defects in composite laminates, to small delamination in the top and bottom face of laminates, and initiation of damage in the specimens. However, there were no oscillations observed before peak load for all samples at all energy levels, which may be a consequence of the different stacking sequences and the difference in orientation of the layers in composite laminates as shown in Figure 7. The slopes of the curves in the initial stages for different impact energies shown in Figures 6 and 7 were different, which is attributed to: firstly, the fact the peak forces of the slopes represent the initial value of force at which a change in the impact bending stiffness characteristics of the specimen can be detected. Secondly, the parameters of the impact tests play an important role in changing the curve slopes such as impact velocity, height of the striker, boundary conditions, critical point of the composite laminate structure to carry load, and brittle behavior of the structure. As general, the response of a laminate composite structure to impact damage test is dependent upon many factors, such as laminate thickness, ply thickness, stacking sequence, environment, geometry, impactor mass, striker tip geometry, impact velocity, impact energy, and boundary conditions. There are some clear peaks in the curves at 5 J in Figures 6 and 7, these peaks were observed to be steeper than those of other curves at 15 J and 25 J, due to the occurrence of the force versus displacement oscillations, which may be introduced by two primary sources. The first source is the natural frequency (or frequencies) of the impactor, and is often referred to as “impactor ringing.” The ringing may be more severe if the impactor components are not rigidly attached. The second source of force oscillations is the flexural vibration of the impacted specimen. The damage stages for these peaks corresponding to matrix cracks and small delamination may initiate at lower force and energy values. Figures 8 and 9 explain the representative aspects of the failure pictures of the top and bottom surface view of composite laminate structures with two types of the stacking sequence. From Figure 8, the damage modes in face and back surfaces of the composite were found to be nonstatic and show variety in shape of the damage on both sides of composite laminates due to different impact energies, striker velocity, and bending strength of top and back surfaces. As expected, the extent of damage in the specimens is dependent on the impact energy, i.e. overall damage area increases with increase in impact energy attributed to the bending stress. The size of the damage in [0/90, ± 45]2 at 5 J (Figure 8), was higher than [[0/90, ± 45]2, [0/90]5] (Figure 9) due to the different damage formation on the inner layers of the stacking sequences, layup, and total thickness of the laminate composite structure. A sudden drop of the peak load, in the load–displacement curves at the impact energy level (15 J) implies that the indenter has penetrated the laminate composite structure (Figure 8). In Figure 9, it is been observed that there has been small damage detected by visual inspection on the face and the back surfaces of the laminate composite structure due to resistance to damage at 5 J impact energy. However, at 15 J impact energy the impactor comes in contact with the surface and rebounds to the original point, causing damage on the front and back surface of composite without perforation of the specimen. When the impact energy is increased, the displacement also increases resulting in a high damage area, delamination, matrix crack, fiber breakage, and the indenter penetrates the laminates. The specimens are completely penetrated followed by the final failure. This is quite evident in the picture of samples impacted at 25 J as shown in Figures 8 and 9.
Pictures of the top, bottom surface view of [0/90, ± 45]2 at 5 J, 15 J, and 25 J. Pictures of the top, bottom surface view of [[0/90, ± 45]2, [0/90]5] at 5 J, 15 J, and 25 J.

In summary, four failure modes were observed at three levels of impact energy, 5 J, 15 J, and 25 J, which were delamination, matrix crack, fiber failure, and penetration mode. A delamination is a separation of plies, which progresses in the resin-rich area between the plies and it is a result of the bending stiffness mismatch between adjacent layers. The type of matrix cracking is dependent on the global characteristics of the impacted specimens and matrix crushing under the impactor caused by high compressive stresses precedes the other failure mechanisms [22]. Fiber failure occurs later than matrix cracking and delamination in the fracture process and it occurs just below the striker due to local high stresses, and indentation effects in the nonimpacted face, which is attributed to the high bending stresses.
The final failure occurs when the upper skins crush due to compressive failure, or in some cases, final penetration is a macroscopic mode of failure and occurs when the fiber failure reaches a critical extent, enabling the impactor to completely penetrate the specimens. The impact energy penetration threshold rises rapidly with specimen thickness. Other various factors, including fiber sizing, orientation, weaves architecture, matrix type, and interface have an influence on the penetration process [23]. Totally, 18 samples were tested under low velocity impact (LVI) conditions at 5 J, 15 J, and 25 J impact energy. Three samples with two different styles of laminate stacking sequence were chosen for this test. For the same impact energy, the samples of [[0/90, ± 45]2, [0/90]5] show higher peak load, as shown in Figure 10 than [0/90, ± 45]2 due to a difference in the orientation of the layers, thickness of the laminate, and mechanical properties of the laminate.
Peak force versus impact energy of (a) [0/90, ± 45]2 and (b) [[0/90, ± 45]2, [0/90]5].
Performance index
Performance index (PI) is important for the evaluation of crash performance of the tested structures, thus some nondimensional parameters were introduced [24]. The information from the impact tests was used to calculate the absorbing energy moment parameter (AEMP) and PI, respectively. In order to measure the maximum energy that the structure can absorb with respect to the moment produced due to impact load, the AEMP was calculated at various impact velocities (1.38 m/s, 2.384 m/s, and 3.078 m/s).


The PI,


Summary of the results of nondimensional parameters.

Note: AEMP, absorbing energy moment parameter; PI, performance index.
From the results in Table 2, a high PI value was observed in [0/90, ± 45]2 stacking sequence at 5 J, which indicates that the composite laminate plate is able to absorb high amounts of energy without transferring excessive deformation to the inner structure, which is one of the main requirements of a crash resistant structure for transportation. A high AEMP ratio was observed in [0/90, ± 45]2 stacking sequence at 25 J, which indicates a lower amount of load transfer to the supports compared to impact energy. A high AEMP ratio was also observed at the same level of 25 J impact energy in both of the stacking sequences at 3.078 m/s. This shows that specimens exhibit high AEMP when impacted at 3.078 m/s and transfer less amount of energy to the base. High PI values were observed in the same level of the impact energy (5 J at 1.38 m/s), which indicates that the structure has a high crash resistance transferring very little deformation to the base layers.
Absorbed energy analysis
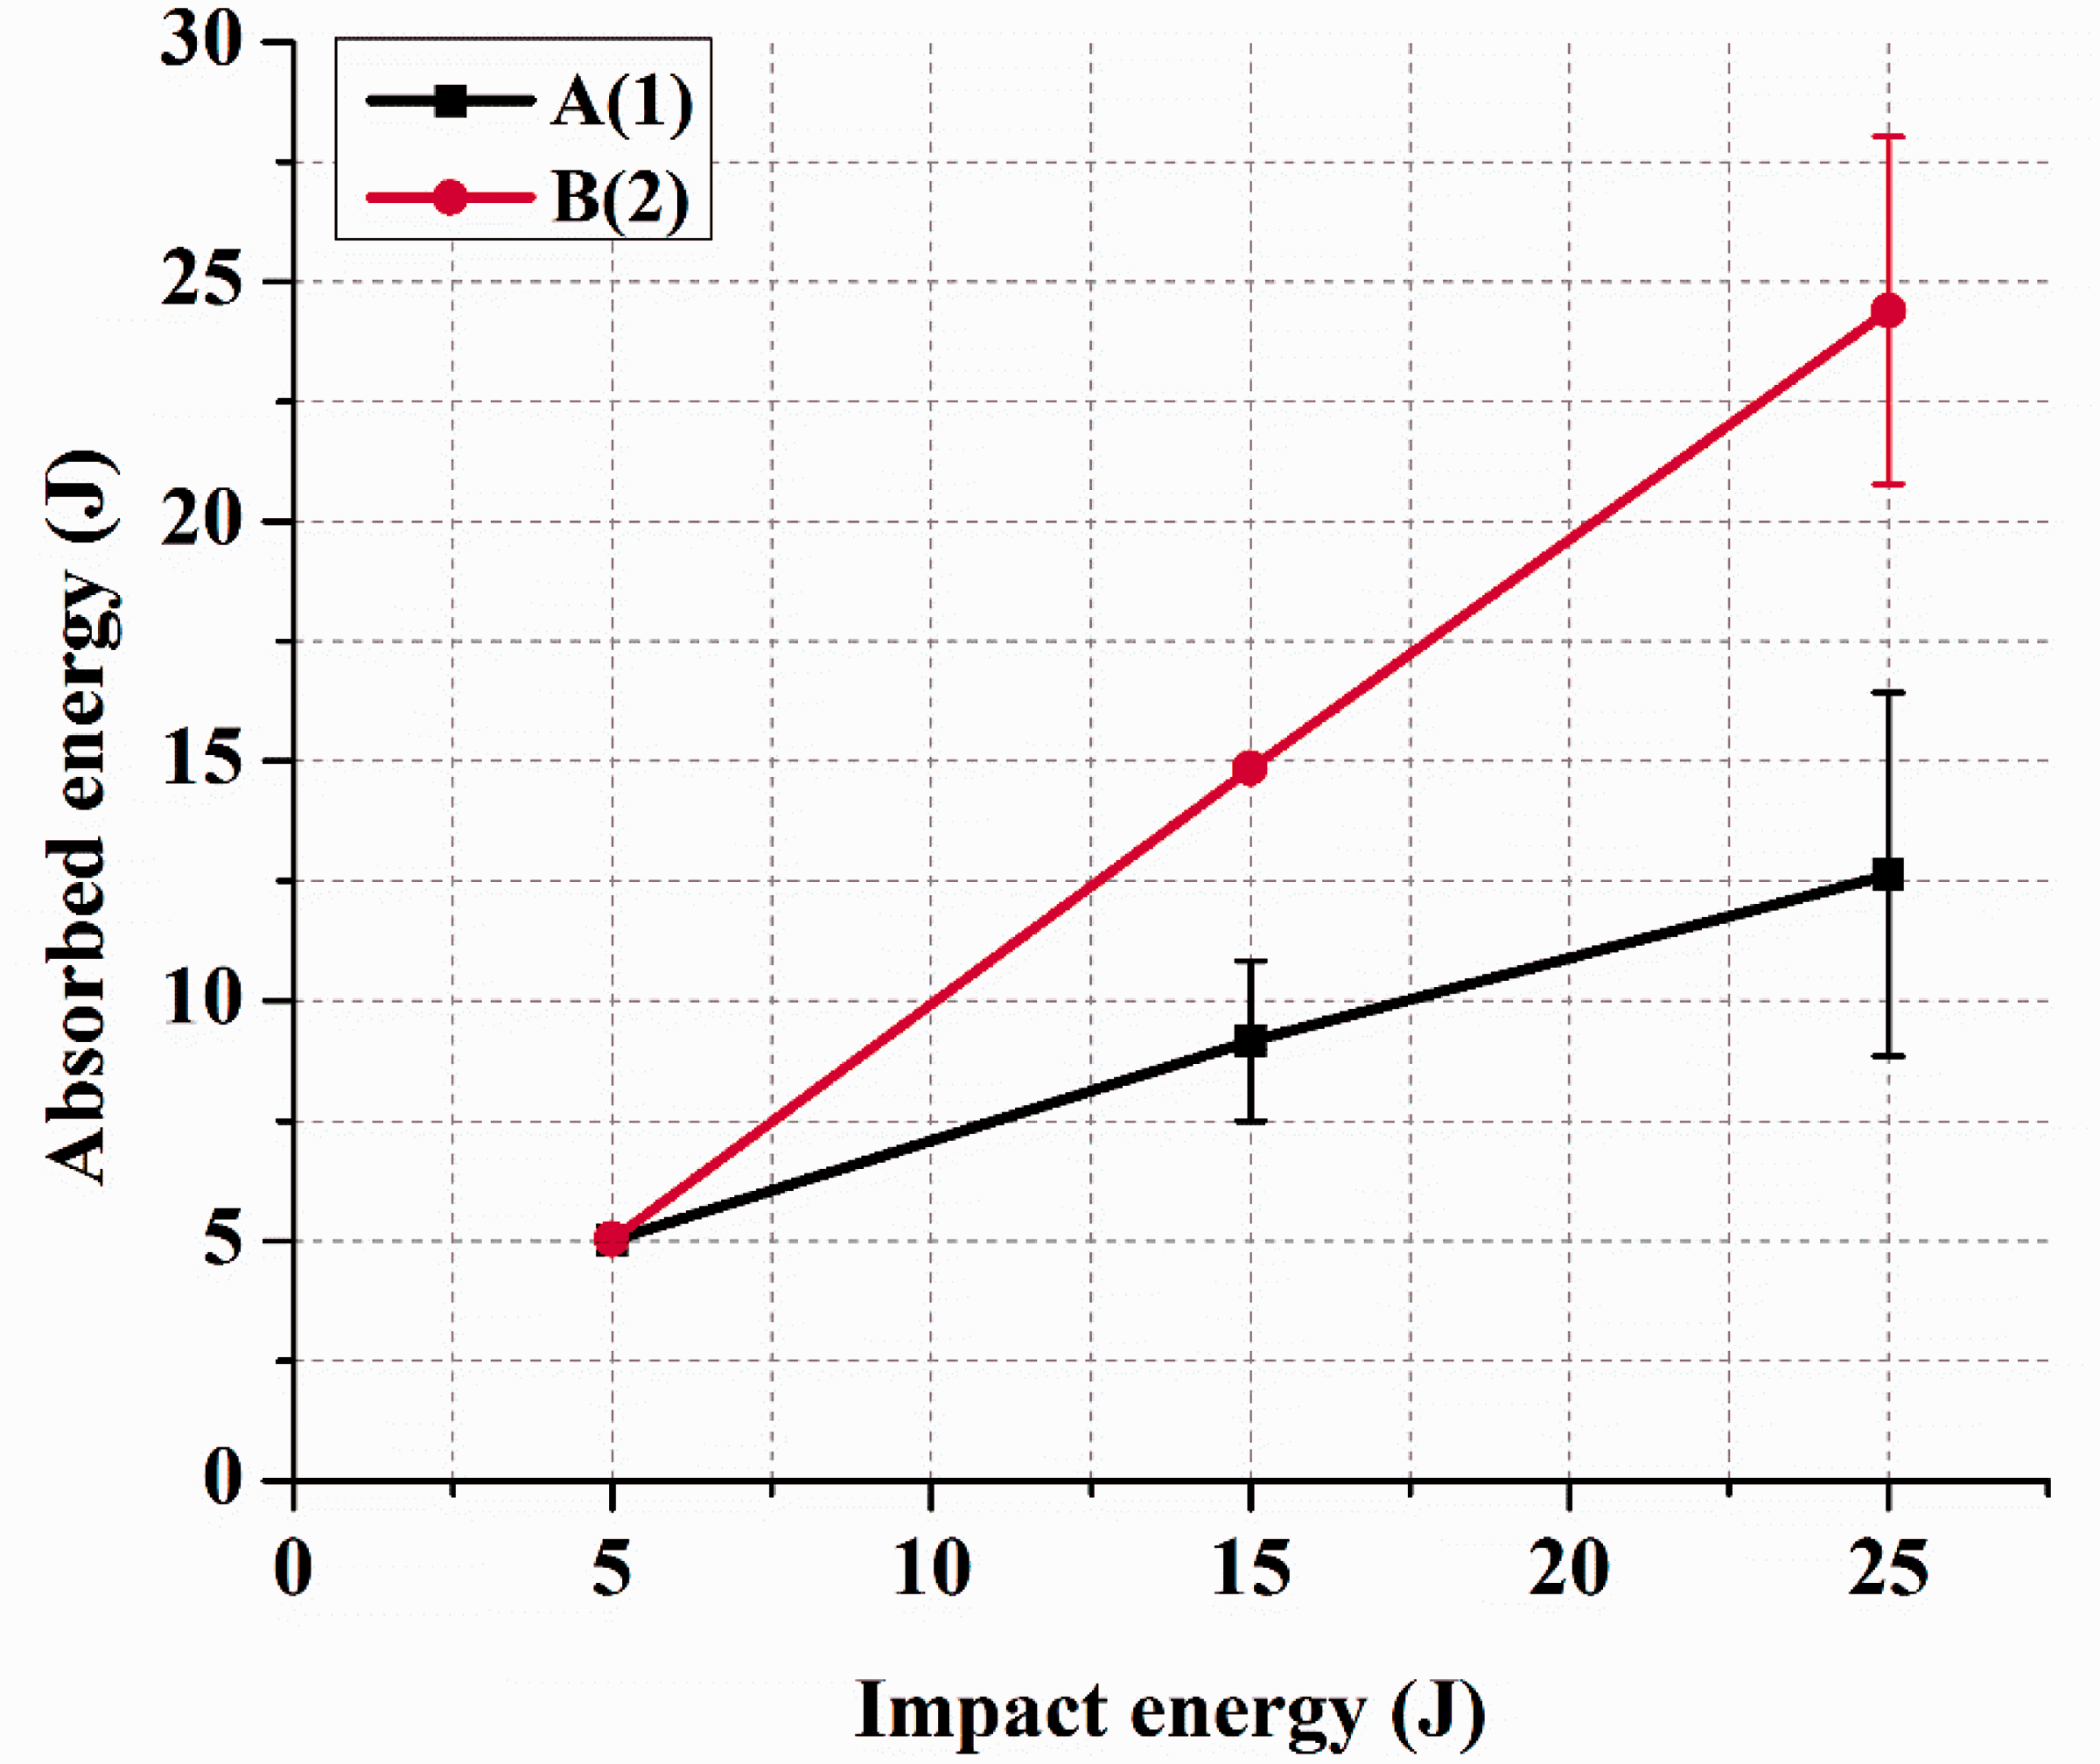
For automotive applications, the absorption capability of a structure is described in terms of specific energy absorption (energy per unit weight) and absorbed vs. impact energy [25]. Absorbed energy after impact tests can be calculated from the load–displacement curves as shown in Figure 11. The area under the slope up to the peak load is the initiation energy, whereas the area bounded by the open force–displacement curve and the displacement axis is the total energy absorbed by the perforated specimens [21]. The absorbed energy increases with the bounded area due to the absorbed energy being equal to energy initiation E
i
at yield point plus energy propagation E
p
, the impact performance of different materials under similar testing conditions, is defined as the ratio between the propagation energy E
p
and the initiation energy E
i
where E
i
and E
p
correspond to the energies absorbed before and after load peak, respectively. The ductility index is small for brittle materials, where most of the energy is absorbed before load peak, and high for ductile materials. The following equation was used to calculate the absorbed energy, according to Kenny and Torre [26] and Torre et al. [27]
Impact energy versus absorbed energy of (a) [0/90, ± 45]2 and (b) [[0/90, ± 45]2, [0/90]5].
Characterization of impact damage
Failure mechanism
The impact damage mechanism in a laminate constitutes a very complex process. It is a combination of matrix cracking, surface buckling, delamination, fiber shear-out, and fiber fracture, etc., which usually interact with each other [28]. In this study, the air-coupled C-scan images were obtained in order to study the possibility to determine the delaminated areas on top, and bottom surfaces of the laminate composite structure as shown in Figures 12 to 15. C-scan technique plays an important role in detecting the damage in composite structures.
Pictures of the top surface view with C-scan of [0/90, ± 45]2 at 5 J, 15 J, and 25 J.
During C-scan mode, the extent of damage and internal inhomogeneity can be examined and the depth profile of the damage can be obtained by varying with colors, which explains the exact locations of damage occurred on top and bottom surface of the laminate composite. From Figure 12, the top surfaces of the visual damage area were compared with C-scan image of [0/90, ± 45]2 at 5 J, 15 J, and 25 J, this method was found to be more convenient and reflected final delaminated area with measurement of failing area, which occurred in composite structures. From the visual shape of the damage and C-scan image, it has been observed that the size of the damage increases with the increase of impact energy. However, the shape is nonstatic depending on the properties of the composite material components and their ability to resist the damage. A delaminated area in C-scan image with blue and yellow colors shows the size and shape of the delamination that occurred in composite plates. The delamination areas are influenced directly by changes in the energy of impact, which could be attributed to different orientation of the plies, which can promote delamination of two adjacent plies due to the stiffness mismatch at their interface [29].
Figure 13 that shows that the damage shape by visual inspection is clearer than C-scan image, but the shape is the same. Due to the distance between the two probes (pulser and receiver), C-scan was operated to detect delamination and damage in the back side of the laminate. The size of the damage was observed to be different as observed with visual inspection and C-scan because the damage in back sides was fiber shear-out, which resulted from the reduced distance between the back side of the composite and the bottom probe (receiver), therefore from the final image, the extent of damage cannot be fully assessed by visual inspection.
Pictures of the back surfaces view with C-scan of [0/90, ± 45]2 at 5 J, 15 J, and 25 J.
From Figure 14, at 5 J C-scan, image shows that delamination occurred on the top surface of the laminate composite. However, by visual inspection, it cannot be clearly seen due to the C-scan images showing only the overlapping delamination area directly under the impact site. In this image at 5 J, there is a small delamination and damaged area on the top surface of the composite laminate structure and at this point the specimen has resistance to damage depending on the properties of the composite materials. At 15 J and 25 J, the damage shape in both of the visual and C-scan inspection is quite in agreement, however the penetration depth in 25 J case is bigger than 15 J, due to the fact that at 25 J the composite material reached the critical point to carry additional load. If we increase the impact energy, we expect same damage behavior will occur in composite materials. A penetration mode shape in the C-scan image was circular in shape, so the center of the damaged part assumed red color.
Pictures of the top surface view with C-scan of [[0/90, ± 45]2, [0/90]5] at 5 J, 15 J, and 25 J. Pictures of the back surfaces view with C-scan of [[0/90, ± 45]2, [0/90]5] at 5 J, 15 J, and 25 J.

From Figure 15, the area that is demonstrated against the C-scan shows only overlapping damage to each layer of the laminate composite structure, leaving single delamination undetected. Accordingly, the size of impact damage at 15 J and 25 J, obtained from C-scan examination is always lower compared to visual inspection. In the C-scan image, it is more convenient to detect delamination, damage size sensitivity, damage location sensitivity, and distance from the surface. At 5 J on the bottom surfaces of composite specimen, small delamination is observed through C-scan images, however, it is not observed by visual inspection because C-scan modes only exhibits the extent of damage and internal inhomogeneity.
Fail area measurement of laminate
From Figures 16 to 17, fail areas of damage progress, which occurred in composite laminate for two types of stacking sequence, which were used in this study, were obtained from C-scan images for each level of the impact energy.
Measurement of damage areas of the top surface of [0/90, ± 45]2 at 5 J, 15 J, and 25 J from C-scan image. Measurement of damage areas of the top surface of [[0/90, ± 45]2, [0/90]5] at 5 J, 15 J, and 25 J from C-scan image.

Measurement of the fail area of the composite laminate.

From observations of C-scan image, a conclusion was drawn that when the impact energy increases, the size of the damage and delamination also increase. All this measurement was conducted from C-scan images. Comparing the stacking sequences, visual inspection and nondestructive techniques are both in agreement that the stacking sequence on the upper face of [[0/90, ± 45]2, [0/90]5] has lower fail area, delamination, indentation in damage location, and damage size sensitivity on the back side of the laminate than [0/90, ± 45]2. This behavior is attributed to variation in stacking of the layers in composite laminate, the total number of the layers, thickness of the laminate, and manufacturing condition.
Conclusions
The LVI behavior of twill weave/epoxy composites was investigated through C-scan nondestructive method. C-scan images showed that the impact damage size estimated by visual inspection was much more extensive in all samples, because the C-scan images show only the overlapping delamination area directly under the impact site, whereas the visual inspection of the laminate surface and macroscopic observations of the sample section shows the extent of the largest single delamination. Comparing stacking sequences used in this study, visual inspection and nondestructive technique both indicate [[0/90, ± 45]2, [0/90]5] as a sample with lower fail area, delamination, indentation in damage location, and damage size sensitivity on the back side of the laminate. This could be attributed to the variation in the stacking of the layers in composite laminate, the total number of layers, thickness of the laminate, and laminate mechanical properties. The PI of the tested structures revealed that the [0/90, ± 45]2 stacking sequence has higher AEMP and PI, which indicates a lower amount of load transfer to the supports compared to impact energy and that the structure has a high crash resistance, transferring very little deformation to the base layers, respectively. According to PI results, the [0/90, ± 45]2 stacking sequences are recommended for application in the automotive field for the manufacturing of engine hoods due to their superior crash resistance property.
Footnotes
Acknowledgments
The authors would like to thank Tongji University for providing the impact damage and C-scan facilities located at the school of aerospace engineering and applied mechanics.
Declaration of Conflicting Interests
The author(s) declared no potential conflicts of interest with respect to the research, authorship, and/or publication of this article.
Funding
The author(s) received no financial support for the research, authorship, and/or publication of this article.