
Abstract
Ultraviolet radiation has become an increasing problem in recent years. It causes many injuries in humans giving rise to the need for protection against ultraviolet radiation, which can be provided by textiles with a high ultraviolet protection factor. This factor can be determined by a variety of established methods. This work focuses on establishing a new methodology for determining the ultraviolet protection factor value using an ultraviolet lamp and a detector. The fabric is to be tested is placed between the ultraviolet lamp and the detector. The new method has the advantages of the existing systems but also minimizes the disadvantages. This will involve a major statistical study using linear regression. The statistical study will be completed with the analysis of residuals using the Shapiro–Wilks test, Gauss–Markov theorem, simple Analysis of variance (ANOVA) procedures, and autocorrelation and partial autocorrelation plots. The measurement error and the deviation of the samples is less than the measurement error committed by the spectrophotometric technique.
Introduction
In recent years, concern about ultraviolet radiation (UVR) has increased dramatically. It is one of the types of radiation emitted by the sun that is neither visible nor can it be felt. UVR is an electromagnetic radiation with a wavelength shorter than visible light and greater than weak X-rays. The range of UVR is also subdivided into UVA (400–315 nm), UVB (315–280 nm), and UVC (<280 nm). The effects of UVR on human health depend on the wavelength of the UVR [1–3]. UVA radiation contributes to the premature aging of the skin, and some recent studies have concluded that prolonged exposure can also cause skin cancer. UVB radiation causes most cancers, cataracts, and sunburn. UVC radiation is extremely harmful, but it is completely absorbed in the atmosphere by the ozone layer before it reaches the earth’s surface.
UVB radiation is more harmful that UVA due to its shorter wavelength, which is more energetic. The intensity of UVB radiation on earth surface is 5 W/m2, while UVA radiation on earth surface is 27 W/m2 [4].
In fact, 99% of the UVR that reaches the earth’s surface is UVA radiation. However, in areas where the ozone layer is thinning, this is not the case. One of the most troubling environmental problems faced by humans is the overall thinning of the ozone layer. This decrease in the thickness of the ozone layer causes an increase in UVB radiation that reaches the earth’s surface. A 1% decrease in the ozone layer will cause an increase in solar radiation at the earth’s surface that could increase the number of cases of skin cancer by up to 2.3% [5].
The demand for information about UVR is increasing, and a number of studies have been carried out to determine appropriate protection measures, including recommendations on use, behavior, and personal protection [1]. The World Health Organization (WHO) recently recommended the use of textiles with high protection factors [6].
Textiles provide protection against UVR, but in many cases, the protection they provide is not sufficient. The ultraviolet protection factor (UPF) is used to assign a textile’s degree of protection. Recent studies have provided information regarding the characteristics that textiles must have in order to offer good UV protection [7,8].
In engineering woven fabric with good UVR protection, the following factors must be considered [9–14]: composition of the fibers (most natural fibers transmit UVR more than synthetic ones), tightness of the weave (the more closely woven the fabric, the less UVR is transmitted), color (light pastel shades of the same fabric type will transmit UVR more strongly than dark colors and will consequently have lower UPFs), stretch (the greater the stretch, the lower the UPF rating), and finishing (UV absorbing chemicals improve UPF) [11]. The more the transmittance of the textile, the less UPF value it will have.
It is also known that worn and faded fabrics may have reduced UPF ratings, while washed cotton and polycotton fabrics, because of fabric shrinkage, slightly improve UPF.
Some studies on different ways to determine the UPF value of fabrics have been published [15–20]. The first system used was the in vivo methodology. This methodology consisted of applying a textile sample to an area of an individual’s back. This area and an unprotected adjacent area of skin were then irradiated with a standardized light that had a spectrum similar to sunlight. The spectrophotometric method is internationally accepted and is the most widely used due to its objectivity and reproducibility.
The measurement device consists of the following items: UV source providing UVR throughout the wavelength range from 290 to 400 nm, integrating sphere, monochromator suited for measurements with a spectral bandwidth of 5 nm or less in the wavelength region 290–400 nm, UV transmitting filter, which transmits significantly only at wavelength less than approximately 400 nm and which does not fluoresce [15].
In according with European Standard EN 13758-1, the UPF of fabric is determined from the total spectral transmittance as follows

The UPF is actually the measure of UVR (UVA and UVB) blocked by the fabric. Higher UPF value means more blocked UVR. UPF is measured by a spectrophotometer [15].
Protection categories of fabrics according to AS/NZ 4399:1996.

Other authors have also recently published a methodology that works outdoors. UVB radiation is detected by dosimeters. This method is based on the known absorbance variation of dosimeters at a determinate wavelength after exposure to sunlight. Dosimeters are placed both above and below the fabric of a garment that is placed on a mannequin. The amount of UVB radiation blocked by the textile is determined from the difference in absorbance between the dosimeters. There are a lot of materials under study as detectors. Wilson et al. [16] use polysulfone dosimeters; Shweikani et al. [17] and Abu-Jarad et al. [18] use CR-39 plastic in their studies, and Kozicki et al. [19,20] use nitro blue tetrazolium chloride as an active compound.
The AS/NZ 4399: 1996 standard is used to classify the textiles. This standard was created in Australia and is a pioneer in the classification of tissues according to their UPF. This standard is intended to provide information to the consumer on the relative capability of textiles and articles of personal apparel to provide protection against solar UVR.
The aim of this study is to develop a new method for determining the UPF with less measurement error than the existing methods commits. Moreover, the suggested method will be easy to use and not expensive so that companies can install it to check the UV properties of fabrics developed. It consisted of an UV lamp which has a known wavelength and a UVR detector which was placed below the fabric. Results were statistically studied in order to validate the method’s usefulness.
Materials and methods
Materials
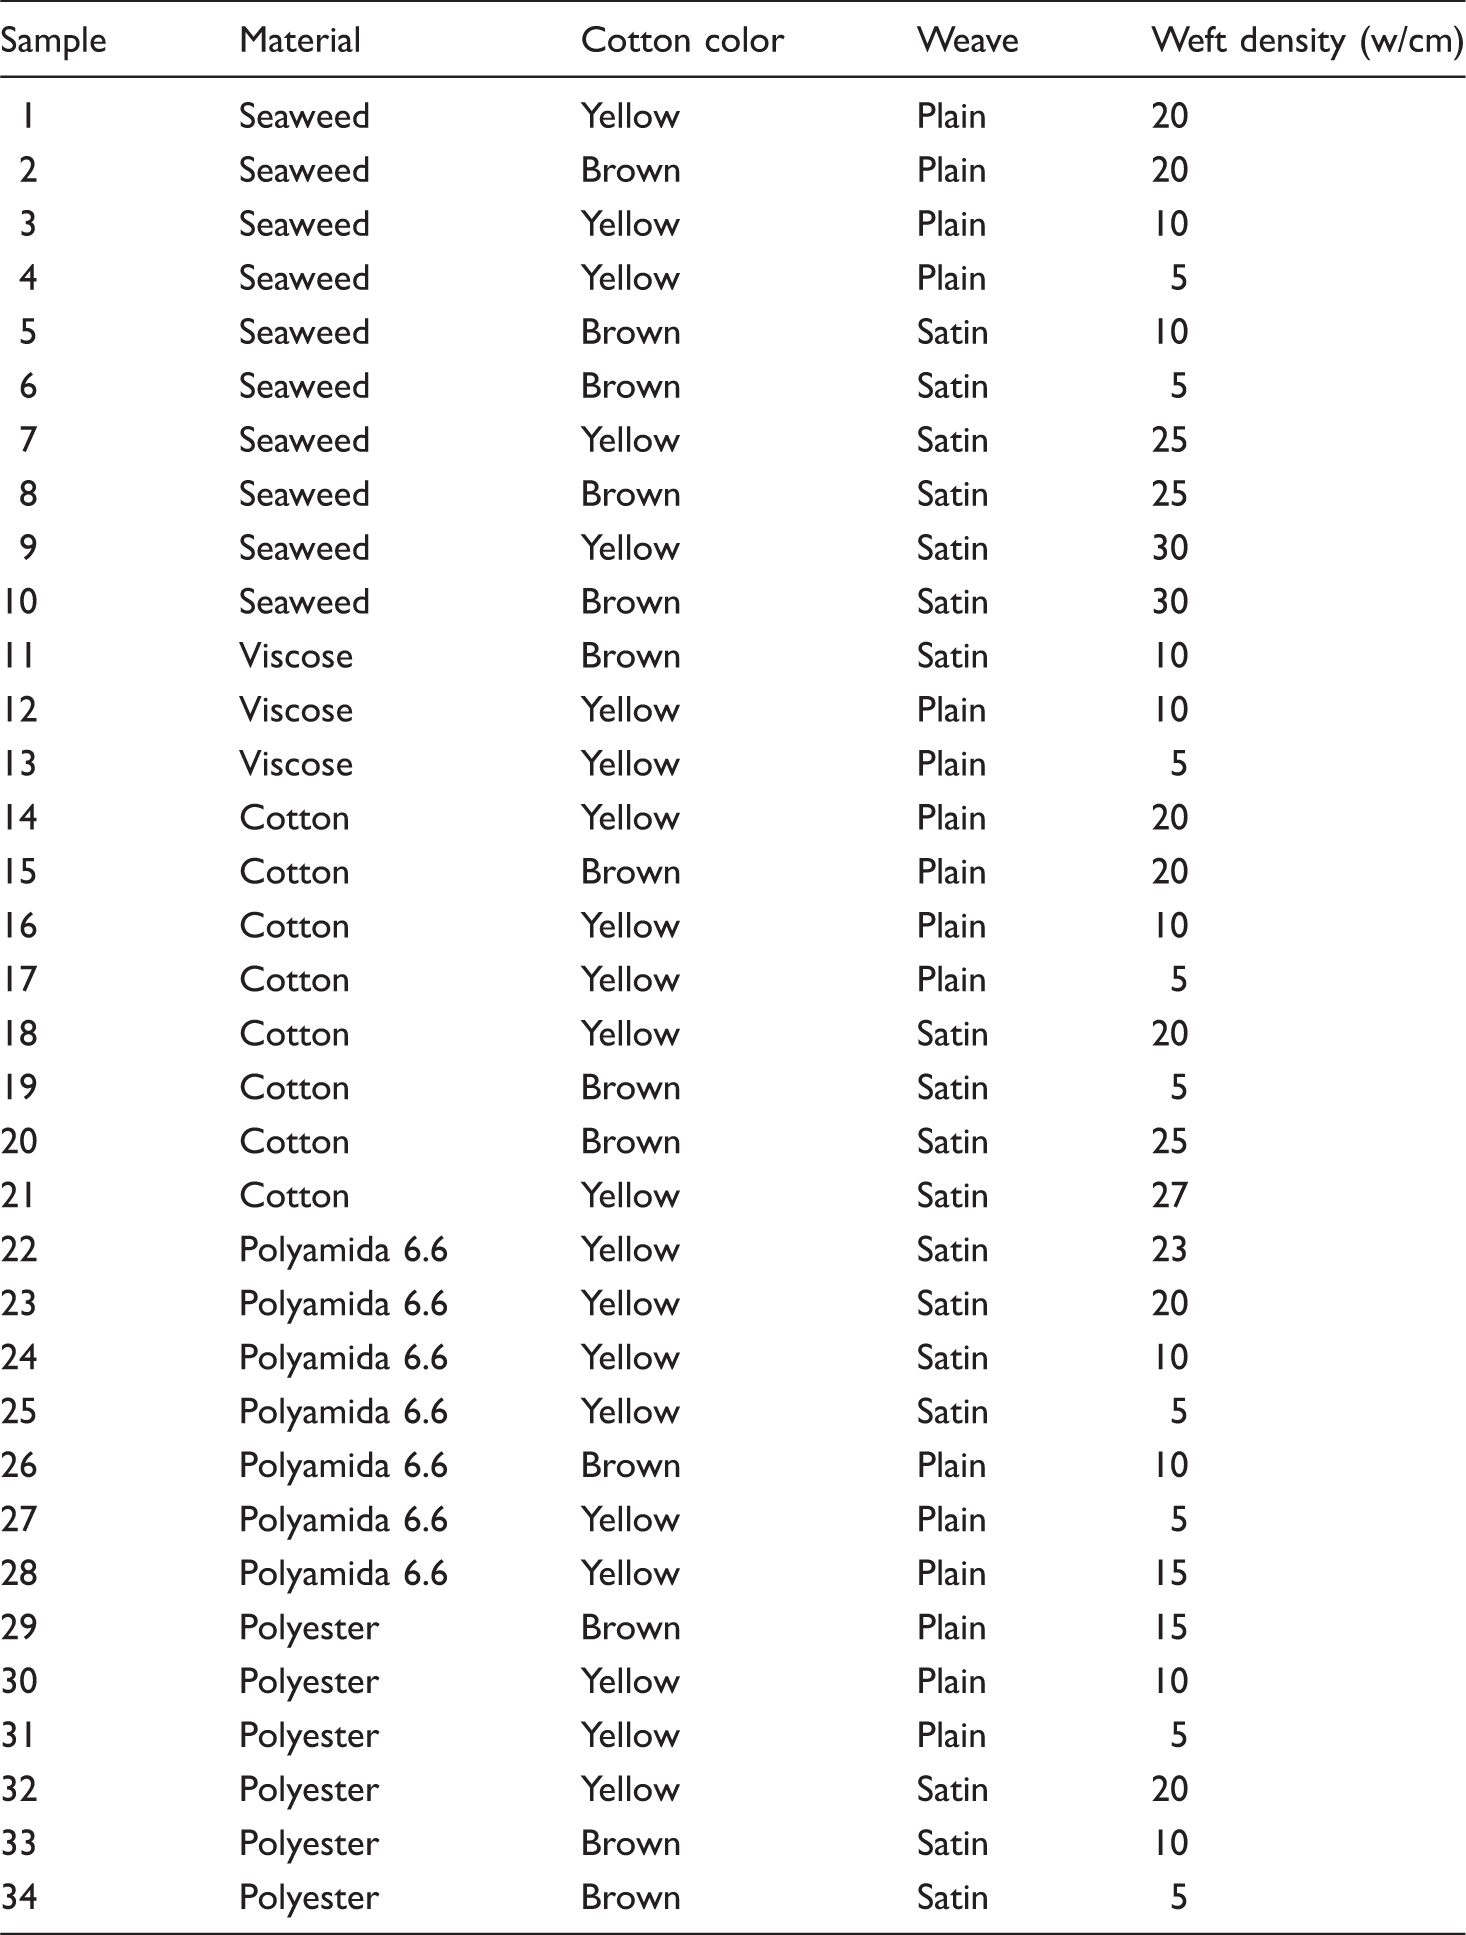
A total of 72 samples have been evaluated. These samples were chosen systematically by varying the parameters in order to obtain a wide sample range. The parameters varied were the weave, the color, the weft material, the weft density, and the fabric weight (g/m2). A standardized warp thread (150 den) and warp density (60 h/cm) was used for all samples.
Constructional parameters of woven samples.
The operating procedure used in the laboratory is fairly simple. First, the samples are prepared and conditioned according to the ISO 139:2005 standard. All samples were extracted from the center of the fabric at an exact distance of 1250 mm from the selvage. The second sample of the same reference was extracted from a distance of 1 cm from the first sample. All samples were conditioning for 24 h at a temperature of 22℃ and 62% of relative humidity. The standardized size of each sample is 10 × 10 cm because it covers the photodetector completely.
Methods
The new system consists of three basic elements as shown in Figure 1. An UVR lamp VL-6.C, a photodetector Delta Ohm HD 2102.2 connected to a computer, and an opaque box that encompasses the entire system to avoid lighting interferences. The photodetector consists on a photoelectric sensor that absorbs all the radiation emitted by the UV lamp.
Diagram of UV measurement system.
As defined previously, the operating procedure used in the laboratory is fairly simple. First, the samples are prepared and conditioned according to the ISO 139:2005 standard. Once the samples have been prepared, the measuring process can begin. The fabric sample covers the detector so that all radiation that reaches the probe must first pass through the sample. A total of 60 measurements of each sample were taken, because the photodetector takes a measurement in a 5-s interval in a total measurement time of 300 s.
The measuring conditions are always identical, and the detector is always placed in the same position on the base lamp. The detector has unique measurement characteristics as the measurement area is about 1 cm2. This means that the detector measures an area of fabric and not an individual point.
The ultraviolet lamp is then turned on with the required bulb, and it takes some time to reach the correct radiation values. Once the test piece is in place, the opaque cover is fitted.
UPF determination is based on measuring the UVR transmission through the textile compared with the radiation without fabric. The emission source emits UVR at two specific wavelengths, 312 nm and 365 nm, which correspond to UVB radiation and UVA radiation, respectively. These two emission sources were chosen because they represent the UVR and are available in the market easily.
Thus, the sample is perpendicularly irradiated, and the UV transmittance of the sample is obtained.
Results and discussion
To determine the UPF factor of the new method, the equation in EN 13758-1 is slightly amended. This is because in the UPF determination of the new method does not scan radiation from 290 to 400 nm. In the new method, there are only two point measurements, 312 nm and 365 nm. The equation of the UPF of the new method is as follows

Both solar irradiance (E) and the erythemal action spectrum with CIE (ɛ) are taken from EN 13758-1, where values are tabulated for each wavelength. The increase in wavelength is 53, which is the difference between both measurements.
The transmittance is determined from the relationship between the irradiance measured by the detector and the initial irradiance at each wavelength

Solar irradiance and relative erythemal effectiveness at 312 and 365 nm according to EN 13758-1.

Regression model
UPF measurements for new method and spectrophotometric method.

In order to model the new method and obtain a correlation with the actual UPF, statistical modeling has been performed as shown in Figure 2.
Statistical linear modeling of the spectrophotometric and new measuring system.
The equation fit for the regression linear model describes the relationship between both methods

ANOVA table for the spectrophotometric method and the alternative method.

The R-squared statistic analysis indicates that the model explains 97.61% of UPF variability. The correlation coefficient is 0.9527, denoting a strong relationship between the variables.
Residuals analysis
Strength and robustness were tested to describe the behavior of the statistical model more precisely. Additional statistical tests were also carried out including the distribution of residuals, residual expectation, homoscedastic behavior, and the covariance of residuals.
Figure 3 shows the density traces and residuals histogram adjusted to normal distribution and the estimated parameters of the fitted distribution.
(a) Density traces and (b) histogram of model residuals.
Analysis of the normality of the residuals
First, the normality of residuals is checked by the Shapiro–Wilks W test. This test is considered one of the most potent tests for normality contrast, especially for small sample sizes (n < 30) [23]. It was postulated that a sample came from a normally distributed population.
H0: Residuals are distributed normally.
H1: Residuals are not distributed normally.
The p value of the Shapiro–Wilks test is 0.5714, higher than 0.05, and therefore, it is not possible to reject the hypothesis that the residuals came from a normal distribution with a confidence level of 95%. That statistical analysis indicates that the model is meaningful.
Analysis of the residual’s homoscedastic behavior
Second, residual’s homoscedasticity is studied. The homoscedasticity is presented in a statistical model when errors occur with the same variance in all observations of the endogenous variable. The statistical model relates the spectrophotometric UPF value to the predicted alternative UPF value. If the model is unbiased, the predicted value is the average of the variable being measured. Homoscedasticity is said to exist when the variance of stochastic errors of the regression is the same for each observation. This quality is necessary, according to the Gauss–Markov theorem, in order that the estimated coefficients in a model are the most efficient, linear, and unbiased. When the variance of each error term is not a constant number, heteroscedasticity is said to exist.
The following equation is established to perform the analysis

And the following hypothesis test:
H0: β1 = 0
H1: β1 ≠ 0
ANOVA table for the residuals of the statistical model.

Autocorrelation analysis of residuals
Finally, the residuals autocorrelation analysis is carried out using autocorrelation and partial autocorrelation plots analysis. These two tests check that there is no residuals autocorrelation. As shown in Figure 4, there is no autocorrelation or partial autocorrelation, as the autocorrelation limits are not exceeded in either case. There is no autocorrelation between the model and the residuals, so the model can be used to determine the real UPF value.
(a) Autocorrelation and (b) partial autocorrelation plots of the residuals.
Measurement error
The most important aspect of this paper is the reduction of measurement error when using the alternative system as compared to the spectrophotometric method. To evaluate the measurement error that both methods possess, a comparison of the measurement UPF standard deviation has been carried out. Analysing a comparison of the standard deviation with the following test hypothesis corroborates this:
H0: σ1 = σ2
H1: σ1 < σ2
The p value obtained by the F-test is 0.00004, so the null hypothesis can be rejected. The standard deviations are not similar. Therefore, the typical deviation of the new methodology is less than the spectrophotometric method.
While, in the spectrophotometric method, the measuring area is the size of a light beam [15], which irradiates the sample, the measurement area is 1 cm2 in the new method proposed in this paper.
As shown in Figure 5, in some samples, the measurement error is equal in the two methods, but the difference of the measurement error in other samples is considerable. The measurement error by the new methodology is lower than the spectrophotometric method.
Spectrophotometric and new method deviation comparison.
It is also worth noting that the new method works better with textiles whose UPF values are low, because in this range of UPF values is where the measurement error is minimized to levels that do not reach the unit. At higher UPF values, the error obviously increases but remains lower in the new method than the spectrophotometric method.
To complete the study of the measurement error, the variation coefficient is studied. The variation coefficient is obtained according to the following equation

The variation coefficient enables the statistical error to be studied in greater detail. The variation coefficient is defined as the deviation of each sample related to its mean.
The variation coefficient obtained by the new method is also lower than the values obtained spectrophotometrically, but in this case, three samples have a greater error with the new method than the spectrophotometric method, as can be seen in Figure 6.
Spectrophotometric and new method covariance comparison.
Samples with an excessive error committed by the new method are 10, 29, 28, and 32. Both samples 10 and 28 have errors slightly above those obtained spectrophotometrically, while samples 32 and 29 have an error about 75% greater. For UPF values lower than 5, the new method gets UPF values below that of the spectrophotometric method. This last point is very important because according to EN 13758-2, classification and marking of apparel, above a UPF value of 40, the textiles are categorized as providing excellent protection (UPF 40+). Below this value, it is important to distinguish between factors, e.g. 20 or 25, because the classification varies from “good” to “very good” [24].
That is, the new method provides lower measurement errors than spectrophotometrically in almost any measurement range of UPF. The new method is especially sensitive in UPF values lower than 5, where the sample is much lighter and the holes generated in textiles are higher. In that UPF measuring range, the new method makes a measurement error less than a UPF point. As noted, the new method measurement error is lower than the spectrophotometric method, and this is because the new method measurement area is approximately 100 times bigger.
Based on spectrophotometric measurements and mathematical calculations, the UPF of a textile is determined in vitro. This technique is the most established test method for the determination of UV protection of a garment. However, the validity and practicality of the in vitro UPF determined in the laboratory has been a controversial issue with regard to its significance in the field. Several studies have verified the in vitro UPF by comparing it with various in vivo test protocols using solar-simulated radiation for the determination of the minimal erythema dose. The spectrophotometric method also has a very high measurement error so that the variation in the measurements is important. This is because the beam measurement is very precise and depending on the irradiation area of the sample, the mean can vary in excess. The new method has the main advantage of the methodology and minimizes spectrophotometric measurement errors. Gambichler et al. [25] in their study comparing in vivo and in vitro methodologies conclude that the results using both techniques are very similar. However, the in vivo method has some drawbacks. The main drawbacks are that in order to obtain a reliable measure of in vivo protection factor requires a sufficiently representative number of individuals subjected to the test; specialized personnel can visually determine the time that has reddened skin without inducing a considerable error. Therefore, it can be considered that this method lacks speed, reproducibility, and objectivity. It is also an invasive method so it can cause irreversible damage in patients. Furthermore, UV dosimetry is a suitable method for quantifying UV transmission through a garment. Chemical dosimeters and biological UV detector films have been used in in vivo-simulated studies in the form of small portable badges monitoring solar UV transmittance through garments on manikins and mobile subjects. As sunlight consists to a considerable extent of diffuse radiation, which is more scattered and absorbed by the fabric than direct radiation, UPF values obtained by measurements in real exposure situations are usually higher than those obtained by conventional in vitro and in vivo testing with collimated radiation beams. Wilson et al. [16] describe a methodology based on polysulfone films. The main drawback of this method is that it only measures UVB radiation absorbed at a given wavelength, being UVA radiation outside the measuring area. The measuring system of the UVR is not suitable to obtain the UPF value. Thus, the discrepancy between laboratory-based testing and field-based measurements may be due to different radiation geometry of UV sources. Taken together, the in vitro method is the most practicable and inexpensive method for routine measurements of UPF, but dosimetry seems to be a highly useful method for determining the UPF in real exposure situations [26].
The new method, therefore, has the advantages of spectrophotometric method being fast, reproducible, and objective. The new method also minimizes the measurement error getting considerably more accurate results. Faced with the impossibility of making measurements in the field of the spectrophotometric method, the new method is similar in this aspect to polysulfonic dosimeters. Polysulfonic system allows making measurements in the field but is impossible to determine the UPF. The new system allows measurements in the field and also determines the UPF with high precision. Therefore, the new method for determining the UPF combines the advantages of existing methods and minimizes inconvenience.
Conclusions
The new method is totally reproducible because it is according the European standards. The samples are prepared and conditioned according to the ISO 139:2005 standard, and the UPF values are obtained according the spectrophotometric method standards. The new method uses as parameters of erythemal effectiveness and solar irradiance the values of EN 13758-1 norm, so the new method proposed is completely reproducible and extrapolated.
The main conclusion is that there is a statistical correlation of 95.27% between the data obtained by the new method and the spectrophotometric method; therefore, the real UPF can be obtained from the alternative method due to the strong correlation between the two methods. It is notable that the statistical correlation is stronger at lower UPF values than at higher values.
The UPF is obtained by the new method and using the following equation

As the analyzed area for the suggested method is wider than the one for the spectrophotometric one, the measurement error in the samples studied is less than the measurement error committed by spectrophotometric technique, and consequently, the deviation of the samples of the new method is lower than the spectrophotometric method.
Footnotes
Declaration of Conflicting Interests
The author(s) declared no potential conflicts of interest with respect to the research, authorship, and/or publication of this article.
Funding
The author(s) disclosed receipt of the following financial support for the research, authorship, and/or publication of this article.