
Abstract
In the present study, the effects of different dopants such as camphorsulfonic acid (CSA), dodecylbenzene sulfonic acid (DBSA) (70 wt% in isopropanol), and dodecylbenzene sulfonic acid sodium salt (DBSANa+), and different solvents such as N-methylpyrrolidone (NMP), and N,N-dimethylformamide (DMF) on the structure and properties of polyacrylonitrile (PAN)/polyaniline (PANI) composite nano/microfiber web produced by the electrospinning technique have been investigated and compared to each other. It has been observed that the nano/microfibers produced from NMP solvent generally had larger fiber diameters than the nano/microfibers produced from DMF, while the use of DBSANa+ resulted in the formation of larger diameters in comparison to other dopants. The use of NMP as the solvent resulted in higher breaking stress values for the reference samples and the composite samples, which contained CSA-doped PANI while the samples that contained DBSA(iso) and DBSANa+-doped PANI showed lower breaking stress values when electrospun from NMP. While the solutions prepared using DBSANa+ showed higher solution conductivities, the use of NMP as the solvent resulted in lower solution conductivity values. Higher conductivity values were obtained with CSA in NMP and with DBSA(iso) in DMF. The conductivity values of the composite nano/microfiber webs were around 10−8 and 10−9 S/cm, which is the range for antistatic materials instead of insulator materials as pure PAN.
Keywords
Introduction
Electrospinning provides a simple method for the production of nanofibers from a variety of polymers such as polyesters, polyamides, polyurethanes, polycarbonates, collagen, gelatin, elastin, chitosan, silk, polyglycolic acid, polycaprolactone, polylactic acid, polyacrylonitrile (PAN) etc. [1–12]. Polymer nanofibers produced by electrospinning technique have interesting features such as high surface area, high porosity, and good mechanical properties etc., which offer great advantages in many different applications [13].
Composite nanofibers that are obtained by the addition of conductive polymers such as polyaniline (PANI), polypyrrole, etc. are ideal candidates for applications such as antistatic textiles, antibacterial textiles, protective clothing, electromagnetic shielding, filtration media, biomedical textiles, charge storage devices, sensors, and actuators [11,14–16]. PANI, on its own, is a promising conductive polymer and increasingly used in the production of conductive composites [17–21]. The conductivity of the resultant composite nanofiber containing PANI depends on the conductivity of PANI, which is mainly determined by the type of the dopant and solvent used [22,23] besides some other factors such as the temperature, humidity, structural defects, and the polymer morphology [24]. The conductivity of the PANI-incorporated composite materials in the form of films is reported to be between 10−11 S/cm and 300 S/cm [23,25].
In the published literature, although there are a great number of studies investigating the properties of PAN/PANI polymer composite films [17–19], there are very limited studies on PAN/PANI composite nanofibers [26,27], which have superior properties (such as high surface area, high porosity) when compared to PAN/PANI polymer composite films especially for filtration media and charge storage devices applications [17]. In the available PAN/PANI nanofiber studies [26,27], no comparative investigation of the effects of different dopants and different solvents on the structure and properties of composite PAN/PANI nanofibers could be seen, although dopants and solvents are expected to influence the final properties of the PANI-incorporated composite nanowebs. The properties of the dopant such as acidity, molecular size, molecular weight, etc. determine the doping ability of the dopant [28–30]. The conductivity of the solutions change depending on the doping level as a result of which the electrospinning process and the properties of the nanowebs produced are influenced. On doping, PANI acquires conductivity and solubility. Higher solubility results in homogeneous composite structure formation and contributes to electrospinnability, while poor solubility results in the absence of PANI in the composite structure.
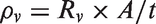
On the other hand, solvent selection is important that it primarily determines the conformation of the dissolved polymer chains, ease of charging the spinning jet, cohesion of the solution due to the surface tension forces, rate of solidification of the jet on evaporation of the solvent. Solvents that yield open conformations of polymer chains are more suitable for electrospinning. Conductivity, surface tension, dielectric properties, and volatility are important solvent characteristics that have direct critical influence on electrospinnability and nanofiber properties [31].
In this study, for the first time, the effects of different dopant types and solvent types on the structure and properties of PAN/PANI composite nano/microfiber webs have been investigated and compared to each other. Camphorsulfonic acid (CSA), dodecylbenzene sulfonic acid (DBSA) (70 wt% in isopropanol), and dodecylbenzene sulfonic acid sodium salt (DBSANa+) were used as dopants. N-methylpyrrolidone (NMP) and N,N-dimethylformamide (DMF) were used as the solvents. The selection of the solvents was mainly motivated by solubility of the polymers in these solvents, their suitability to electrospinning process, and application of practical process conditions. Both NMP and DMF are capable of dissolving PAN and PANI [32,33]. Besides they are both suitable solvents for the electrospinning process [34,35]. Significant contribution to the literature has been provided by studying PAN/PANI composite nano/microfibers instead of composite films and by carrying out comparative studies for the effect of different dopants such as CSA, DBSA, DBSANa+, and different solvents such as NMP and DMF on PAN/PANI composite nano/microfibers. Structural properties (Fourier transform infrared [FTIR] spectroscopy), morphology (scanning electron microscope [SEM]), electrical conductivity, and mechanical properties of the nano/microfibers were investigated. UV–visible spectroscopy was used to investigate the conductive nature of the solutions. Analysis of variance (ANOVA) statistical analysis was performed to determine the significance of the differences between the parameters.
Experimental details
Materials
In the preparation of the electrospinning solutions, PAN (Sigma Aldrich, 181315, average Mw: 150,000 g/mol), PANI (Sigma Aldrich, 530689, average Mw: 65,000 g/mol), camphorsulfonic acid (CSA), dodecylbenzene sulfonic acid (DBSA) (70 wt% in isopropanol) (DBSA(iso)), dodecylbenzene sulfonic acid sosium salt (DBSANa+), N-methylpyrrolidone (NMP), and N,N-dimethylformamide (DMF) were used as received. In the filtration process of PANI solution, Sartorius Stedim filter paper (No. 389) was used.
Methods
Preparation of the electrospinning solutions
List of the solution compositions prepared for electrospinning.

Note: PAN: polyacrylonitrile; NMP: N-methylpyrrolidone; PANI: polyaniline; CSA: camphorsulfonic acid; DBSA: dodecylbenzene sulfonic acid; DBSANa+: dodecylbenzene sulfonic acid sodium salt; DMF: N,N-dimethylformamide.
Pellet formation
After the filtration of the PANI solutions, the solid particles that were precipitated on the filter paper were dried and then used in the preparation of the pellets. The pellets were pressed under a force of 10 tonnes. The areas of the pellets were 1.88 cm2.
Electrospinning
Nanofibers were produced with electrospinning technique. It is a process in which the nanofibers are drawn from a viscous polymer solution on nozzle which is positively charged by the utilization of a strong power supply toward the collector that is grounded. As the solvent in the polymer solution evaporates, dry solid fibers accumulate on the collector in the web form [36]. Illustrated in Figure 1, the electrospinning setup, which is used in this study, contained a syringe pump (SINO MDT, SN-50C6), a high-voltage power supply (Matsusada, 0–50 kV), and a grounded rotating collector.
Schematic of the electrospinning setup used in the production of the nano/microfibers.
Electrospinning solutions were fed through a blunt needle with a diameter of 1.25 mm, using a syringe of 10 ml. The nano/microfibers were collected on a rotating collector that was covered with aluminum foil and nonwoven, respectively. The applied voltage was 15 kV, the distance between the tip and the collector was 10 cm and the flow rate of the spinning solution was 1 ml/h. Electrospinning was performed under standard atmospheric conditions (temperature: (20 ± 2)℃, relative humidity: (65 ± 5)%). The nanowebs were collected for 4 h.
Characterization
EVO MA 10 SEM was used to take SEM images of the nano/microfibers. Before the analysis, the samples were sputter coated with gold layer. Fifty nano/microfibers were randomly selected and measured using Image Analysis Software to obtain the average fiber diameter. Average nano/micro fiber diameters are presented with coefficient of variation (CV%).
FTIR absorption spectra for pure PAN nanoweb and composite nanowebs produced using different types of dopants and solvents were collected with Thermo Scientific Nicolet IS10 spectrometer. The scanning ranged from 4000 cm−1 to 400 cm−1 with a signal resolution of 4 cm−1. A minimum of 16 scans were averaged.
UV–visible absorption spectra of PANI solutions were taken with Shimadzu UVmini-1240 UV–Vis Spectrophotometer in the 300–1100 nm region.
For mechanical analysis, a tensile tester with a 100 N load cell at a crosshead speed of 20 mm/min was used [11,12,37]. The length and width of the specimens were 35 mm and 5 mm, respectively and the gage length was adjusted to 15 mm [11,12,38]. At least 10 specimens were tested for each sample. The thicknesses of the specimens were measured with Mitutoyo Digital Micrometer.
Hanna HI 8633 conductivity meter was used to measure the conductivity of the PANI solutions before and after filtration.
A two-circular probe system connected to Microtest 6370 LCR meter with four wire system was used to measure the volumetric resistances of the pressed pellets and nanowebs. Volumetric conductivity in S/cm was calculated using the volumetric resistance value measured and the geometric dimensions of the samples using the equations (1) and (2) [39,40]

Statistics
The averages regarding the nano/microfiber diameter, breaking stress, breaking elongation, E-modulus, and conductivity were expressed as the mean ± standard deviation. Statistical Package for the Social Sciences 21.0 was used for statistical analysis. ANOVA was performed to analyze the differences between groups. Multiple comparisons were performed using the least significant differences (LSD) post hoc test. Differences were considered significant when p < 0.05.
Results and discussion
Results are discussed below with the relevant tables and figures.
Morphology
Photographs, SEM images (10 kX) and average fiber diameter values of composite nano/microfibers.

 Scale bar is 1 µm
Note: CV: coefficient of variation; NMP: N-methylpyrrolidone; CSA: camphorsulfonic acid; DBSA: dodecylbenzene sulfonic acid; DBSANa+: dodecylbenzene sulfonic acid sodium salt; DMF: N,N-dimethylformamide.

Fiber diameter vs. dopant–solvent combination.

Nano/microfiber diameter distribution histograms of (a) ref–NMP; (b) CSA–NMP; (c) DBSA(iso)–NMP; (d) DBSANa+–NMP; (e) ref–DMF; (f) CSA–DMF; (g) DBSA(iso)–DMF; (h) DBSANa+–DMF.
Emeraldine base form of PANI is black in color and turns into green or blue after doping, depending on the doping efficiency. Green color is a sign of successful doping. Composite nano/microfibers were in different hues of green, while the pure PAN nanofibers were white.
The diameter of the nano/microfibers electrospun from NMP varied between 502 nm and 1293 nm, while the diameters of the nano/microfibers electrospun DMF varied between 276 nm and 1229 nm. Nano/microfibers produced from NMP had generally larger fiber diameters than nano/microfibers produced from DMF (Table 2, Figure 2). The standard deviations of nanofibers electrospun from DMF were smaller than that of nanofibers electrospun from NMP (Figures 2 and 3). This was also apparent from the fiber diameter distribution histograms. The samples electrospun from DMF showed a more uniform fiber size distribution.
Note: DMF: N,N-dimethylformamide; NMP: N-methylpyrrolidone.
Solution conductivity (before and after filtration) and pressed pellet conductivity measurements.

Note: NMP: N-methylpyrrolidone; CSA: camphorsulfonic acid; DBSA: dodecylbenzene sulfonic acid; DBSANa+: dodecylbenzene sulfonic acid sodium salt; DMF: N,N-dimethylformamide.
With the 10% PANI addition, variations in diameters were observed depending on the dopant and the solvent used. The use of NMP as the solvent resulted generally in larger nano/microfiber diameters (Table 2, Figure 2) and wider diameter distributions (Figure 3) with all the types of dopants used. When DBSANa+ was used as the dopant, dramatic increases in nano/microfiber diameters were observed, which is considered to be mainly due to the higher viscosity of the solutions prepared with DBSANa+. The viscosities of PANI.CSA/DMF, PANI.DBSA(iso)/DMF, PANI.DBSANa+/DMF were measured as 270 mPa s, 260 mPa s, and 854 mPa s, respectively. Another factor might have been the larger molecular size of DBSANa+ [29] preventing the closer packing of the macromolecules and thus resulting in the formation of thicker nano/microfibers.
ANOVA results showed that some of the dopants and solvents affected the average nano/microfibers diameters significantly. The average diameters of DBSA(iso)–NMP, DBSANa+–NMP, DBSANa+–DMF nano/microfibers were significantly different from the mean fiber diameter of their corresponding reference samples (PAN–DMSO and PAN–DMF, respectively) at 0.05 significance level. Furthermore, the diameters of nano/microfibers electrospun from solutions in NMP significantly differed from the diameters of nanofibers electrospun from solutions in DMF depending on the ANOVA performed at 0.05 significance level.
Analysis of FTIR spectra
FTIR spectroscopy was used to compare the structural differences between the composite nano/microfibers produced using different dopants and solvents besides confirming the presence of PANI in the composite fiber structure.
The FTIR spectra of PAN nanofibers and PAN/PANI composite nano/microfibers electrospun from solutions in DMF are presented in Figure 4.
FTIR spectra of (a) PAN–DMF; (b) PAN–PANI–DBSA(iso)–DMF; (c) PAN–PANI–CSA–DMF; (d) PAN–PANI–DBSANa+–DMF in the 4000–700 cm−1 region.
Pure PAN nanofibers display the characteristic absorption peak of nitrile groups at around 2242 cm−1 besides a series of characteristic peaks in the regions of 2930–2870 cm−1, 1460–1450 cm−1, 1380–1360 cm−1, and 1290–1260 cm−1, which are attributed to the vibrations of different modes of methylene group [51–57]. In the spectra of PAN/PANI composite nano/microfibers (Figure 4 (b) to (d)), a broad peak appeared at around 3390 cm−1, which was due to the free imine (–NH) groups of PANI. Also a shoulder observed at around 3243 cm−1 showed the aromatic C–H stretching of PANI [58]. For the sample in which PANI was doped with CSA (Figure 4(c)), a peak at around 1735 cm−1 was due to the carbonyl (C=O) groups of CSA and showed the presence of CSA in the composite nano/microfiber structure [59]. For the samples in which PANI was doped with DBSA(iso) and DBSANa+ (Figure 4(b) and (d)), the intensity of the peak at around 2852 cm−1 increased due to the symmetric –CH2 stretching of DBSA. The peak at around 1505 cm−1 was unique for the sample in which PANI was doped with DBSANa+ and was attributed to the aromatic benzene ring stretching of DBSANa+ [60]. It is also reported in the literature that the peak at around 1500 cm−1 is due to the benzene ring of deprotonated emeraldine base [61]. For the PAN/PANI composite nanowebs, the intensity of the peak at 1042 cm−1 which is assigned to the S=O vibrations increased as a result of the sulfonic acid groups of the dopants [61].
In Figures 5 and 6, FTIR spectra of PAN–PANI–CSA–DMF and PAN–PANI–CSA–NMP were compared in the regions of 4000–2100 cm−1 and 1950–700 cm−1, respectively. While no significant differences could be observed in the 4000–2100 cm−1 region (Figure 5), some spectral changes were observed in the 1950–700 cm−1 region (Figure 6). When NMP was used as the solvent, a peak appeared at 1665 cm−1 due to the amide carbonyl group in NMP, which showed the presence of residual solvent in the sample. The IR spectra shown in Figure 5(b) show the presence of unconjugated C=C band indicating the reaction between acrylonitrile and aniline units. Positioned at 1624 cm−1 in the presence of DMF, the band is shifted to 1613 cm−1 when NMP was used as solvent. These results suggest that the unconjugated C=C bond position seems to be sensitive to the type of solvent used. Besides, a signature band appeared at 1505 cm−1 with the use of NMP. The peak at 1505 cm−1 is reported to be due to the benzene ring of deprotonated PANI [61]. PANI macromolecules are unfolded in it, but the interaction of NMP with CSA is so strong that the doped PANI is unstable and apt to dedoping [62]. The dedoping is due to the C=O groups in NMP forming hydrogen bonds with the acid dopant and inhibiting the doping of PANI by the acid [63].
FTIR spectra of (a) PAN–PANI–CSA–DMF; (b) PAN–PANI–CSA–NMP in the 4000–2100 cm−1. FTIR spectra of (a) PAN–PANI–CSA–DMF; (b) PAN–PANI–CSA–NMP in the 1950–700 cm−1 region.

UV–Visible spectroscopy
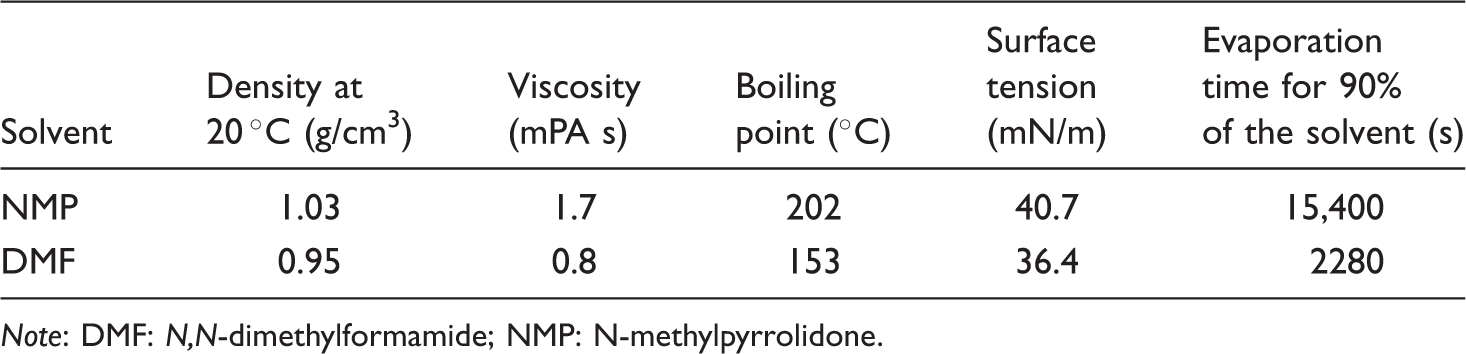
UV–vis spectroscopy was carried out to investigate the changes in the doped state of PANI with different dopants in different solvents. The PANI emeraldine base shows two characteristic peaks at 330 nm and 630 nm. The peak at 330 nm is due to π−π* transition of benzene ring while the peak at 630 nm, is due to the π−π* transition of quinoid ring. After protonation, the peak at 630 nm disappears, and two additional peaks at around 450 nm and 800 nm, which are attributed to the formation of delocalized polarons, occur [21]. Figures 7 and 8 show the UV–vis spectra of PANI solutions with different dopants in NMP and DMF, respectively. The appearance of the peaks at around 450 nm and 800 nm showed the conductive nature of the solutions in which PANI is doped with CSA. While the solutions with DBSANa+ showed the characteristics of the base polymer, solutions with DBSA(iso) showed the characteristic peaks of both the base polymer (at around 330 nm and 630 nm) and doped polymer (at around 440 nm and 800 nm). The absorbance values of the solutions prepared with CSA were higher than that of the solutions prepared with DBSA(iso) both in NMP and DMF, which showed that the concentration of PANI doped with CSA was higher.
UV–vis spectra of (a) PANI.CSA/NMP, (b) PANI.DBSA(iso)/NMP, and (c) PANI.DBSANa+/NMP solutions. UV–vis spectra of (a) PANI.CSA/DMF, (b) PANI.DBSA(iso)/DMF, and (c) PANI.DBSANa+/DMF solutions.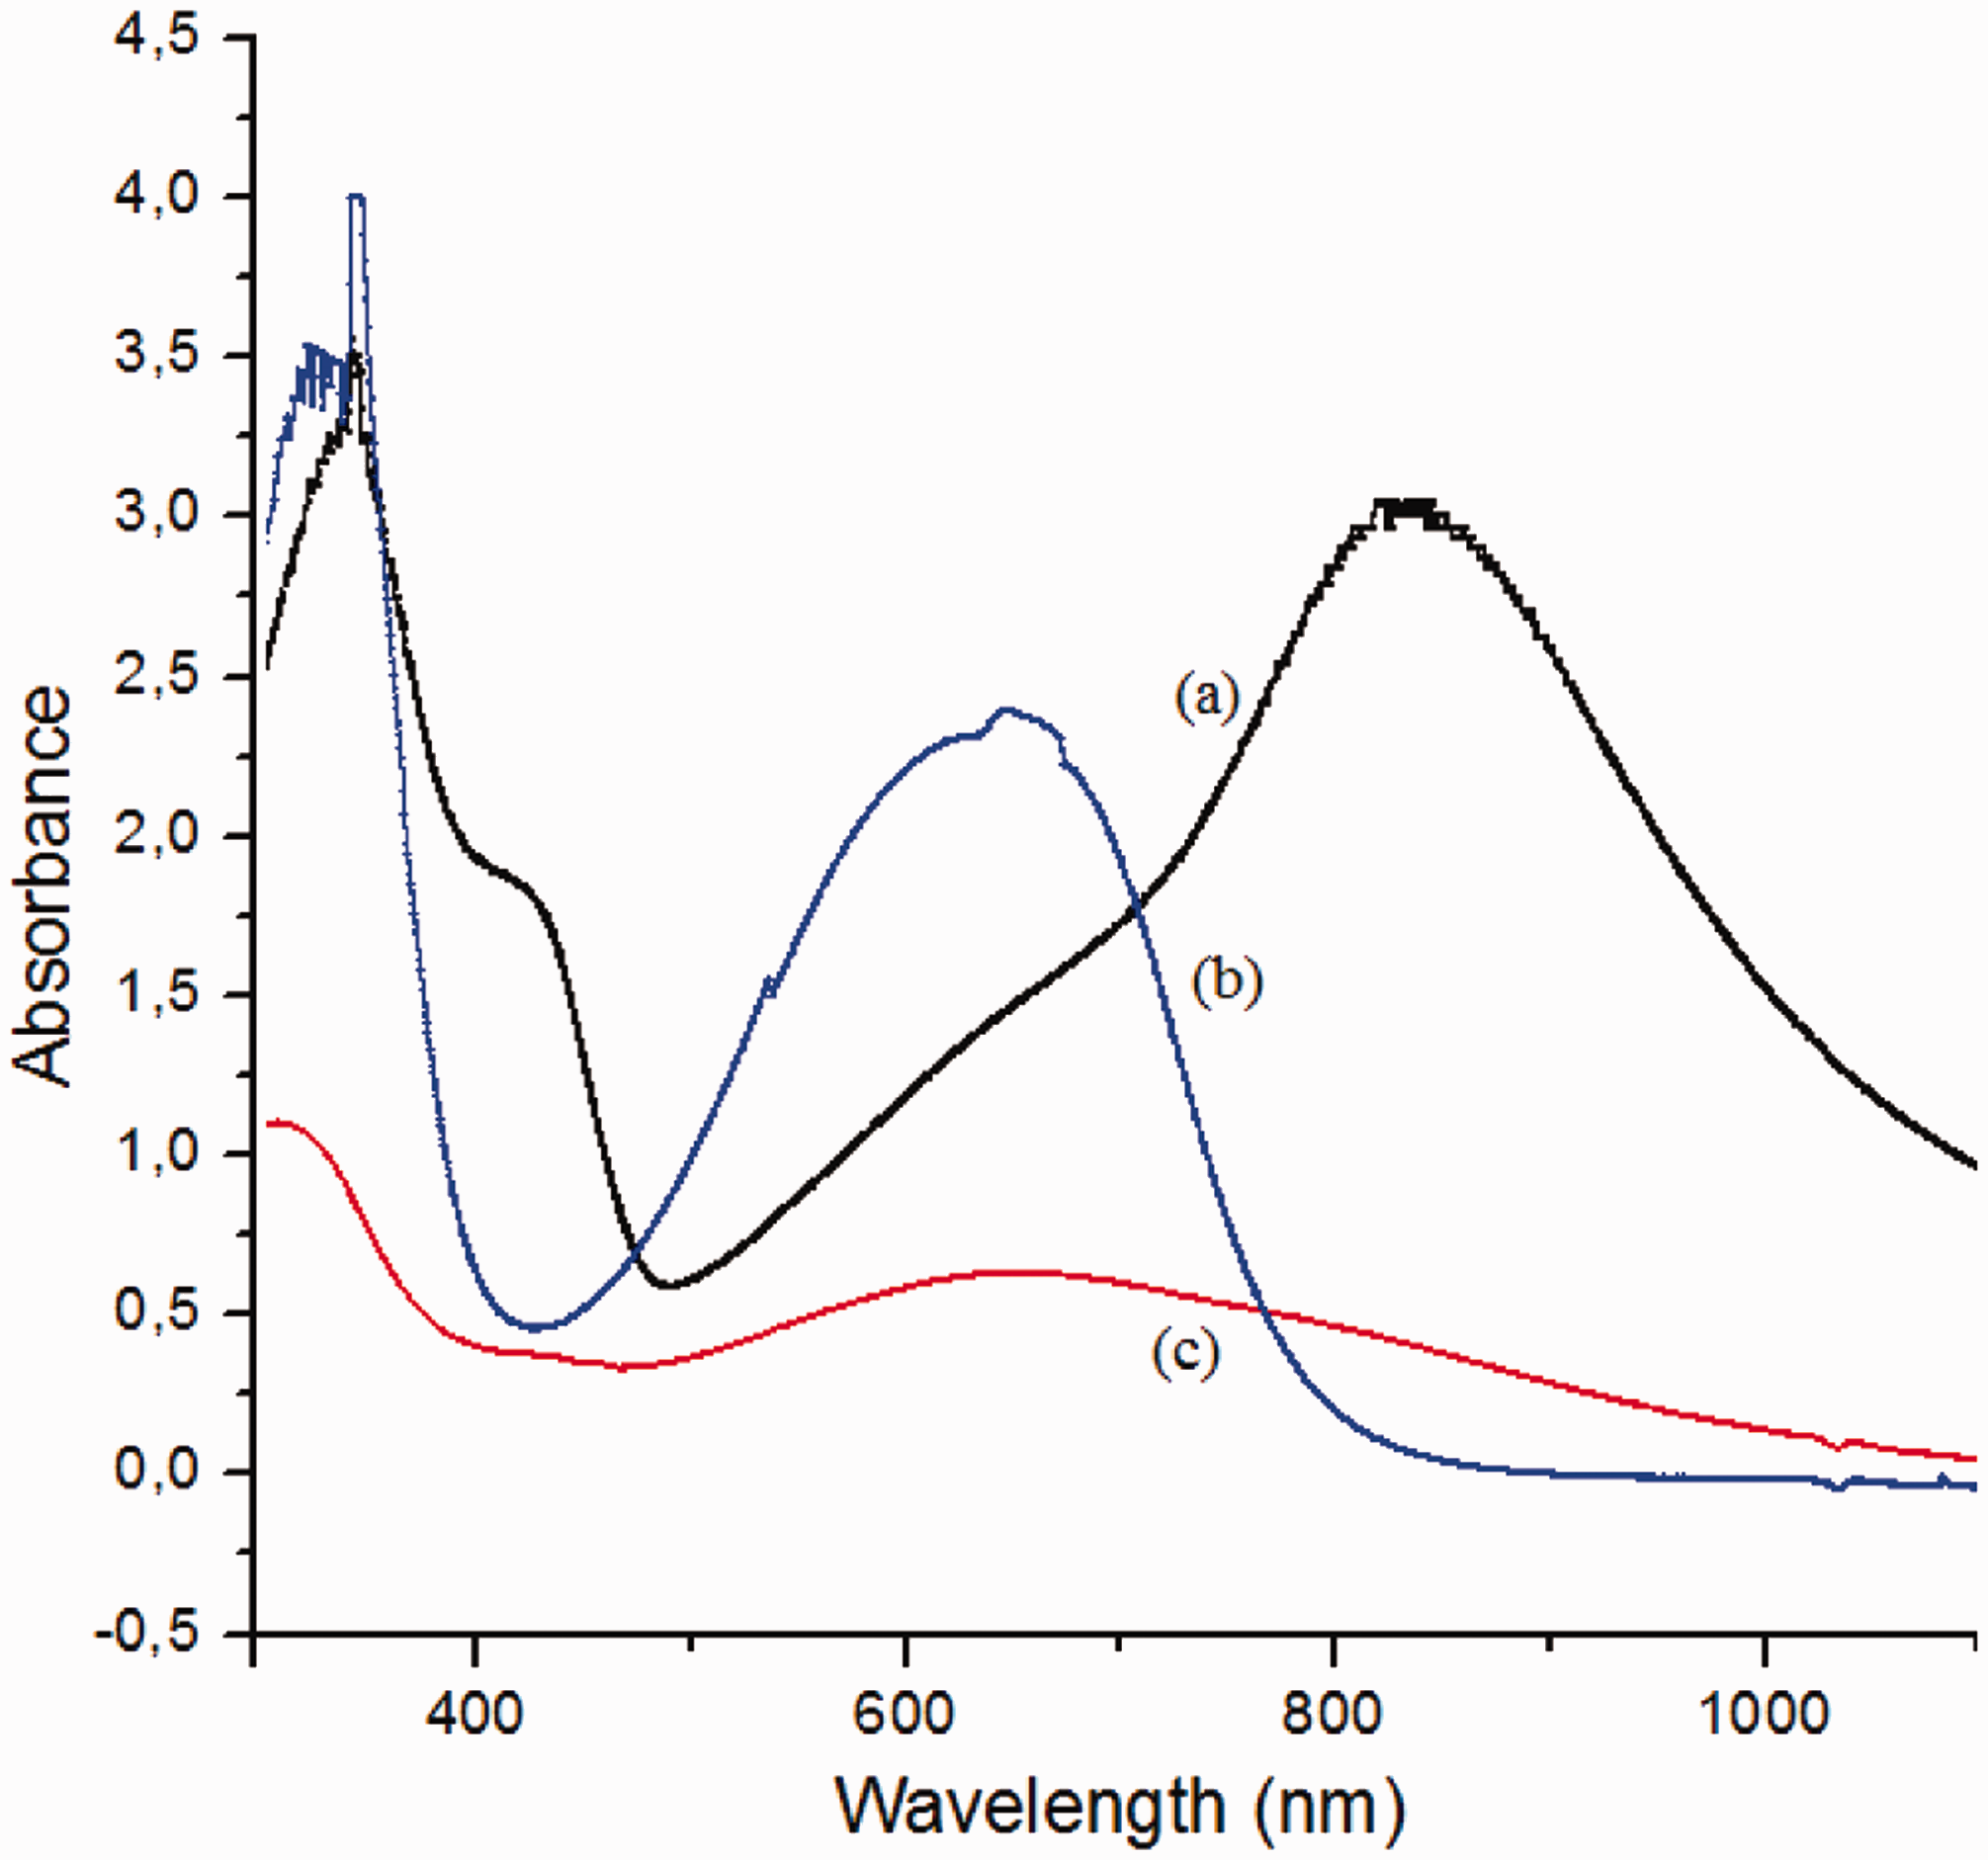
The colors of the doped PANI solutions supported the results obtained from UV–vis spectroscopy. The green color of the CSA-doped solutions showed that CSA could dope better than DBSA(iso) and DBSANa+, which showed black and dark blue colors, respectively.
Mechanical properties
Mechanical properties of nanowebs electrospun from the same polymer are reported to be affected by many uncontrollable factors such as the volume density of nanofibers in the web, degree of fusion of individual nanofibers, size, and density of the pores between the nanofibers, existence of imperfections, branching of the nanofibers, and alignment of the nanofibers in the web, orientation of macro molecules [31].
Mechanical properties of electrospun webs from nano/microfibers.

Note: NMP: N-methylpyrrolidone; CSA: camphorsulfonic acid; DBSA: dodecylbenzene sulfonic acid; DBSANa+: dodecylbenzene sulfonic acid sodium salt; DMF: N,N-dimethylformamide.
The presence of PANI with different dopants and solvents generally resulted in a decrease in breaking stress. This may be due to the rigid benzene rings of PANI and incompatibility between PAN and PANI, which can lead to nonhomogeneous dispersion of the PAN and PANI in the structure. The use of NMP as the solvent for reference samples resulted in higher breaking stress compared to the reference sample with DMF. This may be due to the larger diameter and more compact nanoweb structure (Table 2). Besides, nanofibers may be fusing at intersecting points due to late evaporation of NMP resulting in higher breaking stress. When DBSA(iso) and DBSANa+ were used as a dopant, the opposite results were obtained, i.e., the breaking stress of samples with DMF was higher than that of samples with NMP. As known, there are very complex factors affecting the mechanical properties of samples such as morphological structure of nanofiber web, orientation of macromolecules, diameters of nanofibers, etc. This result may be due to the higher electrical conductivity of the solution, which might have led to more orientation of macromolecules during stretching of polymer jet.
With the addition of PANI, there is a tendency of decrease in breaking elongation. However, the E-modulus values of the composite nanowebs showed great variations. It is generally difficult to analyze the E-modulus values of the nanowebs due to some uncontrollable variables such as pores within the nanofiber web and nonuniform alignment of nanofibers in the web, which result in the formation of nonuniform stresses when the nanowebs are subjected to tensile deformation [31].
ANOVA evaluation showed that dopant and solvent types affected the mechanical properties of the nanowebs. Breaking stress values of all the composite nano/microfibers differed significantly from their corresponding reference samples at 0.05 significance level. According to the multiple comparisons results, the mechanical properties of the nanowebs produced with the use of different dopants differed significantly from each other. In addition, the elongation of all of the composite nano/microfibers was significantly different from the reference samples.
Electrical conductivity
Nanoweb conductivity measurements.

Note: NMP: N-methylpyrrolidone; CSA: camphorsulfonic acid; DBSA: dodecylbenzene sulfonic acid; DBSANa+: dodecylbenzene sulfonic acid sodium salt; DMF: N,N-dimethylformamide.
The conductivities of the doped PANI solutions varied between 115 µS/cm and 930 µS/cm before filtration and between 107 µS/cm and 767 µS/cm after filtration. The conductivity of the solutions decreased after filtration due to the separation of the long macromolecules, which were not dissolved.
Using DBSANa+ as the dopant resulted in higher solution conductivity values. Electrical conductivity can be used as a measure of the concentration of ionizable solutes present in the liquid since the current is carried by ions in liquids [64]. For PANI solutions, the higher the solution conductivity, the higher is the ion concentration, which means that the ions move freely without attaching to the PANI chains for doping. This is also apparent from the conductivity values of the pressed pellets. The conductivities of the pellets in which DBSANa+ is used as dopant are much lower than the pellets in which CSA is used as dopant. CSA is smaller in size and more acidic when compared to DBSANa+ which results in better protonation and thus higher conductivities in pellets. These results are also supported by the UV–vis spectra that the solutions with DBSANa+ showed the characteristic peaks of the PANI base form, while new peaks showing conductive nature were observed for the solutions with CSA and DBSA(iso). The conductivities of the pressed pellets varied between 10−3 S/cm and 10−8 S/cm. The solutions prepared using DBSANa+, which showed higher solution conductivities had the lowest pellet conductivities due to the undoped state of the PANI.
The use of NMP as the solvent resulted in lower solution conductivity values, which might have been due to the better protonation obtained in the solutions with NMP. But this difference was not very much reflected as a difference in the conductivities of the pressed pellets.
All the nano/microfiber webs produced with 10 wt% addition of PANI showed improved conductivity when compared to the conductivity of neat PAN nanofibers, which is reported to be 10−12 S/cm [65]. The conductivity values obtained for composite nano/microfiber webs were around 10−8 S/cm and 10−9 S/cm, which is the range for antistatic materials instead of insulator materials as pure PAN. Conductivity showed no significant dependency on the used dopant and solvent types. In solvents such as NMP and DMF, the polymer chains of PANI have a coil-like conformation. The polarons of each tetrameric unit are isolated from each other due to the twist defects between aromatic rings [32]. Thus, both solvents result in similar conductivity values. When a correlation was investigated between the conductivity values of the nanowebs and solutions or pellets, no correlation could be observed.
Conclusions
Solvent and dopant types used in the preparation of the electrospinning solutions of PANI-incorporated composite nanofiber webs are expected to have considerable effects on the final properties. This study was carried out to examine the effect of different dopants such as CSA, DBSA (70 wt% in isopropanol), and DBSANa+, and different solvents such as NMP and DMF on the structure and properties of PAN/PANI composite nano/microfiber webs. The solvents and dopants used in this study had significant effects on morphology, average nanofiber diameter. Nano/microfibers produced from NMP had generally larger fiber diameters than nano/microfibers produced from DMF. The use of DBSANa+ as the dopant caused an increase in the nano/microfiber diameter compared to other dopants. The UV absorbance values of the solutions showed that the concentration of PANI doped with CSA was higher. CSA could dope better than DBSA(iso) and DBSANa+. The use of NMP as the solvent resulted in higher breaking stress values for the reference samples and composite samples, which contained CSA-doped PANi, while the samples that contained DBSA(iso) and DBSANa+-doped PANi showed lower breaking stress values when electrospun from NMP. All the nanowebs produced with 10 wt% addition of PANI showed improved conductivity when compared to the conductivity of neat PAN nanofibers (10−12 S/cm). The conductivity values obtained for composite nano/microfiber web were around 10−8 S/cm and 10−9 S/cm, which is the range for antistatic materials.
As a final conclusion, the solvents and dopants used in this study had significant effects on morphology, average nanofiber diameter, mechanical properties, while they had less effect on conductivity of the composite nanofiber webs.
In the future work, the investigation of the effect of different dopants (more than one) and different solvents (more than one) on change of the PANI content may also be studied.
Footnotes
Declaration of Conflicting Interests
The author(s) declared no potential conflicts of interest with respect to the research, authorship, and/or publication of this article.
Funding
The author(s) disclosed receipt of the following financial support for the research, authorship, and/or publication of this article: We would like to thank to TUBITAK for supporting this study with Project (112M877).