
Abstract
The conditions to make nanorods functionalized fabric superhydrophobic have been optimized to obtain three kinds of self-cleaning characteristics such as physical, chemical, and biological. Physical self-cleaning is the lotus effect which is characterized by measuring both water contact and sliding angles. Chemical self-cleaning is the degradation of color stains and solutions due to photocatalytic effect of ZnO when exposed to ultraviolet. Biological self-cleaning refers to the antibacterial activity of functionalized fabric which is characterized by using a Gram-negative bacterium (Escherichia coli) and a Gram-positive bacterium (Staphyloccocus aureus) by both qualitative and quantitative methods using NF ISO 20743:2009 transfer method. The chemical and biological self-cleanings are studied on nanorods functionalized fabric before and after hydrophobization.
Introduction
Self-cleaning textiles are the ones which clean themselves without any substantial physical assistance. These textiles can be divided into three categories, namely, physical, chemical, and biological self-cleanings. The physical self-cleaning refers to lotus effect that can be defined as the cleaning of lotus leaves due to the rolling of rain droplets on them. The lotus leaves exhibit this characteristic due to the presence of hierarchical roughness structure, i.e., micro-roughness covered with hydrophobic nano-roughness [1–3]. In various studies [4–8], textiles have been functionalized with different nanostructures to generate roughness on fibers which on modification with hydrophobic compounds exhibited physical self-cleaning (lotus effect).
The chemical self-cleaning means the degradation of color stains or discoloration of solutions in contact with fabric. For this, the fabric is functionalized with photocatalysts which produce hydroxyl radicals on ultraviolet (UV) light activation. This radical is highly oxidative and non-selective with high-redox potential (E0 = +3.06 V) [9]. Therefore, it degrades stains and other organic species. Recently, the textiles have been treated with nanoparticles of titanium dioxide (TiO2) which degraded red wine stains [10–12] and decolorized methyl orange solution [13].
The biologically self-cleaning textiles have the ability to kill bacteria attached on them and prevent their growth. Several attempts have been made to develop antibacterial fabrics using organic and inorganic species. Nylon fabrics have been functionalized with quaternary ammonium salts to develop antibacterial activity [14,15]. Natural materials like chitosan have also been used to develop antibacterial textiles [16,17]. Inorganic materials, particularly, nanostructures of silver (Ag) and zinc oxide (ZnO) have been used to treat textiles for imparting antibacterial activity. Cotton fabric has been functionalized with ZnO nanoparticles which inhibits the growth of Staphylococcus aureus and Klebsiella pneumonia [18]. In another study, the textile has been functionalized with Ag which prevented growth of bacteria like Escherichia coli K-12 [19]. Cotton fabric deposited with silica particles functionalized with Ag nanoparticle has shown excellent antibacterial activity [20].
It is evident from literature that each type of self-cleaning has been developed individually on different textiles. Recently, some attempts have also been made to integrate more than one self-cleaning characteristics into one fabric. The polyester fabric has been treated with TiO2 and Ag nanoparticles using polysiloxane. The functionalized fabric shows chemical self-cleaning by degrading dye stains and antibacterial activity [21]. The cotton fabric functionalized with ZnO nanowires exhibits UV protection, chemical, and physical self-cleanings [22]. In another study, ZnO nanoparticles have been attached on the cotton fabric using polystyrene-block-poly(acrylic acid) copolymer for biological self-cleaning against E. coli and S. aureus and chemical self-cleaning by discoloration of methylene blue solution [23]. So far, two self-cleanings have been developed on one fabric.
ZnO appears to be excellent functionalizing material due to its photocatalytic effect [24,25], antibacterial characteristics, [26,27], and the possibility to grow various kinds of nanostructures on different surfaces [28–31]. These properties of ZnO are yet to be used in textiles. Therefore, the objective of present study is to use ZnO as functionalizing material for polyester fabric to integrate all the three self-cleanings. For this, ZnO nanorods are grown on the fabric to generate nano-roughness which on treatment with octadecyltrimethoxysilane (ODS) exhibits physical self-cleaning. The fabrics with ZnO nanorods have photocatalytic effect and antibacterial properties. However, when ODS is added, these properties are reduced. The challenge of this research was to find the best conditions for ODS hydrophobization to obtain all three properties on the same sample.
Materials and processes
Growth of nanorods
The plain woven plasma-treated polyester polyethylene terephthalate (PET) fabric was functionalized with ZnO nanorods according to our recently published work [32]. The fabric was seeded with ZnO seeds which were prepared by using 90 mM zinc acetate dihydrate (ACS reagent ≥98% from Sigma Aldrich) and 75 mM sodium hydroxide. This seeded fabric was placed in 100 mM solutions of zinc nitrate hexahydrate (reagent grade 98%, Sigma Aldrich) and hexamethylenetetramine (ACS reagent grade assay ≥99.0%, Sigma Aldrich) at 90℃ for 4 h. Then, the sample was rinsed five times in distilled water and dried at 120℃ for 10 min. The sample obtained is called N.
Hydrophobization
PET fabric functionalized with ZnO nanorods was modified with ODS (Sigma Aldrich, Technical grade 90%). Two methods, solution method (samples S) and vapor deposition method (samples V), were used to apply ODS on the treated PET fabric.
In solution method, ODS solutions with its various concentrations (0.05% to 4% v/v) were prepared in absolute ethanol (Carlo Erba 99.7%). The nanorods functionalized fabric samples were placed in these solutions for 24 h at 40℃ and cured at 150℃ for 5 min. In vapor deposition method, 200 µL of ODS was placed in ceramic dish at the bottom of Teflon bottle in which samples were held vertically, and the bottle was placed in an oven at 150℃ for 1, 2, 3 and 4 h.
Characterization
Nanorods
The morphologies of nanorods were characterized by scanning electron microscope (SEM; HITACHI S-3500N). As samples were not conducting, they were metalized with ultrathin coating of gold in order to avoid accumulation of static charges on surface and to obtain high-resolution images. FEI Tecnai G2 20 transmission electron microscope was also used to study the morphology and size of nanorods. Nanoscope III from Digital Instrument was used for atomic force microscopy (AFM) imaging in the AFM mode. The chemical compositions of samples were characterized by using XPS. SSX 100/206 photoelectron spectrometer from Surface Science Instruments (USA) equipped with a monochromatized micro focused Al X-ray source (powered at 20 mA and 10 kV) was used for this purpose. The angle between the surface normal and the axis of the analyser lens was equal to 55°.
Physical self-cleaning (lotus effect)
The physical self-cleaning was characterized on samples S and V by measuring water contact angle (WCA) and water sliding angle (WSA). The WCA measurements were carried out using sessile drop method using Digidrop from GBX, France. On each sample, six measurements were made with 5 µl of water droplet. The WSA was determined according to procedure described elsewhere [32].
Chemical self-cleaning
The chemical self-cleaning was studied by stain degradation and solution discoloration. The C.I. acid blue 9 was chosen for this because it is extensively used in food stuffs. The staining of fabric functionalized with just nanorods (N) was made by dipping the sample in dye solution in water, whereas the hydrophobic fabrics S and V could only be stained when the color was dissolved in acetone. Then they were dried in an oven. For solution discoloration, the sample N was immersed in aqueous solution of acid blue 9, but it was not possible to dip samples S and V due to hydrophobicity. Therefore, they were first soaked in acetone and then immersed in dye solution.
The UV light exposure was carried out at a distance of 18 cm from UV source (300 nm–400 nm with maximum emission at 368 nm) in the light box (VeriVide CAC60). The stain degradation was characterized by measuring the K/S values of the samples with the help of DATA COLOR spectrophotometer SPECTRA FLASH SF 600 PLUS. According to Kubelka-Munk equation, K/S = (1–R)2/2 R, where K = absorption coefficient, S = scattering coefficient, and R = reflectance. The K/S values are directly proportional to the amount of color present on a surface. To study the solution discoloration, the absorbance of dye solution in contact with fabric sample was measured at λ = 628 nm by using JASCO UV/VIS spectrophotometer V-530.
Biological self-cleaning (antibacterial activity)
Biological self-cleaning of the fabric was studied on samples N, V, and S. A Gram-negative (E. coli ATCC 8739) and Gram-positive (S. aureus ATCC 6538) bacteria were used for this purpose. For the experiments, liquid cultures were prepared by inoculating colonies into test tubes containing 5 mL of Muller Hinton (MH) broth (Biocar Diagnostic, Beauvais, France) maintained at 37℃ for 24 h. A subculture was then prepared by injecting 0.1 mL of bacterial suspension into 5 mL of MH broth, and this was grown at the same temperatures as those described above. Cells were harvested after 18 to 24 h growth period. A dilution of the cell culture was then performed by injecting correct volume of the culture described above into 50 mL of MH broth in order to obtain a cell concentration of (1–3) × 106 colony-forming units of bacteria which could be immediately used for experiments. The antibacterial activity was studied by qualitative and quantitative method.
Qualitative evaluation
The MH (Biocar Diagnostic, Beauvais, France) agar plates were inoculated with 1 mL of the dilution described above. Afterward, a swatch of the test sample (1.2 cm in diameter) was placed on the agar surface and incubated at 37℃ for 24 h before observation. For each sample, the test was repeated three times.
Quantitative evaluation
Reduction of bacterial growth on the functionalized samples was estimated for Gram-negative bacterium E. coli (ATCC 8739) and the Gram-positive bacterium S. aureus (ATCC 6538) using NF ISO 20743:2009 Transfer Method.
Agar plates were inoculated with 1 mL of a MH (Biocar Diagnostic, Beauvais, France) nutrient broth culture containing (1–3) × 106 colony-forming units of bacteria. Afterward, a swatch of the test sample (3.8 cm in diameter) was placed on the agar surface and pressed with a 200 g cylindrical weight for 60 ± 5 s. For every sample (N, S, and V), six swatches were used: three of them were removed from the agar surface and immediately analyzed for counting and three remaining were then removed from the agar surface, placed in a container with the transferred surface face up, and incubated at 37℃ for 24 h in a humidity chamber. For each fabric, 20 mL of neutralizing solution was poured on the test sample in a sterile bag and shaken vigorously using a stomacher shaker for 1 min on each side of the bag.
Serial dilutions were made with sterilized peptone water (Biocar Diagnostic, Beauvais, France), and the suspensions were placed on MH nutrient agar and incubated at 37℃ for 24 h.
The antibacterial activity (A) on the functionalized sample in comparison to the unfunctionalized one was calculated as
logC0 and logCt are the decimal logarithm average corresponding to the number of bacteria obtained from the three untreated samples immediately after inoculation and after an incubating period of 24 h, respectively. logT0 and logTt are the decimal logarithm average corresponding to the number of bacteria obtained from the three treated samples immediately after inoculation and after an incubating period of 24 h.

Results and discussion
Physical self-cleaning (lotus effect)
Figure 1 shows the micrograph and topograph of nanorods grown on mircofibers. The nanorods grow uniformly all over the fibers. The roughness generated due to growth of these nanorods on microfibers is 23 ± 3.4 nm. Therefore, a hierarchical roughness structure like lotus leaf has been developed. On modification with hydrophobic chemical (ODS), the nanorods functionalized fabric exhibited physical self-cleaning with very high WCA and very low WSA.
(a) micrograph of nanorods functionalized fabric sample N and (b) topograph of same sample.
Figure 2(a) shows the effect of ODS concentration deposited on nanorods functionalized fabric by solution method. The WCA increases with increase in ODS concentration and reaches its maximum value when the concentration is 2%. On further increase, it starts decreasing. The WSA decreases and gains minimum value at the same ODS concentration at which WCA is the highest. On the contrary, the WCA angle continues to increase, whereas WSA continues to decrease with increase in vapor deposition time and their values stay constant after 3 h of ODS deposition as shown in Figure 2(b).
(a) effect of ODS concentration in solution on water contact and water sliding angles and (b) effect of ODS vapor deposition time on water contact and water sliding angles.
In solution deposition method, the more and more molecules of ODS deposited on nanorods with the increase in its concentration in ethanol and all the nanorods were completely covered when the concentration was 2%. Therefore, the WCA and WSA were highest and lowest, respectively, at this concentration. On further increase, the deposition of ODS molecules was so high that they masked the nano-roughness due to which the WCA decreased and WSA increased. After 3% ODS, the WCA and WSA become almost stable. It is so because all the roughness has been masked with ODS and on further increase in its concentration, it did not have any significant effect. However, only a thin layer of ODS was formed in vapor deposition method. Therefore, after gaining the best self-cleaning characteristics at 3 h of deposition, the WCA and WSA remained constant on further increasing deposition time.
The highest WCA, WSA, and resistance offered by fabric to sliding of droplet.
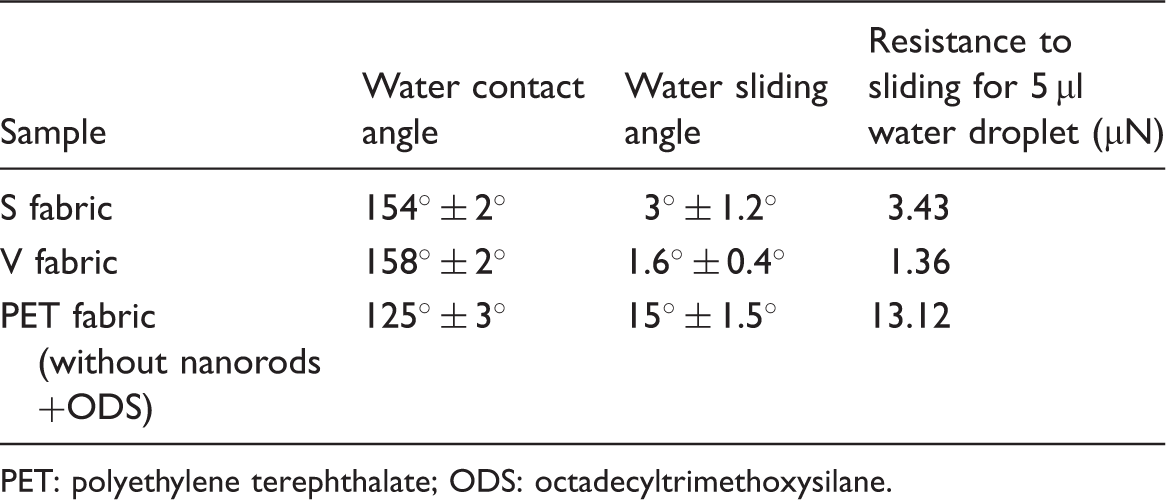
PET: polyethylene terephthalate; ODS: octadecyltrimethoxysilane.
The comparison of the best self-cleaning characteristic by both hydrophobization methods shows that the sample V is better than sample S. The SEM micrographs of samples V and S shown in Figure 3 reveal the reason of this difference. It shows that the nanorods are completely masked with ODS layer in solution deposition method, whereas the individual nanorods can be seen in vapor deposition. The ODS layer deposited on sample S impairs the roughness due to which it has less WCA and high WSA as compared to sample V.
SEM micrographs of nanorods functionalized samples modified with ODS. (a) sample V and (b) sample S.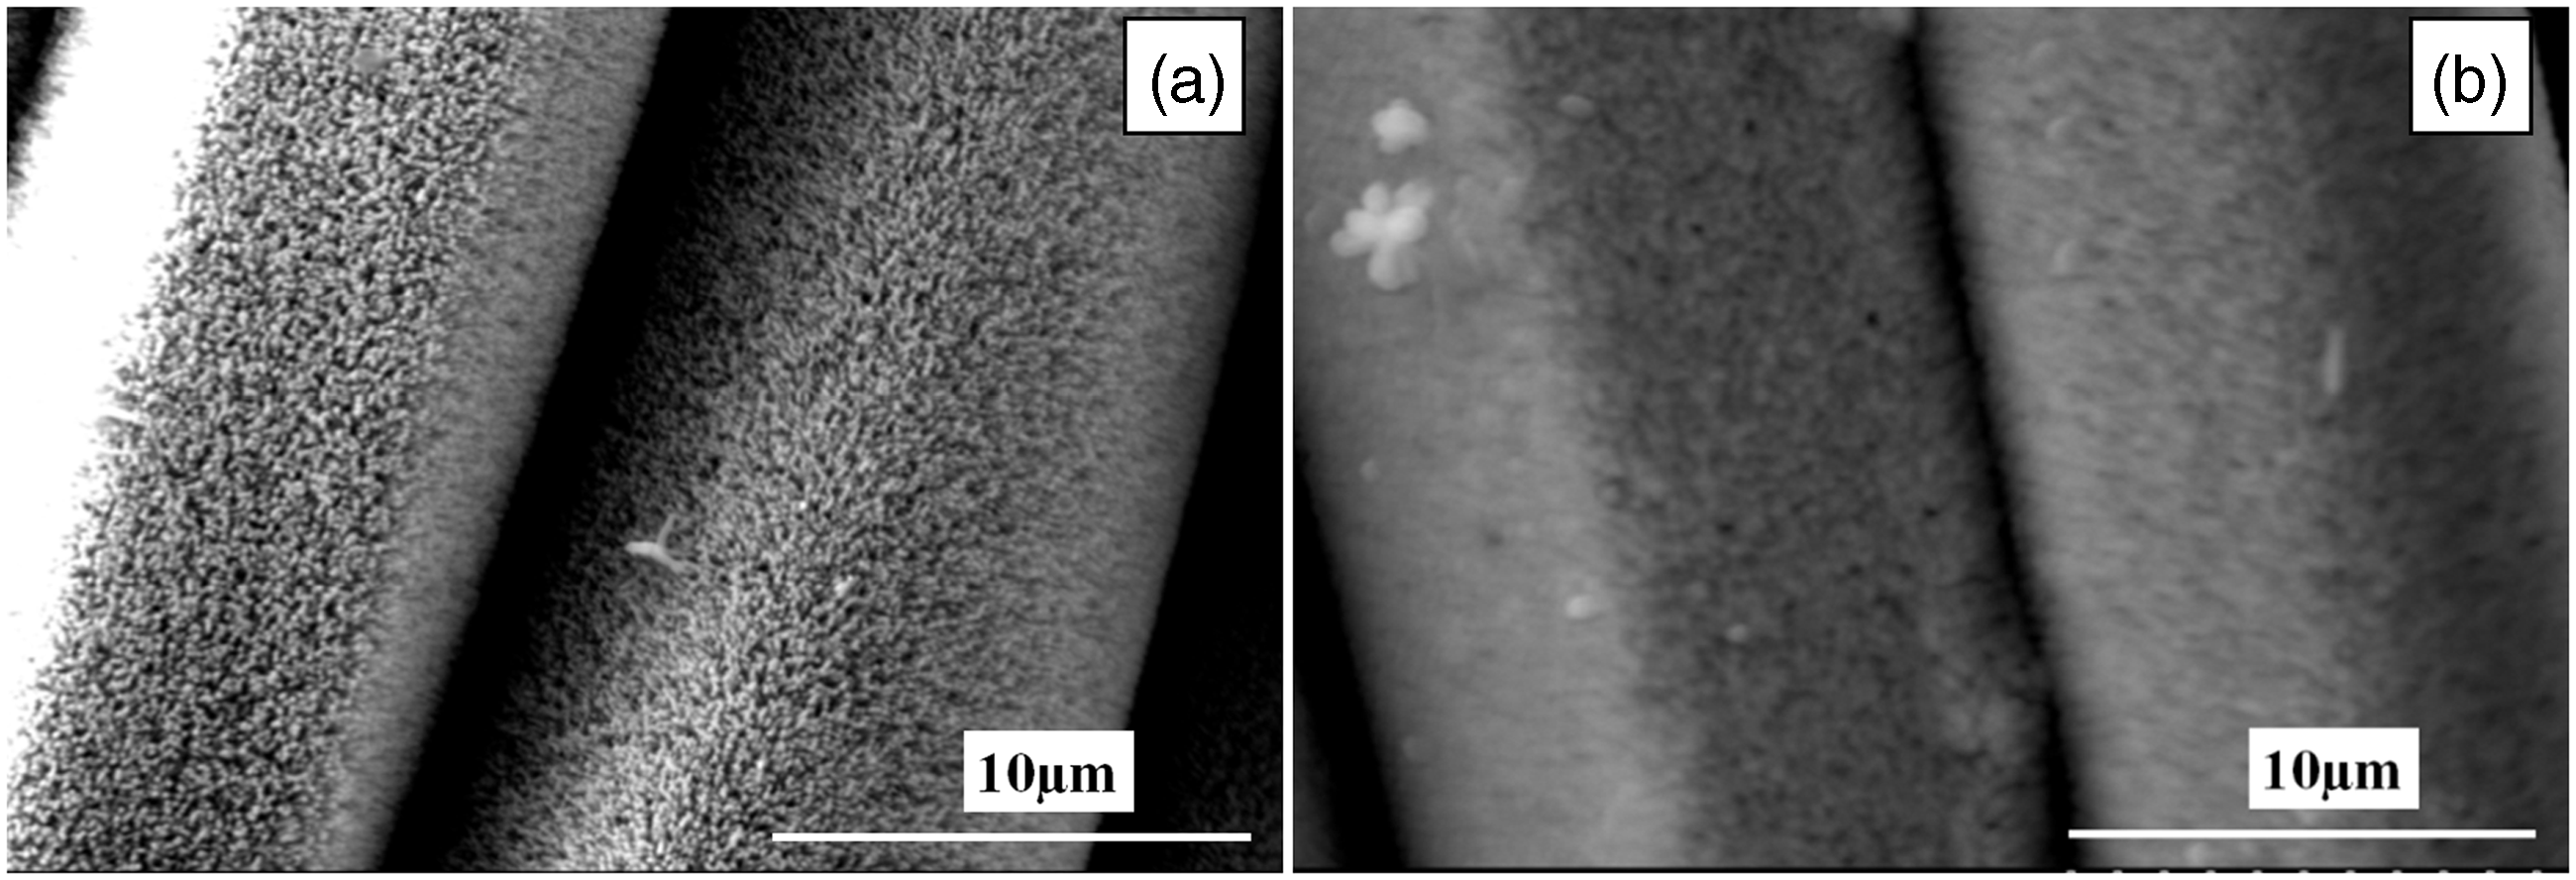
To further substantiate this argument that sample S has higher quantity of ODS as compared to sample V, XPS analysis was carried out. XPS C1s spectra of all samples (untreated, N, S, and V) are presented in Figure 4. The peaks at 288.8 eV, 286.3 eV, and 284.8 eV correspond to–COOC–, –C–(O, N), and –C–(C, H), respectively. The heights of these peaks on nanorods functionalized sample are smaller than that of untreated. The nanorods cover the fibers due to which the heights of peak are reduced. The peaks at 288.8 eV and 286.3 eV disappear completely after modification with ODS because it covers PET fiber. However, the peak at 284.8 eV increases significantly for sample S, but the increase is not that significant for sample V. Table 2 also represents the composition of nanorods functionalized fabric modified with ODS by both methods. The sample S has higher percentage of –C–(CH)– as compared to that of V. This means that the deposition of ODS in solution is higher than vapor deposition method which impairs the roughness generated due to nanorods.
XPS C 1s spectra of samples: (a) untreated polyester fabric, (b) nanorods functionalized polyester fabric, (c) nanorods functionalized polyester fabric modified with ODS by solution method (S), and (d) nanorods functionalized polyester fabric modified with ODS by vapor deposition (V). XPS analysis data. PET: polyethylene terephthalate; ODS: octadecyltrimethoxysilane.

Chemical self-cleaning
The chemical self-cleaning was studied by degradation of dye stains and discoloration of solutions. Figure 5 represents the K/S values measured on samples N, V, and S as function of time. Here, it is worth mentioning that the samples V and S are the ones with best physical self-cleaning characteristics, and sample N is nanorods functionalized fabric without hydrophobization. There is no significant reduction in K/S values measured on sample S even after 24 h. This means that there is no degradation of color stain. Despite the fact that initial concentration of stain on sample N was much higher, about 50% K/S value was reduced in first 20 min, whereas on V, it took 240 min for 50% reduction. In 300 min, about 90% stain was degraded on N. The inset photo (Figure 3) shows the color stain on sample N at the beginning, after 300 min and after 24 h of UV exposure. The fabric became almost white after 300 min.
Stain degradation on samples N, V and S; K/S values were measured as function of time. Inset picture represents the stain color on sample N at the beginning, after 300 min and after 24 h.
The absorbance evolution of dye solutions in contact with samples N, S, and V as function of time is presented in Figure 6. The sample N decolorizes the solution in 240 min, whereas V takes 360 min for discoloration of the same solution. The solution in contact with sample S remained unchanged.
Evolution of absorbance curves of solutions in contact with samples N, V, and S.
Due to superhydrophobicity, the samples V and S shed the droplets and did not get stained by the dye solution in water, ethanol, and methanol. The solution droplets slipped over the fabric when they were pressed to penetrate into samples for staining. Only very low-energy liquids like acetone could wet the samples. Therefore, the dye solution in acetone was used for staining of samples S and V. Even then, the depth of stain on sample S was very low. The stain and solution degradation by sample N was very quick. Because all the active sites of photocatalyst (ZnO) were available, a thin layer of ODS is formed on top of nanorods in vapor deposition method (sample V) as discussed in physical self-cleaning section. Therefore, the number of active sites was less than N which caused slow degradation. In case of solution deposition of ODS, the nanorods were completely masked and there was no active site available (Figure 7).
Graphical representation of nanorods functionalized fabric N, functionalized fabric modified with ODS by solution method S and functionalized fabric modified with ODS by vapor deposition method V. ODS: octadecyltrimethoxysilane.
Biological self-cleaning (antibacterial activity)
The antibacterial activities (A) of samples N, V, and S were evaluated by both qualitative and quantitative methods.
Qualitative evaluation
The qualitative evaluation of A of treated fabric was carried out with Gram-negative (E.coli) and Gram-positive (S. aureus) bacteria. The untreated (without nanorods) (C) and functionalized samples N, V, and S were placed on agar plates containing bacterial cultures. After 24 h of incubation in dark, it was observed that the bacteria grew below, above, and in the immediate proximities of sample C. The sample S inhibited the growth above and below but bacteria were observed in their vicinities. The samples V and N caused complete inhibition of bacterial growth on, below as well as in the immediate proximities. The zone of inhibition was bigger in case of sample N than sample V. The antibacterial activity was relatively higher against S. aureus than E. coli.
The functionalized fabric can inhibit the growth of bacteria possibly by two mechanisms. First, the nanorods whose tip diameter is around 50 nm (Figure 8) can penetrate into membranes of bacteria and mechanically damage it. This causes the disintegration, malfunctioning of the permeability barrier, and ultimately death of bacteria [33]. The second important reason is the production and penetration of reactive oxygen species (ROS). The ROS includes ·OH, H2O2, and O22−. As the bacteria carry negative charge on their surfaces, the penetration of O22− seems impossible but the hydroxyl radical and hydrogen peroxide can penetrate into the cell membranes which lead to the death of bacteria.
TEM image of ZnO nanorods scraped from fabric.
Zone of inhibition and amount of Zn detected in bacterial culture.

Note: ++ = big zone of inhibition, + = small zone of inhibition, −−= no zone of inhibition.
It can be said that the presence of Zn++ ions was responsible for zone of inhibition because ZnO dissolved in bacterial culture and released Zn++ [35]. These ions were attached on the surfaces of bacteria due to electrostatic attraction and prevented their growth.
Quantitative evaluation
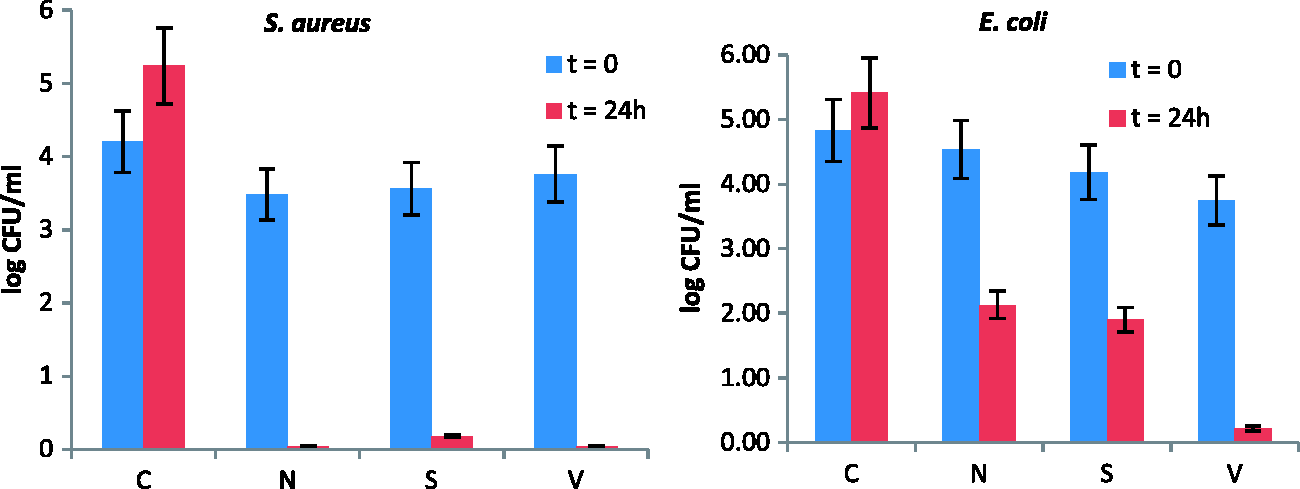
Figure 9 shows the counting of S. aureus and E. coli population (in decimal logarithm average per milliliter) directly on the samples after inoculation (t = 0) and after an incubation period of 24 h (t = 24 h). The A for S. aureus with treated samples of N, V, and S are 4.47, 4.75, and 4.42, whereas for E. coli, are 2.99, 4.10, and 2.85, respectively. The percentage mortality of the bacteria was calculated by equation (2) and presented in Table 4:
Antibacterial activity of samples, i.e., untreated (C), nanorods functionalized (N), nanorods functionalized modified with ODS by solution method (S) and modified by vapor deposition method (V) against S. aureus and E. coli. Percentage mortality of bacteria for samples N, V, and S.

It is quite clear that the functionalized samples are more effective against S. aureus than E. coli. This difference in antibacterial activity is due to the difference in cell membranes of both the bacteria. The killing and growth inhibition of bacteria takes place due to both physical and chemical mechanisms. The Gram-negative bacteria membranes have some additional components. For instance, Gram-negative bacteria contain the extra outer membranes and the pathogen-associated molecular patterns which include lipopolysaccharide (consisting of lipid A, core polysaccharide, and O antigen), porins, and particular fragments of peptidoglycan. This structure prevents attachment of ZnO on the surface [36]. The complex structure of Gram-negative bacteria mentioned above also acts as permeability barrier to ROS and prevents their penetration into the membrane [37]. S. aureus is charged less negatively as compared to E. coli [38]. This will lead to penetration of negatively charged reactive oxygen species like peroxide and superoxide ions in addition to hydroxyl radicals into S. aureus membrane which cannot penetrate into E. coli that has higher negative charge. This penetration causes the death of S. aureus.
Another important point is the higher antibacterial activity of samples V as compared to N and S against E. coli. To understand this difference, it is important to recall the formation of biofilm on a surface which takes place in five steps [39]: (i) reversible attachment of bacteria on surface, (ii) transition from reversible to irreversible attachment by production of extracellular polymers by the bacteria, (iii) early development of biofilm architecture, (iv) development of microcolonies into a mature biofilm, and (v) dispersion of cells from the biofilm into surrounding environment. It shows that bacteria will grow only when the transition between their reversible and irreversible attachment takes place. The nanostructured superhydrophobic surfaces prevent the attachment of bacteria and they take longer time to attach and make colonies [40]. The rod-like bacteria cannot attach themselves properly on these surfaces [41]. E. coli whose morphology is also rod-like finds it difficult to attach on superhydrophobic nanorods functionalized fabric; therefore, the samples V and S prevent the attachment of bacteria. The sample V has higher antibacterial activity than S. As shown in Figure 3, the sample S is completely masked with ODS, and the production of ROS seems impossible which is also confirmed by the degradation of dye stain and solution (Figures 5 and 6). It can be said that the sample S only prevents the transition of bacterial attachment from reversible to irreversible. Therefore, some of bacteria adhered at t = 0 could not attach themselves irreversibly and were removed from the surface. The sample V could degrade both stains and solutions; therefore, it has double characteristics; prevention to attachment due to superhydrophobicity and production of ROS. This synergistic effect enhances the antibacterial bacterial activity of V which is much higher than sample N against E. coli, because it inhibits the growth only by production of ROS.
Conclusion
The conditions for hydrophobization of nanorods functionalized fabric have been optimized to obtain all three types of self-cleanings on single fabric. The samples modified by vapor deposition method showed better physical self-cleaning characteristics than the ones modified by solution method. Sample V showed chemical self-cleaning as well but the sample S could not degrade the color stains and decolorize solutions due to deposition of thick layer of ODS.
All three samples prevented the growth of bacteria, but they had different zones of inhibition. The zone of inhibition was bigger for sample N as compared to sample V, whereas the sample S did not have any zone. The antibacterial activity was higher against S. aureus as compared to E. coli. The sample V was more effective against E. coli as compared to other two samples (N and S).
On the basis of preceding conclusion, it can be concluded that chemical and biological self-cleanings have been demonstrated by sample N. The sample S has physical and biological self-cleanings. All three self-cleanings, i.e., physical, chemical, and biological have been integrated into sample V.
Footnotes
Declaration of Conflicting Interests
The author(s) declared no potential conflicts of interest with respect to the research, authorship, and/or publication of this article.
Funding
The author(s) received no financial support for the research, authorship, and/or publication of this article.