
Abstract
Polyaniline/ZnO nanocomposites were synthesized with different weight percentage of ZnO (20%, 40%, 60%, and 80%) using an in situ chemical polymerization method. The prepared composite samples were characterized by FT-IR, XRD, TEM, SEM with EDAX, UV-Vis, PL, electrical conductivity, photocatalytic properties, antibacterial and anticancer activity. The presence of functional groups in PANI-ZnO NCs is identified by FTIR spectral analysis. X-ray diffraction patterns show that the nanocomposites exhibit preferential orientational growth along the (002) plane with a hexagonal wurtzite structure. The intensity of the maximum reflection (101) increases with increasing ZnO doping concentrations. The TEM analysis indicates that the spherical shape,the particle size was found to be 36.8 nm. SAED pattern closely matched the peaks of the XRD pattern, confirming that the relevant SAED patterns correspond to hexagonal Wurtzite crystals of ZnO. SEM image shows a spherical morphology and ZnO nanoparticles are homogeniously mixed with PANI matrix. EDAX analysis showed the presence of Zn, C and O.UV-vis absorption spectra reveals increasing wavelength leads to the redshift in which there is a strong interaction between PANI and PANI/ZnO. The band gap energy of PANI/ZnO NCs is decreased to 1.30 eV by adding different concentrations of ZnO. PL analysis showed that the addition of ZnO dopants reduced the bandgap and increased oxygen defect vacancies of PANI/ZnO composites. An increase in ZnO content in the PANI matrix was also seen to cause a decrease in electrical conductivity. This alteration might be connected to ZnO’s doping and dedoping activity in the PANI matrix. Photocatalytic activity of 80 wt%ZnO-doped PANI-NPs through the degradation of methylene blue (MB) pigment studied under UV-A light and had detected 95% of degradation throughout 260 min. The lowest bandgap of 80 wt% ZnO shows the highest photocatalytic MB degradation performance. PANI/ZnO nanocomposite with high concentration of ZnO had good antibacterial activity against both P. aeruginosa and S. aureus. An in vitro study was used to evaluate the cytotoxic effects of PANI and PANI/ZnO NPs on the HCT-116 cell line. The results of the MTT test reveal that PANI/ZnO NPs have a significantly greater cytotoxic effect on the HCT-116 cell line than PANI.
Keywords
Introduction
Zinc oxide (ZnO) is considered as an environmentally friendly oxide material that has multifunctional usages for industrial applications. This probably belongs to its n-type and it has both high band gap and exciton binding energy which is equal to 3.37 eV and 60 meV respectively, so that for it is used as anti-UV additives, gas sensors varistors, transducers, photocatalysts, solar cells and absorbers etc. 1 ZnO has drawn more attention in recent years as a potential photocatalyst due to its abundance in nature, high catalytic activity, low cost, non-toxicity, and superior chemical and long-term stability.2–4 The photocatalytic performance is low and the practical applications are restricted by the huge band gap, which restricts the absorption of light response range to the UV region and the high electron-hole recombination rate.5,6 To overcome the drawbacks of pure ZnO’s wide band gap energy, numerous attempts have been made, including doping metallic ions and nonmetallic elements7–10 loading noble metals and oxides,11–14 and altering polymer material.15,16 The photocatalytic efficiency of ZnO particles can be promoted by modification with conducting polymers which enables them to photocatalyze with in higher wavelengths (visible light). PANI enhances the photocatalytic activity of ZnO particles by the high mobility of photo-induced holes in PANI which promotes the separation efficiency of electron–hole pairs in the ZnO.17,18 In recent decades, several reports have been reported on the synthesis of the PANI nanocomposite with the inorganic nanoscale such as TiO2, CdS,19–22 silica,23,24 CeO2, 25 Fe3O4, 26 and MnO2. 27 The single material does not have the numerous novel features that this nanocomposite possesses, including mechanical, electrical, optical, antibacterial, and catalytic capabilities. Most recently, PANI/TiO2 composite was synthesized and studied as well; but about PANI/Zinc oxide (ZnO) nanocomposite especially filler with nanoparticles, there is less attention.
One of the most terrible diseases, cancer has a high mortality rate and is extremely difficult to treat, especially at an advanced stage. There are many different types of cancer, and they can all now be treated with chemo, surgery, and radiotherapy. However, when cancer cells are treated with chemotherapy, the toxicity towards normal cells is also very significant, so it is extremely important to identify a controlled drug release that can only damage the particular cancer cell in consideration without having an impact on the normal cells. 28 ZnO nanoparticles (NPs) have drawn a lot of interest in the field of cancer therapy due to their unique and adaptable physicochemical characteristics. ZnO-Ag composite’s antitumor efficacy against the cancer cell lines HCT-116 and HELA was investigated by Khaled et al. 29 Rahmani Kukia et al. reported that two types of colorectal cancer cells (HCT116 and HT29) and HUVECs were treated with TiO2NPs atserial dilutions (50, 100, 200, and 400 μg/mL) for 24 and48 h. 30 Nehal Salahuddin et al. reported the cytotoxicity of the Vn-CS/ZnO nanocomposites containing different amounts from ZnO NPs against different cancer cell lines including HePG-2, HCT-116, and MCF-7, in addition to the WI-38 and WISH normal cell lines. 31 Elsayed et al. reported that the highest at 10 µg/mL of ZnO-Ag composite is suitable for anticancer activity for HCT116 Cell lines. 32 According to Fatima Alzahraa et al., the generation of reactive oxidation species (ROS) and the release of Zn + 2 are the anticancer mechanisms of pure and nanocomposites ZnO, and these species have an inhibitory effect on cancer. 33 Alharthi et al. examined the anticancer potential of green biosynthesised ZnO NPs using two cancer cell lines: human colon cancer (HCT-116) and human liver cancer (HepG2). The study’s results showed that GBS ZnO NPs behaved in a dose-dependent manner, with the cancer cells’ capacity to survive declining as drug concentrations increased. 34 Acharya et al. reported that unique biogenic U-AgNPs nanoparticles, synthesized utilising marine green macro-algal U. lactuca extract, had effective anticancer activity against HCT-116 cell line. 35
Kavitha Ganesan et al. prepared green synthesis of Copper oxide nanoparticles decorated with graphene oxide for anticancer activity and catalytic applications. The photocatalytic studies revealed that synthesized nanocomposites have the efficiency to degrade methylene blue dye. 36 The IC50 values of Y-Ce co-doped ZnO NPs for HCT-116 and HEK-293 cells were reported to be 5.0 µg/ml to 25 µg/ml by Hannachi et al. 37 The DNA damage and death in colon cancer cells HCT-116 and Caco-2 caused by developed titanium dioxide nanoparticles (TiO2-NPs) (60 nm) and the titanium dioxide food additive E171 were examined by Margherita Ferrante et al. 38
To the best of our knowledge, no research has been published on the use of PANI/ZnO nanocomposites in HCT1116 cells as an anticancer treatment.
In the current study, we attempted to fabricate PANI/ZnO nanocomposites at various ZnO concentrations (20%, 40%, 60%, and 80%) using a chemical oxidation technique. The effects of ZnO on HCT-116 cell lines, optical band gap energy, antibacterial activity, photocatalytic activity, structural and electrical properties have been investigated.
Experimental method
Materials
Aniline (99.5%) and Ammonium persulfate (98%) were purchased from Merck,India.Benzene tri-carboxylic acid (99%) and ZnO nanoparticles were purchased from Sigma-Aldrich, India. Ethanol (99%) was purchased from Nice Chemicals Private Limited, India.
Preparation of PANI and PANI/ZnO nanocomposites
In a typical synthesis, 0.5 M aniline monomer and 1 M Benzene tri-carboxylic acid (BTCA) was dissolved in 100 mL of de-ionized water and then 0.3 M of ammonium persulfate (APS) was added to the mixture with constant stirring.
The polymerization reaction is carried out under static conditions at room temperature for 24 h. The synthesized polymer product was filtered, dried and collected for studies. In continued reaction, 0.5 M of aniline was dissolved in 100 mL of deionized water. After 10 min 1 M Benzene tri-carboxylic acid (BTCA) was added to that solution. Then, after 30 min, the ZnO nanoparticles were mixed with 20 % weight of the above solution. The polymerization was carried out at 0 °C–5°C for 24 h using ammonium persulfate (0.3 M) as the oxidizing agent. The resulting composite was dark green as emeraldine salt, and then ethanol was added to extract the solution. The extract solution was dried in an oven at 60° C for 6 h. In a similar reaction, we are using different weights ZnO 40, 60, and 80% use as the same procedure. Figure 1 shows schematic representation of PANI/ZnO nanocomposites. Schematic representation of the preparation of PANI/ZnO nanocomposites.
Photocatalytic activity of PANI/ZnO nanocomposites
The photocatalytic reaction was performed using a visible multi-lamp photo reactor employed as a visible light source (metal halide, λ = 420 nm). PANI/ZnO composites were mixed with 100 mL aqueous solution of methylene blue (MB:15 mg/L) to create the mixture for photo degradation analysis. After 15 min of stirring, the extract was stored in a dark room for 1 h to find out absorption behavior and check the homogeneity of the catalytic particles in the methylene blue (MB) solution. The concentration of Rhodamine B dye solution was evaluated by using UV–Vis spectrophotometer.
Antimicrobial activity studies of PANI and PANI/ZnO nanocomposites
The antimicrobial activities of PANI/ZnO nanocomposites have been investigated against Pseudomonas aeruginosa as the model Gram-negative bacteria and Staphylococcus aureus as the model Gram-positive bacteria by the disc diffusion method. In the inhibition zone experiment, Muller Hinton agar (Hi-Media) was poured into disposable sterilized Petri dishes. This was done for both the bacterial strains. The filter disc with 5 mm diameter was sterilized by autoclaving at 120°C for 20 min, and was placed on P. aeruginosa -cultured and S. aureus-cultured agar plates with the disc coated with PANI/ZnO nanocomposite of different concentrations, which were then incubated at 37°C for 24 h. Finally, the inhibition zone was monitored with a standard antibiotic.
Anticancer activity
PANI–ZnO nanoparticles are tested for in vitro cytotoxicity, using HCT- 116 Cells by MTT (3–4, 5 dimethylthiazol-2yl-2, 5-diphenyl tetrazolium bromide) assay. Using DMEM media containing 10% FBS, the cell culture was centrifuged, and the cell count was increased to 1.0 × 10⁵ cells/ml. Approximately 10,000 cells were added to each well of a 96-well flat bottom microtitre plate in 100 L of the diluted cell suspension. After 24 h, the cells were centrifuged and the pellets were suspended in 100 mL of various test sample concentrations that had been made in maintenance media.
The plates were then incubated for 48 h at 37°C in a 5% CO2 atmosphere while undergoing microscopic examination and recording observations every 24 h 20 µl of MTT (2 mg/mL) in MEM-PR (MEM without phenol red) were added after 48 h. The plates were gently shaken and incubated for 2 h at 37°C in 5% CO2 atmosphere. The 100 µl of DMSO was added and the plates were gently shaken to solubilize the formed formazan. The absorbance was measured using a microplate reader at a wavelength of 540 nm (Thermo Fisher Scientifc, USA) and the percentage cell viability and IC50 value is computed using Graph Pad Prism 6.0 software (USA).

Characterization techniques
FT-IR analysis was performed in the range of 4000 to 400 cm-1 using the FT-IR Thermo Nicolet V-200 spectrometer(Thermo Fisher Scientific Inc.,USA) by KBr pellet technique. The photoluminescence (PL) spectrum at room temperature was recorded with a spectrofluorometer (model Fluorolog FL3-11,Horiba Ltd, Japan). An X-ray diffractometer (XPERTPRO Malvern Panalytical Ltd,UK) with CuKα (λ = 1.54Ao) radiation was used to identify the crystalline nature of the composite samples. UV-visible spectra of the composite were recorded using the Jasco V-530 double beam spectrometer (Jasco International Co., Ltd. USA). The conductivity of the composite was tested with the Keithley 6571B high resistance meter and electrometer (Tektronix India Private Limited, India) using two-probe method at room temperature. Scanning electron Microscope (SEM) – Jeol 6390LA/Oxford Xmxn, JEOL Ltd, USA) was used to study the surface morphology and elemental composition of the nanocomposites. HR-TEM and SAED pattern were done by using JEM -2100 (JEOL Ltd, Japan).
Result and discussion
Optical absorbance of PANI/ZnO composites
Figure 2(a)–(e) shows UV-Vis spectrum of PANI and PANI/ZnO composite prepared at various weight percentage of ZnO. From this figure, it was observed that there are three characteristic peaks at 348 nm, 424 nm and 624 nm. The peak at 424 nm is attributed due to interchange charge transfer from two adjacent benzoid rings to quinoid rings of PANI chain.
39
UV-Visible spectroscopy of PANI/ZnO composites.
The red shift at 357 nm shows PANI –ZnO nanocomposites interaction. The third band at 750 nm is due to n →π* transitions due to polaron formation into the conducting PANI. The absorbance is due to π-π* transition in the nanocomposites exhibit an increasing red shift from pure PANI to PANI/ZnO. The observed red shift in the absorption bands may be due to the increasing wt% of ZnO nanoparticles and their interaction with polyaniline. 40
The absorption band gaps of PANI/ZnO nanocomposite with different weight percentage (20%, 40%, 60 % and 80 wt%) of ZnO are measured from the absorption coefficient data as a function of wavelength using Tauc relation. Variation of band gap with various concentration of PANI and PANI/ZnO nanocomposites with different weight percentage(20 wt%,40 wt%, 60 wt% and 80 wt%).

Srivastava et al. found that when ZnO concentration increases, the size of the particles increases and their interparticle distance reduces. This leads to a decrease in the band gap and an increase in the number of overlapping orbital or energy levels. 41 According to Kant et al. 42 the interaction between PANI and ZnO causes changes in electron density of the polyaniline chain. These changes cause red shift where there is a shift in absorption to a longer wavelength.
Functional group of PANI/ZnO composites
Figure 4 (a)–(b) shows FT-IR spectra of PANI and PANI/ZnO nanocomposites with different weight percentage (20 wt%,40 wt%, 60 wt% and 80 wt%)of ZnO.The peaks at 1589 and 1489 cm−1 is due to quinoid rings C = C and benzenoid rings C = C units. The peak at 815 cm−1 is attributed to the characteristic C–H out of plane bending of 1, 4-disubstituted benzene rings of polyaniline. The band at 1273 cm−1 is due to C-N for the secondary aromatic amine. The observed peak at 2922 cm-1 is due to C-H vibration of phenyl rings. FT-IR spectra of BTCA doped PANI and PANI/ZnO nanocomposites with different weight percentage(20 wt%,40 wt%, 60 wt% and 80 wt%)of ZnO.
The peaks at 3474 cm−1 are ascribed to N–H stretching vibrations of amino groups in the structural units of the PANI, the peaks at 1158 cm−1 attributed to N = Q = N modes of PANI. PANI/ZnO composite is shown in the Figure 3. The peak at 3239 cm−1 can be attributed to N–H stretching and cm−1, and a new sharp peak 428 cm−1 correspond to Zn–O–Zn bond, and free oxides. The band at 1286 cm−1 is due to C-H bending vibration and the band absorption at 430 cm−1 related to the tensile state of Zn-O bonds. 43 The band at 1680 cm−1 has occurred due to absorbed of H2O molecular at ZnO surface. PANI/ZnO nanocomposite, a broad peak appeared in 3467 cm−1 which can be associated to the interaction between ZnO nanoparticles and PANI by formation of hydrogen bonding between H-N and oxygen of ZnO, so the peak displacement which was observed in FT-IR spectra may be ascribed to the formation of hydrogen bonding between ZnO and the N-H group of PANI on the surface of the ZnO nanoparticles. 44 Similar distinctive peaks may be seen in the FT-IR spectra of PANI-ZnO composites. Characteristic peak shifts to higher wave numbers with ZnO addition to PANI which confirms the interaction between PANI and ZnO. Peak shifting appears as a change in electron concentrations and energy of bonds. It was observed that ZnO is presented in the composite structure.
Optical emission spectra of PANI/ZnO composites
Photoluminescence spectra of PANI and PANI/ZnO nanocomposites with different weight percentage of ZnO (20 wt%, 40 wt%, 60 wt% and 80 wt%) are shown in the Figure 5(a)–(e). Two peaks are observed at 460 and 550 nm. The peak at 460 nm shows blue emission with low intensity. This blue shift may be due to increase of ZnO wt% increasing.
45
PL spectra of PANI and PANI/ZnO nanocomposites with different weight percentage (20 wt%, 40 wt%, 60 wt% and 80 wt%).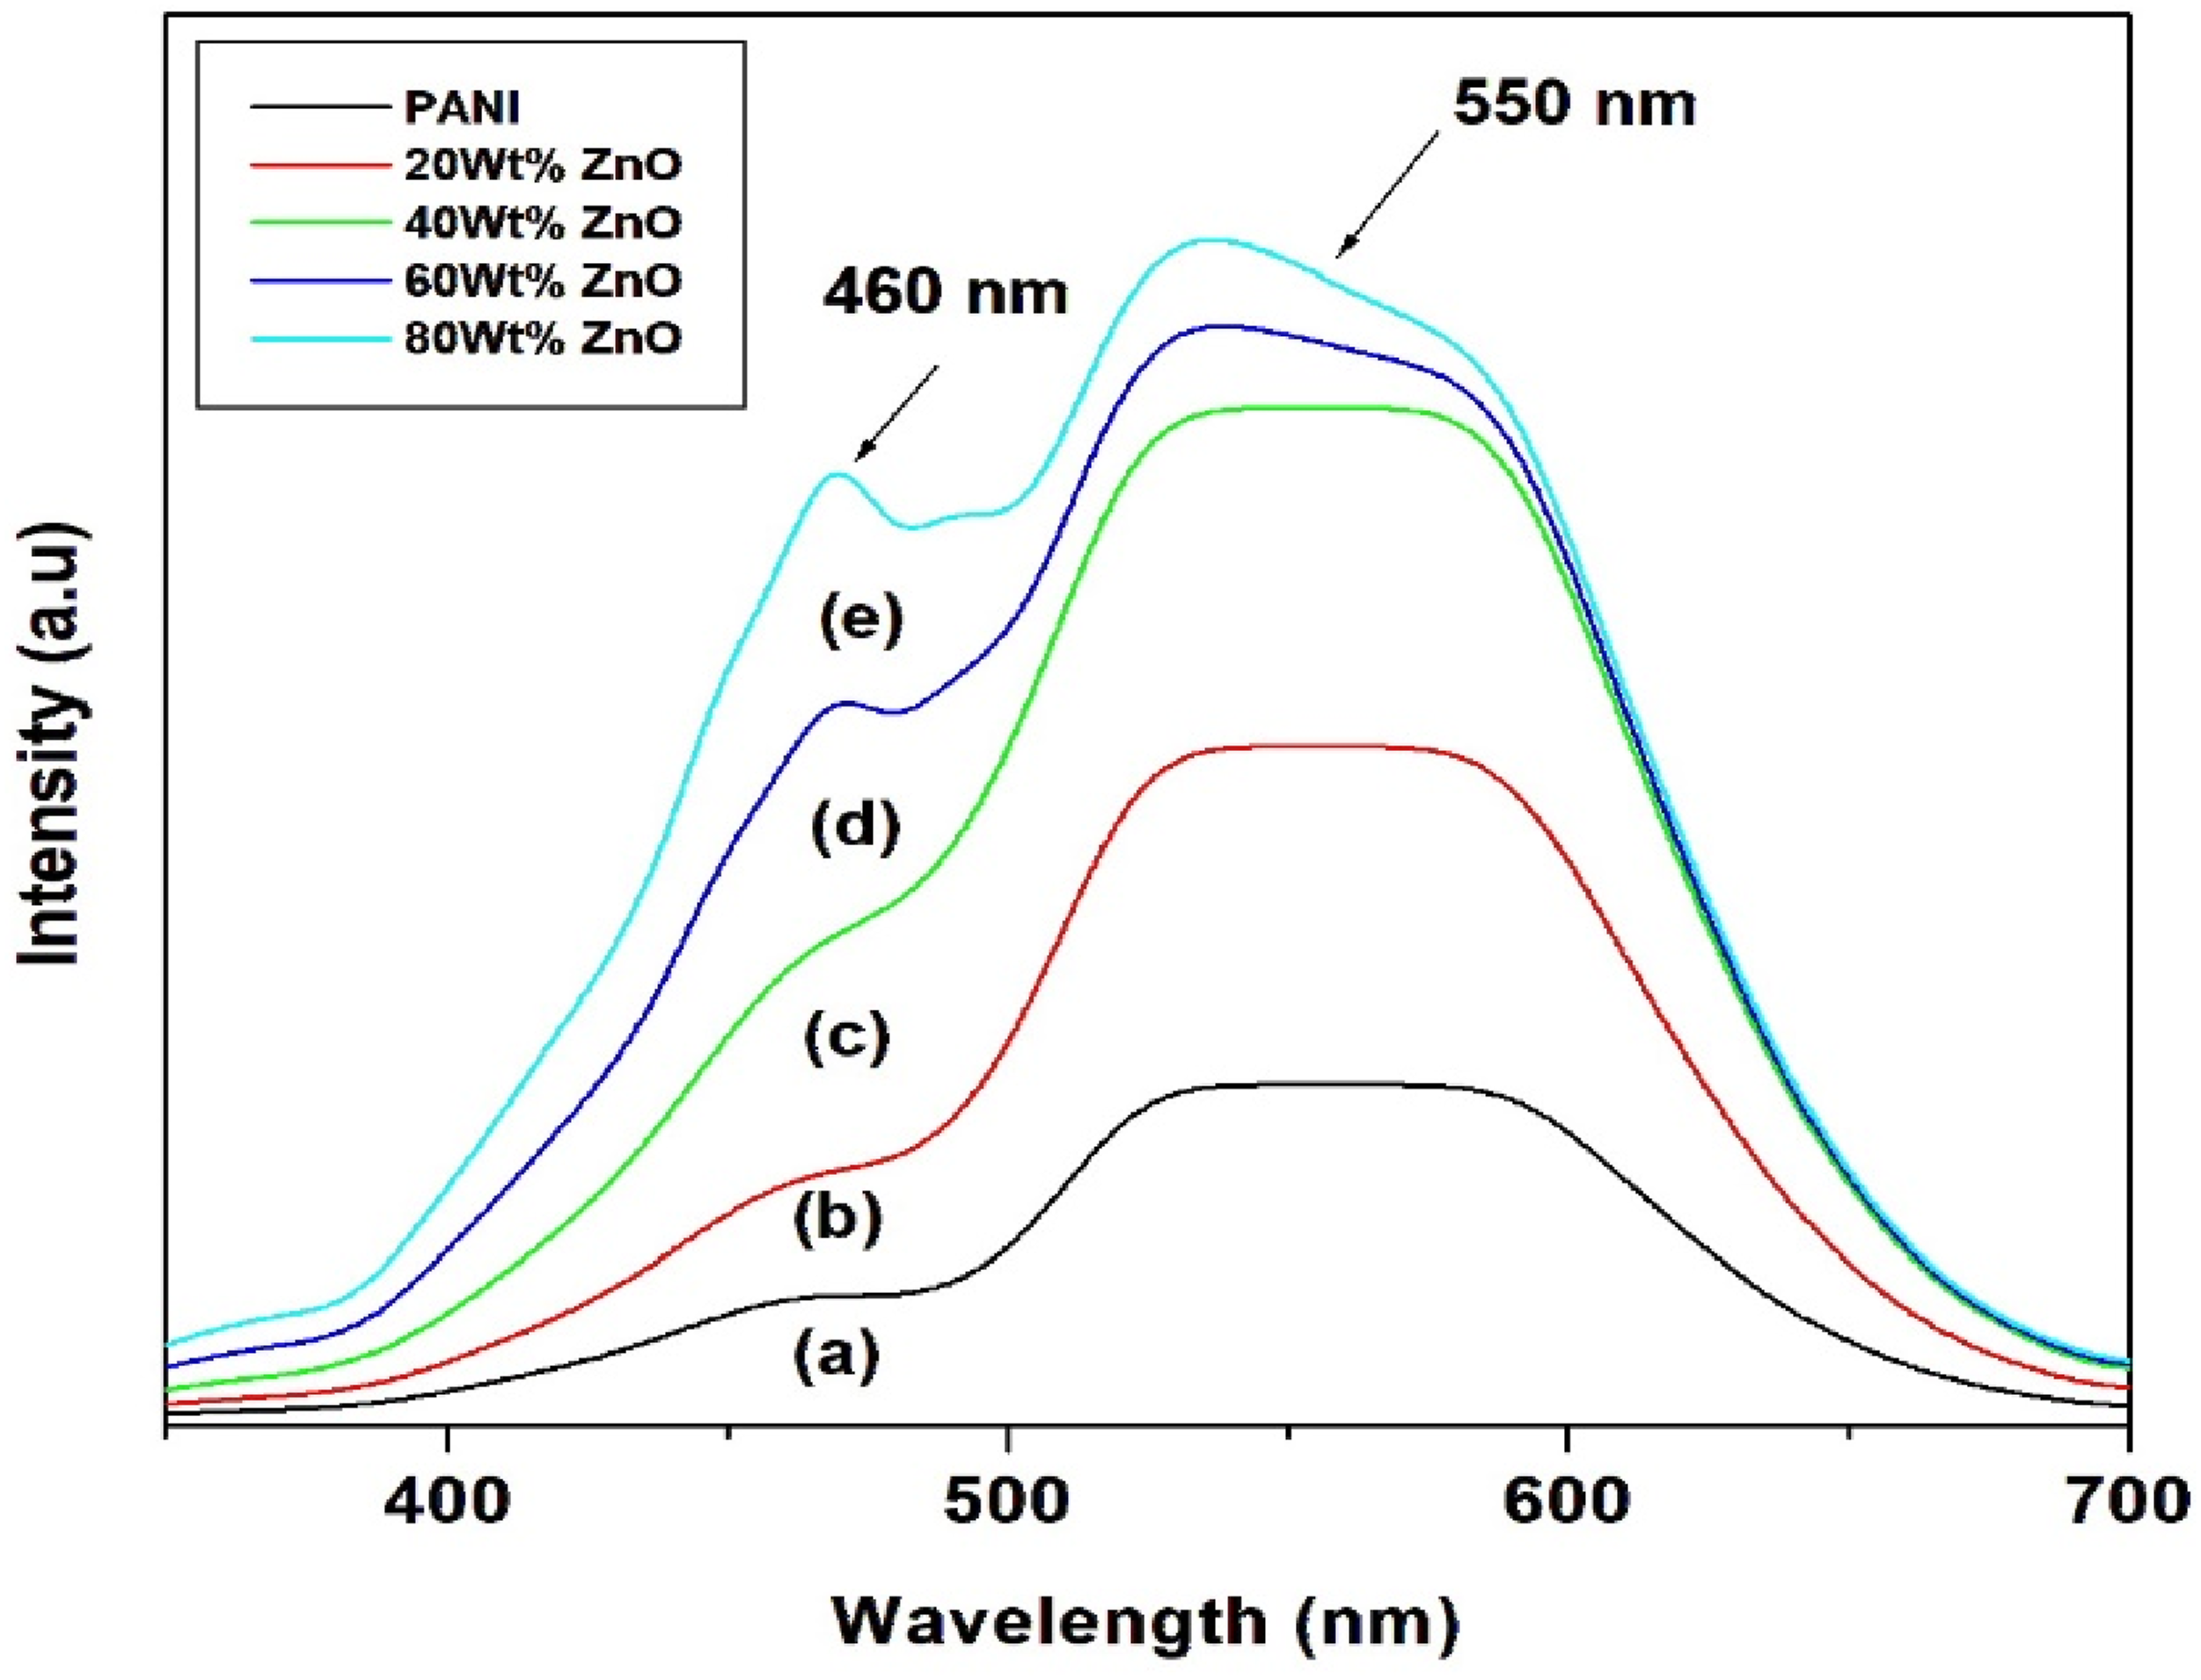
The strong green emission band at 550 nm is caused by surface defects in the nanoparticles. It has been noted that the green emission of ZnO nanoparticles is caused by oxygen vacancies or zinc interstitials on their surface. These Oxygen vacancies arise in three diverse charge states: a neutral oxygen vacancy (VO), a singly ionized oxygen vacancy (VO*) and a doubly ionized oxygen vacancy (VO**). 46 The green emission is normally referred to singly ionized oxygen vacancies resulting from the radiative recombination of a photogenerated hole with an electron occupying the oxygen vacancy. 47 The effect of hydrogenation on ZnO luminescence, wherein hydrogen plasma passivates the green emission centres and enhances the band edge photoluminescence, has been elucidated by Buryi et al. 48
Structural analysis of PANI/ZnO nanocomposites
X-ray diffraction patterns of BTCA doped Polyaniline and PANI/ZnO nanocomposites depicted in the Figure 6(a)–(e). Figure 6(a) shows the peak at 2θ = 15°, 20° and 25°. These three sharp peaks are superimposed on a broad scattering background indicative of crystalline regions dispersed in an amorphous phase. The peak at 2θ = 25 ° is due to the characteristic of PANI which corresponds to (0 1 1) (1 0 0) and (1 1 0) crystal planes.
49
Figure 5(b)–(e) shows PANI/ZnO nanocomposite with various concentration ZnO. XRD pattern of PANI and PANI/ZnO nanocomposites with different weight percentage(20 wt%,40 wt%, 60 wt% and 80 wt%).

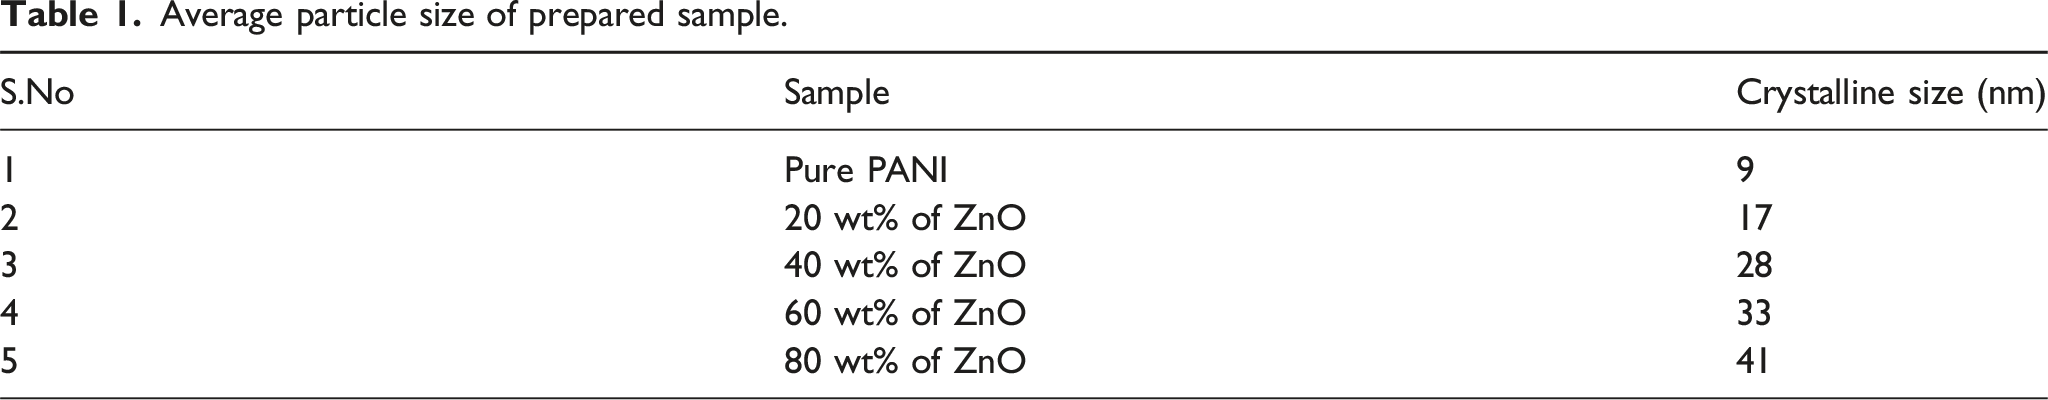
Average particle size of prepared sample.
Morphological analysis of PANI/ZnO composites
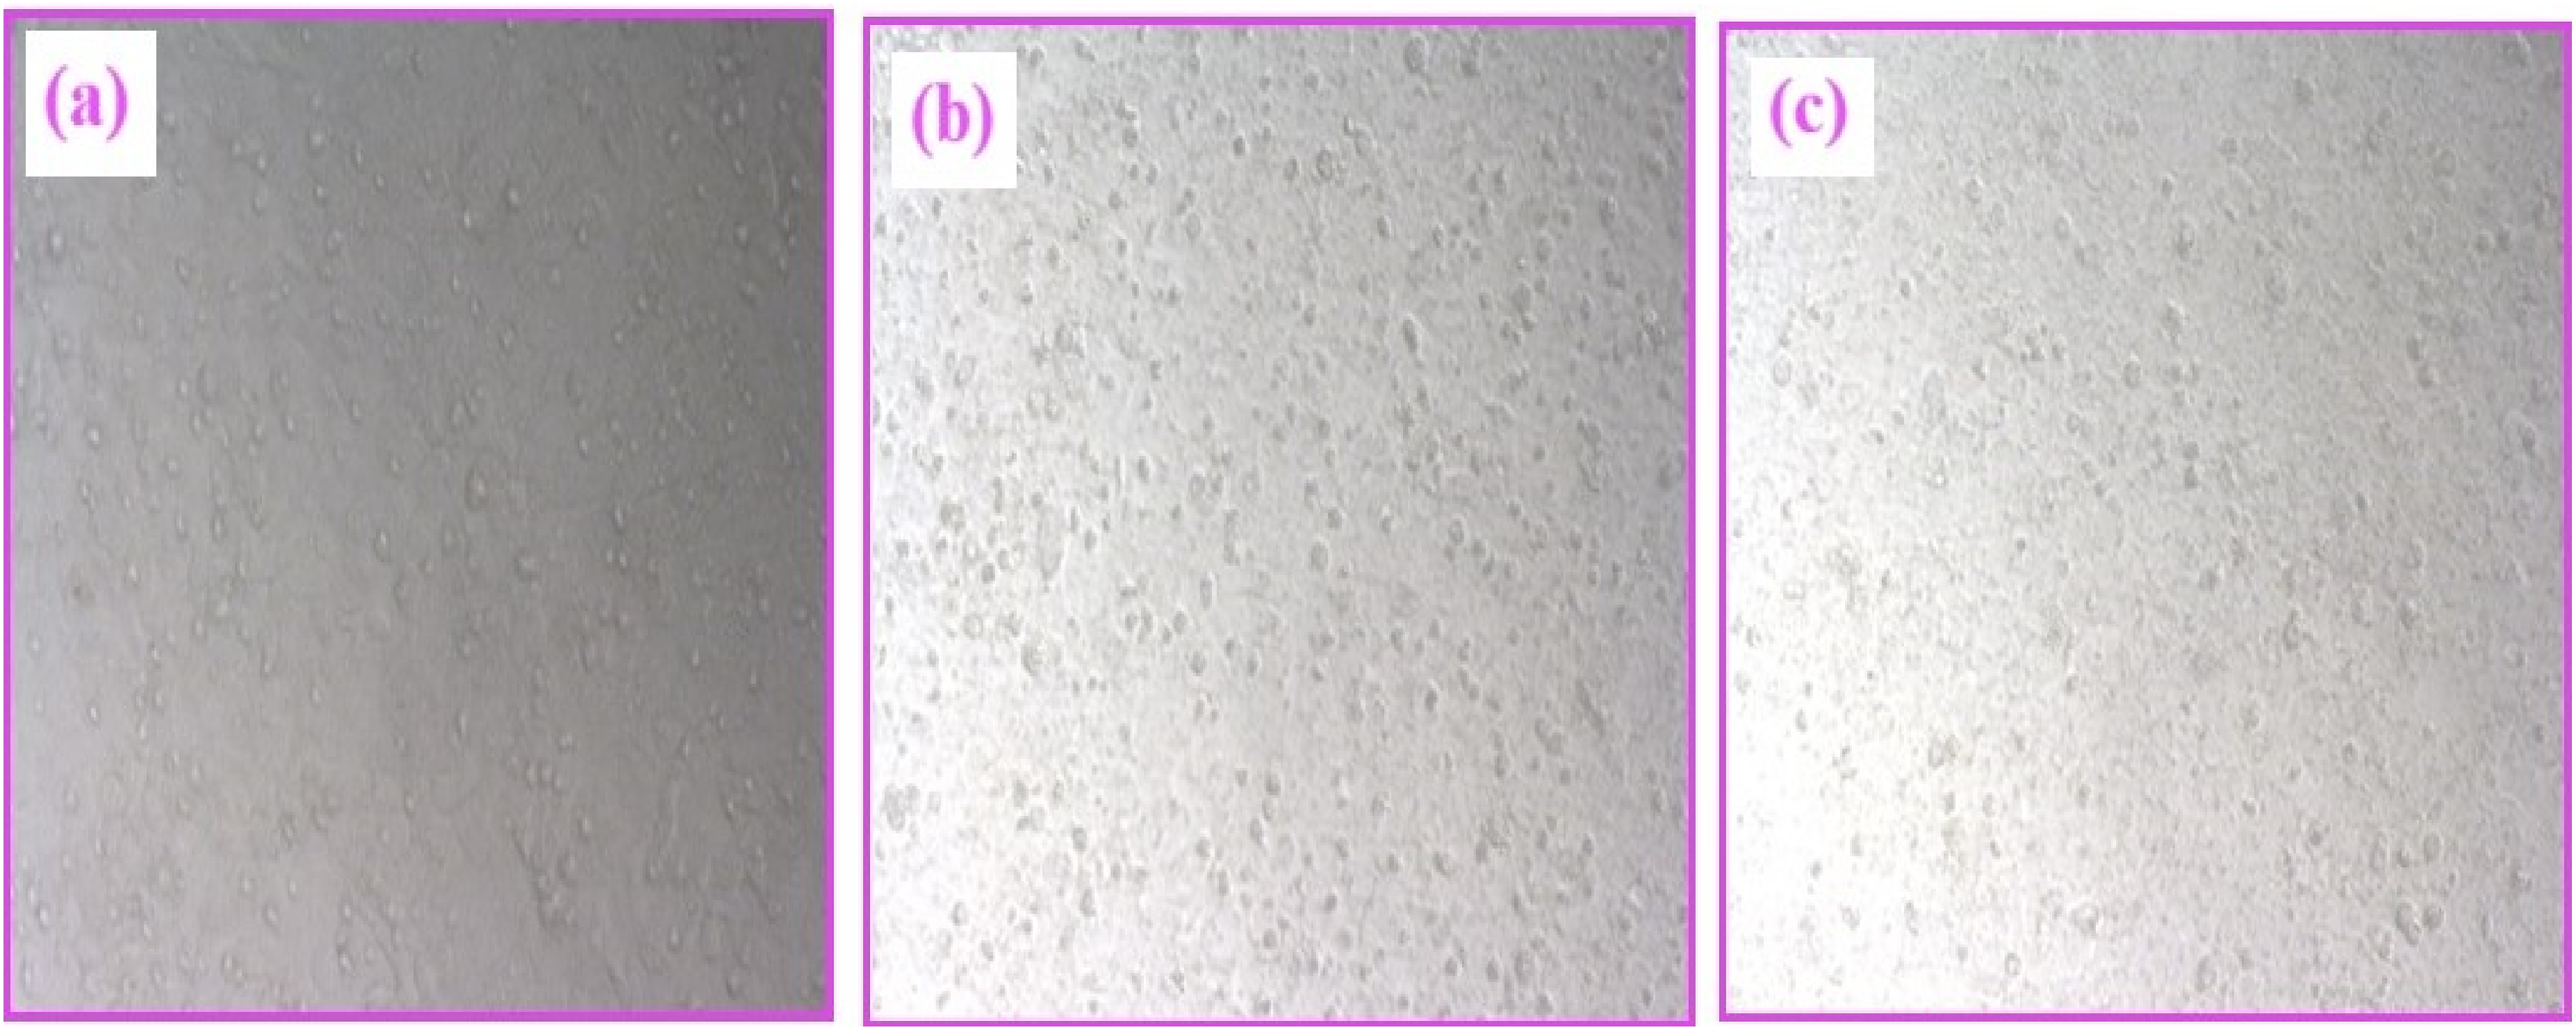
Figure 7(a)–(e) show the morphological properties of pure and various concentrations (20, 40, 60 and 80 wt%) of ZnO nanocomposites. The spherically shaped morphology of BTCA doped PANI is depicted in Figure 7(a). The SEM picture of 20 wt% ZnO nanoparticles in Figure 7(b) illustrates the uniform dispersion of spherical particles. FE-SEM images of (a) PANI (b-e) analysis PANI/ZnO nanocomposites with different weight percentage (20 wt%, 40 wt%, 60 wt% and 80 wt%).
The FE-SEM picture of 40% of PANI-ZnO composite is shown in Figure 7(c). The ZnO oxide particles are evenly distributed, and the grains have an uneven form. The SEM images of 60 wt percent and 80 wt percent PANI-ZnO composites are shown in Figure 7(d) and (e), respectively. An increase in the weight percentage of ZnO causes the composite materials to become more crystallinity. Polycrystalline ZnO and PANI particles make up the nanocomposites, which is in line with the findings of the XRD study. The FE-SEM image showed the presence of metal oxide in PANI, which was uniformly distributed throughout the polymer sample. It was found that ZnO diffused within the PANI matrix.
Elemental analysis of PANI/ZnO nanocomposites
Figure 8 (a)–(d) show EDAX spectrum of PANI/ZnO nanocomposites. These spectra show the presence of expected elements Zn, C and O. Figure 7(d) confirms that increase in doping concentration increases the intensity of ZnO. The EDAX spectra showed the abundant presence of Zinc and oxygen in these nanoparticles. EDAX analysis of PANI/ZnO nanocomposites with different weight percentage of ZnO (20 wt%,40 wt%, 60 wt% and 80 wt%).
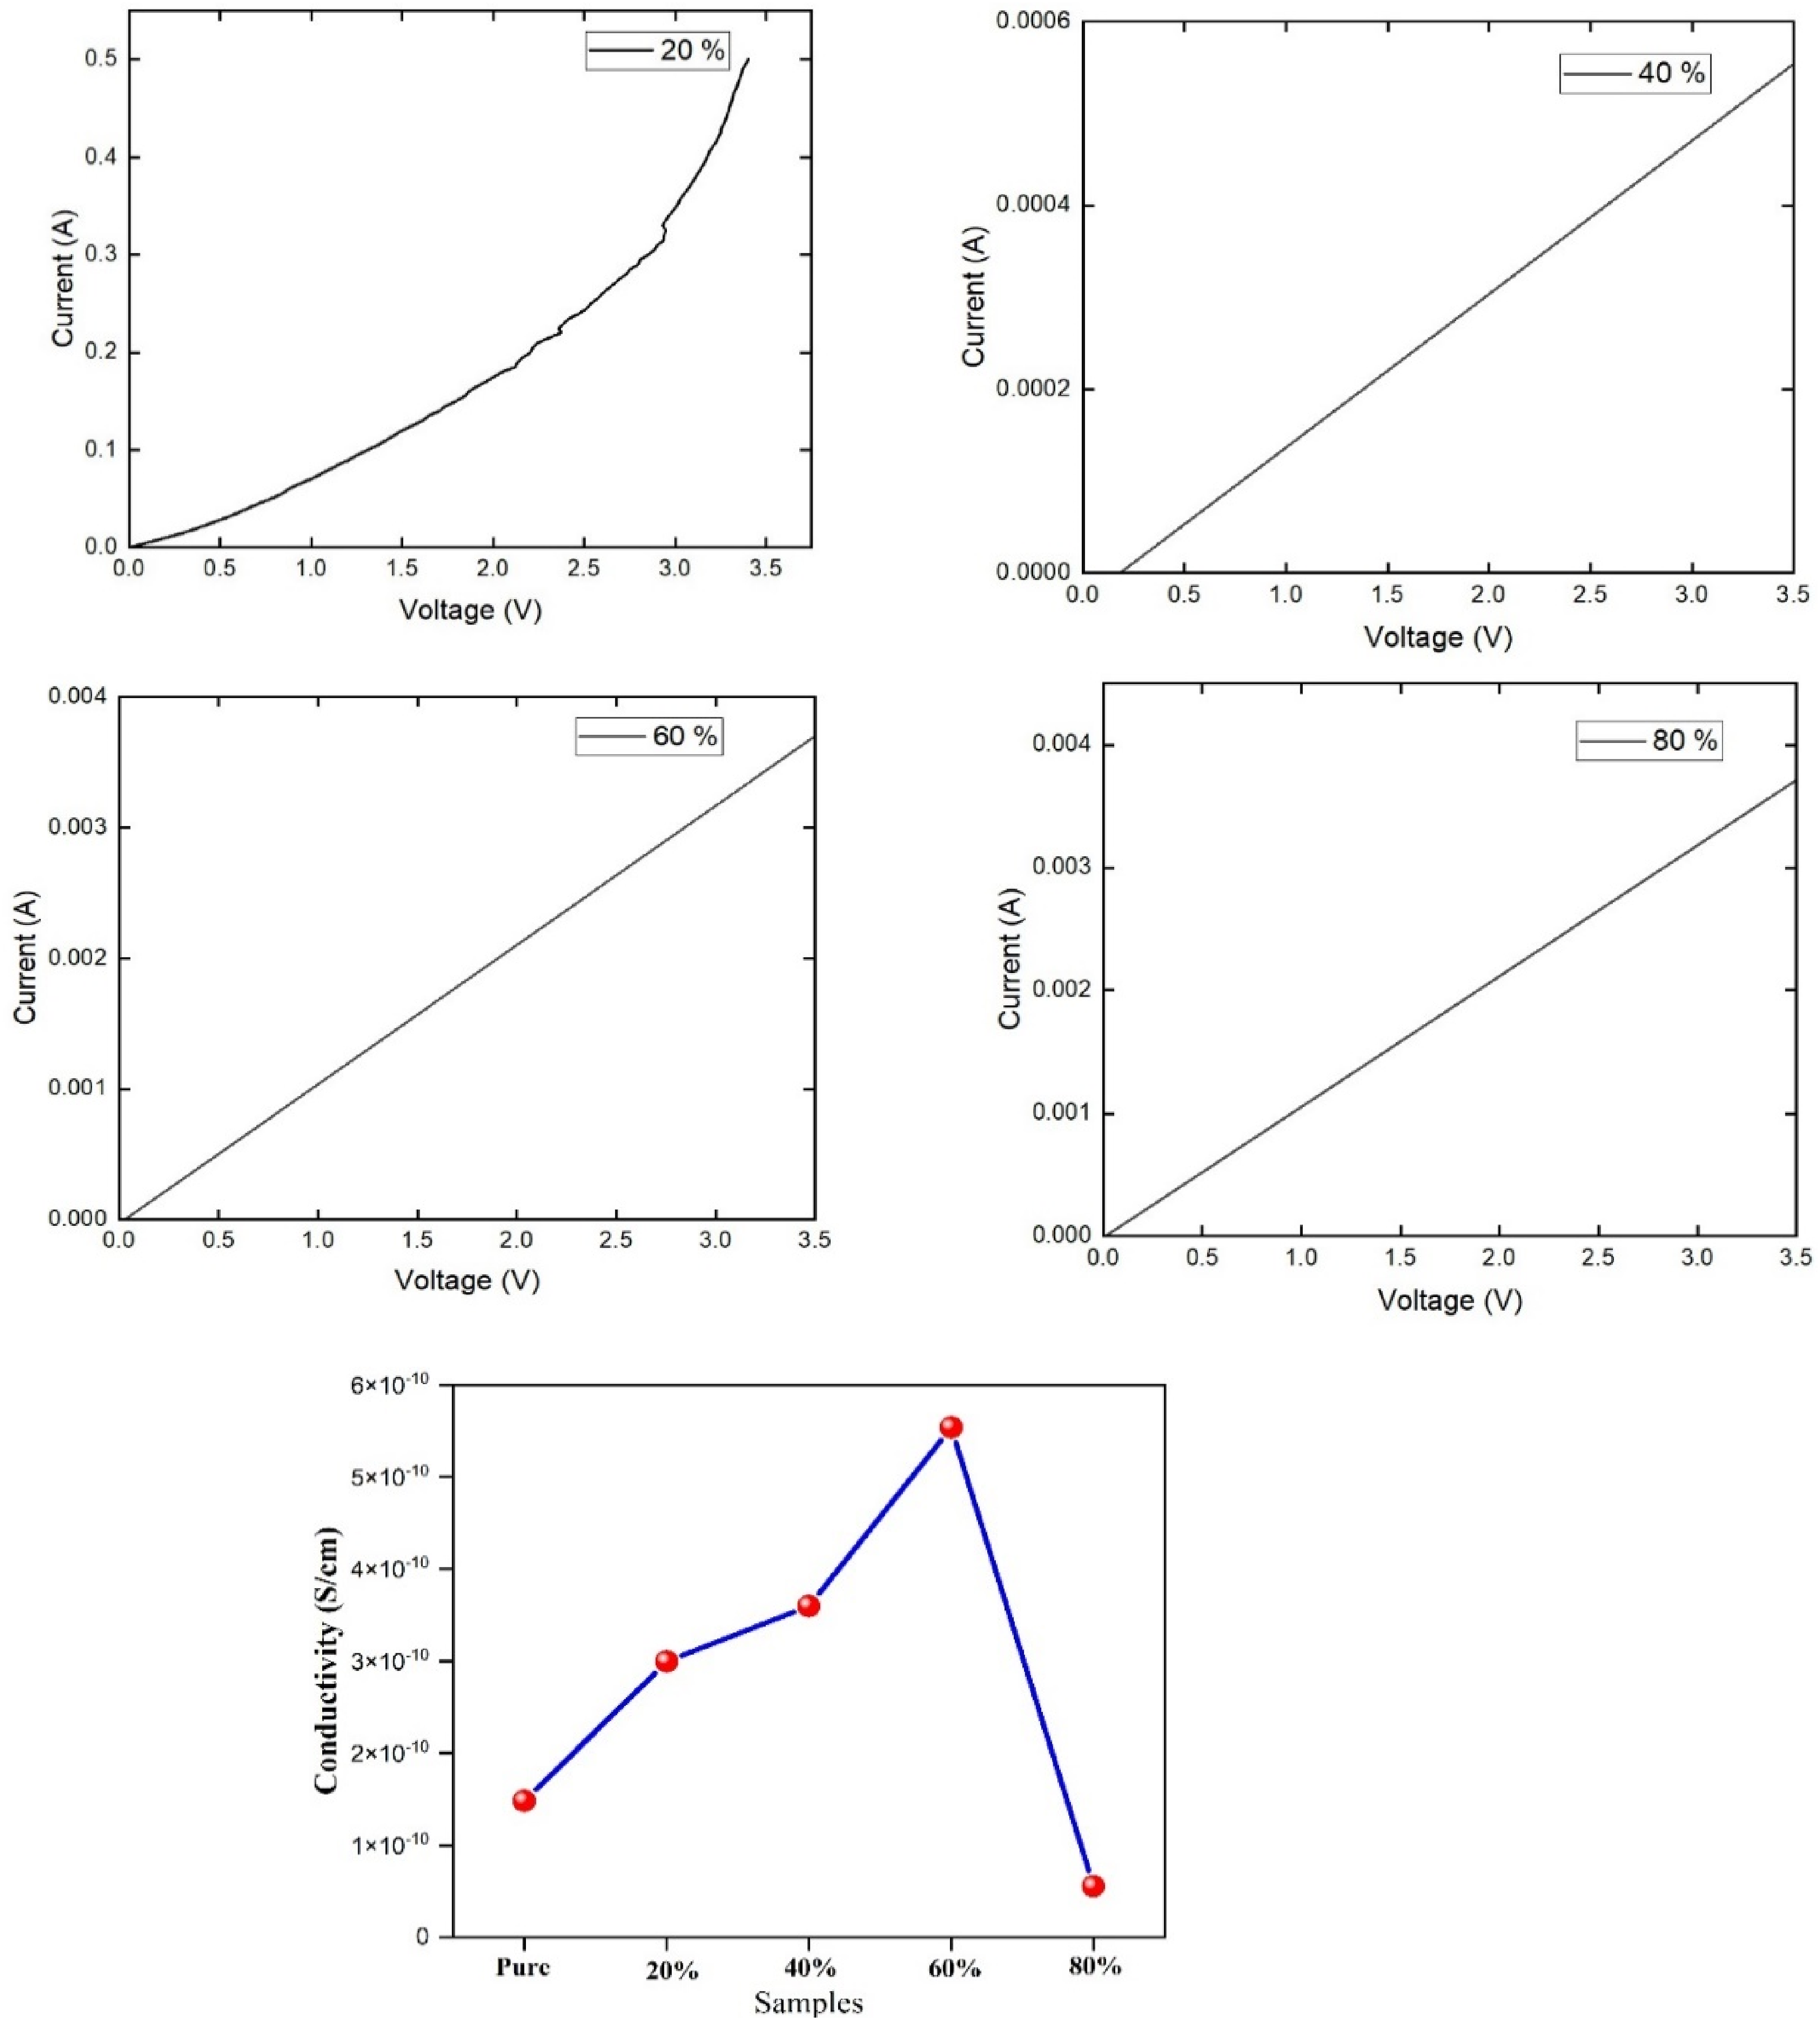
I-V characteristics and electrical conductivity of PANI/ZnO nano composites
In this experimental arrangement the samples were sandwiched between the copper electrodes with the help of pressure contact.
53
The resistivity was calculated at room temperature using the relation. I-V characteristics and Conductivity of PANI/ZnO nanocomposites with different weight percentage(20 wt%,40 wt%, 60 wt% and 80 wt%).
Photocatalytic activities of PANI/ZnO nano composites
The decomposition of the methylene blue (MB) dye solution evaluated the photocatalytic behavior of pure PANI and PANI/ZnO under visible light exposure. Figure 10(a)–(e) shows the photo degradation of MB solution by the illumination of visible light. There is no distinct change in the blank MB dye concentration with and without exposing the light. Before the illumination of light, 46.8 %, 58.8 %, 77.4 %, 83.81 % and 95.26 % of MB solution was absorbed within 260 min by PANI and PANI/ZnO (20 %, 40 %, 60 % and 80 wt %) respectively. It shows that Pure PANI has lesser photo degradation performance than ZnO-doped PANI. After exposing the light, the concentration of methylene blue (MB) is gradually decreased by increasing the light irradiation time. The degradation performance of MB is in the order of pure PANI 20% < 40% <60% and < 80%) of ZnO nanoparticles. The lowest bandgap of 80 wt% ZnO shows the highest photocatalytic MB degradation performance.80 wt% ZnO exhibits 95% of MB dye which was removed within 260 min under the illumination of visible light. Table 2 shows Comparison of photocatalytic MB dye removal efficiency of PANI/ZnO nanocomposites with the recently reported nanocomposites. UV-Visible absorbance spectra of MB as a function of time for (a) PANI (b) PANI/ZnO 20 wt% (c)PANI/ZnO 40 wt% d)PANI/ZnO 60 wt% (e) PANI/ZnO 80 wt%. Comparison of photocatalytic MB dye removal efficiency of PANI/ZnO nanocomposites with the recently reported nanocomposites.

Figure 11(a) shows that the photodegradation of RhB dye solution as a function of irradiation time. Figure 11(b) represents the variation of the rate constant (k) for PANI/ZnO of the photocatalytic dye degradation under the visible light irradiations. The photocatalytic dye degradation processes were started after the completion of the adsorption–desorption equilibrium process. After 260 min under the visible light irradiation, the dye degradation efficiencies of the PANI and PANI/ZnO nanocomposites are shown in Figure 11(c). Degradation efficiency of photocatalysts was calculated by using the Equation. (a) Degradation time profile (b) Rate-Kinetic profile (c) degradation efficiency (d) rate constant. Crystalline phase, calculated bandgap, rate constant, and degradation efficiencies of BTCA doped polyaniline and PANI/ZnO nanocomposites.


Antibacterial properties of PANI/ZnO composites
Figure 12(a)–(b) show Antibacterial properties of PANI/ZnO composites. The antibacterial activity of the PANI/ZnO nanocomposite with 20, 40, 60 and 80 wt% percentage concentration were obtained using each sample with the concentration of 1 mg/mL of PANI/ZnO nanocomposite. (a) Antimicrobial activity of different concentrations of PANI/ZnO nanocomposites against P. aeruginosa. (b) Antimicrobial activity of different concentrations of PANI/ZnO nanocomposites against S. aureus.
The antibacterial activity of the PANI/ZnO nanocomposite with varying concentration was obtained. Pure microcrystalline PANI was used as a control with reference to 10 mg of Penicillin disc. The antibacterial activity of PANI/ZnO nanocomposite against P. aeruginosa and S. aureus was measured. P. aeruginosa and S. aureus are general bacteria that are found on the contaminated wound. From Figure 10(a), it was found that the PANI nanocomposite exhibited an inhibition zone with diameter of 8 mm. The inhibition zones of the PANI/ZnO nanocomposite with 20, 40, 60 and 80 wt% for P. aeruginosa and S. aureus were 6, 8, 10, 13 and 7, 10,10, 11 mm respectively, while inhibition zone of the PANI/ZnO nanocomposite with 80 wt % of for P. aeruginosa and S. aureus was 13 mm and 11 mm, respectively, the result clearly demonstrated that the PANI/ZnO nanocomposite with reference to Penicillin antibiotic showing the inhibition zone of 22 and 37 mm. PANI/ZnO nanocomposite with high concentration of 80 wt% ZnO had good antibacterial activity against both P. aeruginosa and S. aureus, and the antimicrobial activity against P. aeruginosa is higher than that against S. aureus, probably due to the difference in cell wall between Gram-negative and Gram-positive bacteria. As the concentration of PANI/ZnO nanocomposite increased from 20 to 80%, the inhibition zone against S. aureus was dramatically increased.
From the images, little inhibition zone was observed for the microcrystalline PANI as control of 8 mm diameter (Figure 10), implying that the microcrystalline PANI do have antibacterial properties. These results clearly indicate that the antibacterial activity is enhanced with increase in concentration of ZnO nanoparticles which were impregnated inside PANI and not due to the microcrystalline PANI alone.
TEM and SAED analysis of PANI/ZnO composites
Figure 13(a)–(c) shows HRTEM images of 80 wt% PANI/ZnO nano composites for different magnifications. The particles have a spherical morphology. The particle size was found to be 36.8 nm. Figure 12(d) shows the interplanar distance of 0.28 nm. Figure 12(e) shows the SAED pattern of PANI/ZnO nano composites. The circular ring patterns in the SAED output have been indexed with the corresponding levels (110), (101) and (100) (JCPDS. 41-0254). The bright spots indicate polycrystalline nature of synthesized nanocomposites. TEM and SAED pattern of PANI/ZnO nano composites.
The diffraction rings of the SAED pattern matched well with the peaks of the XRD pattern, which confirmed the corresponding SAED patterns related to hexagonal Wurtzite crystals of ZnO. Interplanar distance can be calculated from the SAED pattern by the relation D = 2/distance between bright spots = 1/r.
Cytotoxic activity against HCT 116 cancer cells
The cytotoxicity analysis of the PANI and PANI–ZnO nanocomposites are evaluated using MTT assay at different concentrations (25,50and 100 μg/mL). From the result of this study, it is clear that all samples are highly toxic leading to apoptosis of HCT-116 cell line. The present viability of control cells is observed at 100%, which is dropped to 66.37% for PANI/ZnO(80 wt%),65.49% for PANI/ZnO (20 wt%) and 56.17% for PANI.
It can be seen in (Figure 14(a)–(c)), the viability of cells reduced as the nanoparticle concentration increased. The images of cell viability of PANI and PANI/ZnO nanocomposites (20 wt%and 80 wt%) against HCT-116 cell lines for various concentrations is shown in Figure 15(a)-(c), respectively. For lower value of viable cells, the higher concentration of PANI/ZnO nanocomposites against HCT-116 cell lines. The 80 wt% ZnO is released Zn2 + which can trigger the formation of intracellular ROS, which may be the main factor for oxidative stress and cell damage.
60
The necrotizing effect of PANI and PANI/ZnO composites is uncertain and molecules responsible for cell apoptosis can be subjected for further research. The current study finds the significant anti cancerous effect on HCT-116 cell lines is efficient using ZnO composites thanTiO2 composites.
61
Cytotoxic effect of PANI and PANI/ZnO nanoparticles on HCT-116 cells at different concentrations. a) PANI (b) PANI/ZnO (20 wt%) (c) PANI/ZnO (80 wt%). Images of cell viability of PANI and PANI/ZnO nanoparticles on HCT- 116 cell line. (a) PANI (b) PANI/ZnO (20 wt%) (c) PANI/ZnO (80 wt%).
Conclusions
PANI/ZnO composites were synthesized by in-situ polymerization with various concentration of ZnO. XRD pattern show hexagonal structure of nanocomposite. SEM images show spherical morphology for polyaniline and PANI/ZnO composites reveals strong interaction of ZnO with PANI. The anticancer study shows that reactive oxygen species (ROS) produced in most interactions between ZnO nanoparticles and cells is a major factor in the cytotoxicity mechanisms of PANI/ZnO nanocomposites. These interactions lower the cell’s defence mechanisms and ultimately cause apoptosis in the cells. The decrease in conductivity for the 80 wt% ZnO/PANI composite may be due to the partially hindered conductive channel and shorter conjugation length between PANI chains induced by an excess of ZnO nanoparticles within the PANI matrix. PL analysis shows that the green emission of ZnO nanoparticles is caused by oxygen vacancies or zinc interstitials on their surface. FTIR study confirms the stretching vibrations of Zn-O in the composite structure. The zone of inhibition is increased with increasing concentration of ZnO lattice. Therefore by addition of ZnO nanoparticles, we obtain good antibacterial activity against both P. aeruginosa (Gram-negative bacteria) and S. aureus (Gram-positive bacteria). The photocatalytic activity indicated the substantial degradation of MB dye by 95% over the surface of PANI/ZnO nanocomposite catalyst under light illumination. EDAX analysis showed the presence of Zn,C and O. TEM analysis showed spherical morphology of 36.8 nm. Optical analysis establishes a band gap was found to be 1.65 eV to 1.30 eV with increase in ZnO wt%.
Footnotes
Acknowledgments
The authors extend their sincere appreciation to the Researchers Supporting Project number (RSP2024R266), King Saud University, Riyadh, Saudi Arabia for the support. The authors are thankful to sophisticated test and Instrumentation Center, Cochin (Kerala), and Sri Ramakrishna Mission Vidyalaya College of Arts and Science, Coimbatore, Tamilnadu, India for providing instrumental facilities.
Authors contributions
Declaration of conflicting interests
The author(s) declared no potential conflicts of interest with respect to the research, authorship, and/or publication of this article.
Funding
The authors extend their sincere appreciation to the Researchers Supporting Project number (RSP2024R266), King Saud University, Riyadh, Saudi Arabia for the support.