
Abstract
A green and biodegradable hemp/cotton spunlaced nonwoven was developed to research oil flowing property and practical application. The filtration area of nonwoven and flux of experimental oil have great influence on pressure drop. Filtration area, thickness, mean pore diameter, porosity, and fiber diameter of hemp/cotton spunlaced nonwoven, flux, and density of experimental oil are used to verify previous pressure drop theories and permeability coefficients. The results demonstrate that Reynolds number of hemp/cotton spunlaced nonwoven at different fluxes is small (Re <1) at the state of laminar flow. Through 2D simulation of oil flowing through porosities of hemp/cotton spunlaced nonwoven on the basis of uniformly and disorderly arrangement fiber model, the results indicate that streamline of oil is curve in porosities in the case of fiber disorderly arrangement model. This paper mainly focuses on combining with practical application and theoretical simulation for better understanding the streamline shape and pressure drop distribution in the pores of material as clean oil flowing through porous nonwoven.
Introduction
Filtration material is a kind of porous permeable material, which can separate different particles from fluid as the fluid flowing through porous structure [1]. Pressure drop expressed by Hagen–Poiseuille’s equation is an important parameter for evaluating filtration property of materials as the fluid flowing through cylindrical tube in laminar flow [2]. Darcy’s law is another equation of expressing pressure drop, which can be calculated from the relation among permeability coefficient [3–5], filtration area, flux, thickness, and experimental liquid. The permeability coefficient of material and tortuosity of pores can also be used to evaluate flowing property of any liquid flowing through material for comparing the filtration property. Some porous materials are thought as cylinder aggregates of different cross sections and certain length pores in Kozeny–Carman’s equation.
Three parameters of nonwoven have important influence on filtration properties [6], i.e. fiber orientation (fiber axial direction is perpendicular or parallel to the flow direction) [7,8], multi-layer structure [9,10], and random structure (fibers arrange disorderly in 3D state) [11–13]. For nonwoven filtration material, thickness, filtration area, porosity, pore diameter, fiber type, fiber diameter, and preparation technology are important parameters for making oil filter. In addition, density and dynamic viscosity of experimental oil and experimental equipment for measuring pressure drop of oil at different fluxes are essential factors.
During the past decades, many attentions have been paid to simulating filtration process and calculating pressure drop of material in 2D geometry and 3D geometry. Kuwabara [14] was the first author to calculate the fiber-filtration efficiency of material in the case of mathematical cell model. The simple 2D (two-dimensional) structure of materials was used to simulate air-filtration efficiency and filtration mechanism [15–17], and 3D (three-dimensional) structure was used in nanofibrous filters [18]. Hosseini and Tafreshi [18] used 100-nm fiber diameter, 1.96 µm thickness, and 92.5% porosity of material, C++, and computational fluid dynamics method to simulate electrospun nanofiber filtration. Two-phase flow of particles and liquids in porous media can also be simulated and theoretically calculated [19–21]. In simulating filtration process, constitutive equation is the most important relations for modeling gas filtration and liquid filtration [22–25].
Through previous works [14–22], we know that the fluid is mainly flowing through the porous structure of nonwoven. The following researches [3,13,22,23] did not mention which fluid was used in their research. In addition, more attentions were paid to the theoretical research and modeling gas filtration in Kothari et al. [1], Vallabh et al. [5], Wang et al. [10], Rao and Faghri [16], and Lawrence and Liu [26], while less focuses were given on automotive engine oil filter and liquid filtration. Moreover, effect of filtration area of material and flux of experimental oil on pressure drop and Reynolds number were rarely reported in these literatures.
In this paper, the new automobile engine oil-filtration material of hemp/cotton spunlaced nonwoven was prepared by our previous work for practical application and solving these existing problems. Therefore, the main research contents and innovation points of this article are as follows: (a) hemp/cotton spunlaced nonwoven prepared by us for actual application and theoretical research is different from commonly used automobile engine oil-filtration materials. The innovative preparation process and oil-filtration property research of hemp/cotton spunlaced nonwoven are beneficial to improve the value of hemp fiber and expand application field of ramie, flax, jute, kenaf, sisal, and manila hemp. (b) Effect of filtration area of material and flux of experimental oil on pressure drop is analyzed in detail for verifying previous pressure drop theories and understanding the change of pressure drop in practical application. (c) 2D simulation method of uniformly and disorderly arrangement fiber model is used to analyze the pressure drop distribution and streamline shape of clean oil flowing through hemp/cotton spunlaced nonwoven.
Experimental
Raw materials of hemp fiber and cotton fiber
Research center of China-hemp is the only research institute on manufacturing, structure, and property researching and application study of hemp fiber in China. Therefore, hemp fiber, rather than other fibers of ramie, flax, jute, kenaf, sisal, and Manila hemp, is used to manufacture nonwoven for application research in this paper. Due to the stiffness of hemp fiber, it is difficult to manufacture 100% hemp fiber spunlaced nonwoven by existed equipment. So, 40% soft cotton fiber is used to prepare hemp/cotton blended spunlaced nonwoven on the basis of easily producing requirement. In our previous researches, we know that the range of fiber diameter, thickness, and mass per square area of 10 commonly used automobile engine oil-filtration materials is 3.42–24.4 µm, 0.61–3.895 mm, and 76.14–667.85 g/m2, respectively. Therefore, fiber diameter of hemp fiber and cotton fiber, thickness, and mass per square area of hemp/spunlaced nonwoven was decided on the basis of the parameters of these 10 commonly used automobile oil-filtration materials for developing new filter.
In this paper, hemp fiber purchased from Hemp Industry and Investment Co., Ltd. (Yunnan, China) and long staple cotton fiber provided by Shandong Huayue Group (Shandong, China) are used to prepare hemp/cotton spunlaced nonwoven. Diameter and length of hemp fiber and cotton fiber are measured by XSP-BM Optical Microscope and Manual Measurement method on the basis of our own laboratory equipment, respectively. Then, the mean value, standard deviation, and coefficient variation of fiber diameter and length of hemp and cotton are shown in Tables 1 and 2, respectively. Samples and SEM figures of hemp fiber and cotton fiber are shown in Figure 1.
Samples and SEM figures of hemp fiber and cotton fiber. (a, b) Hemp fiber and (c, d) cotton fiber. Fiber diameter of hemp fiber and cotton fiber. Length of hemp fiber and cotton fiber.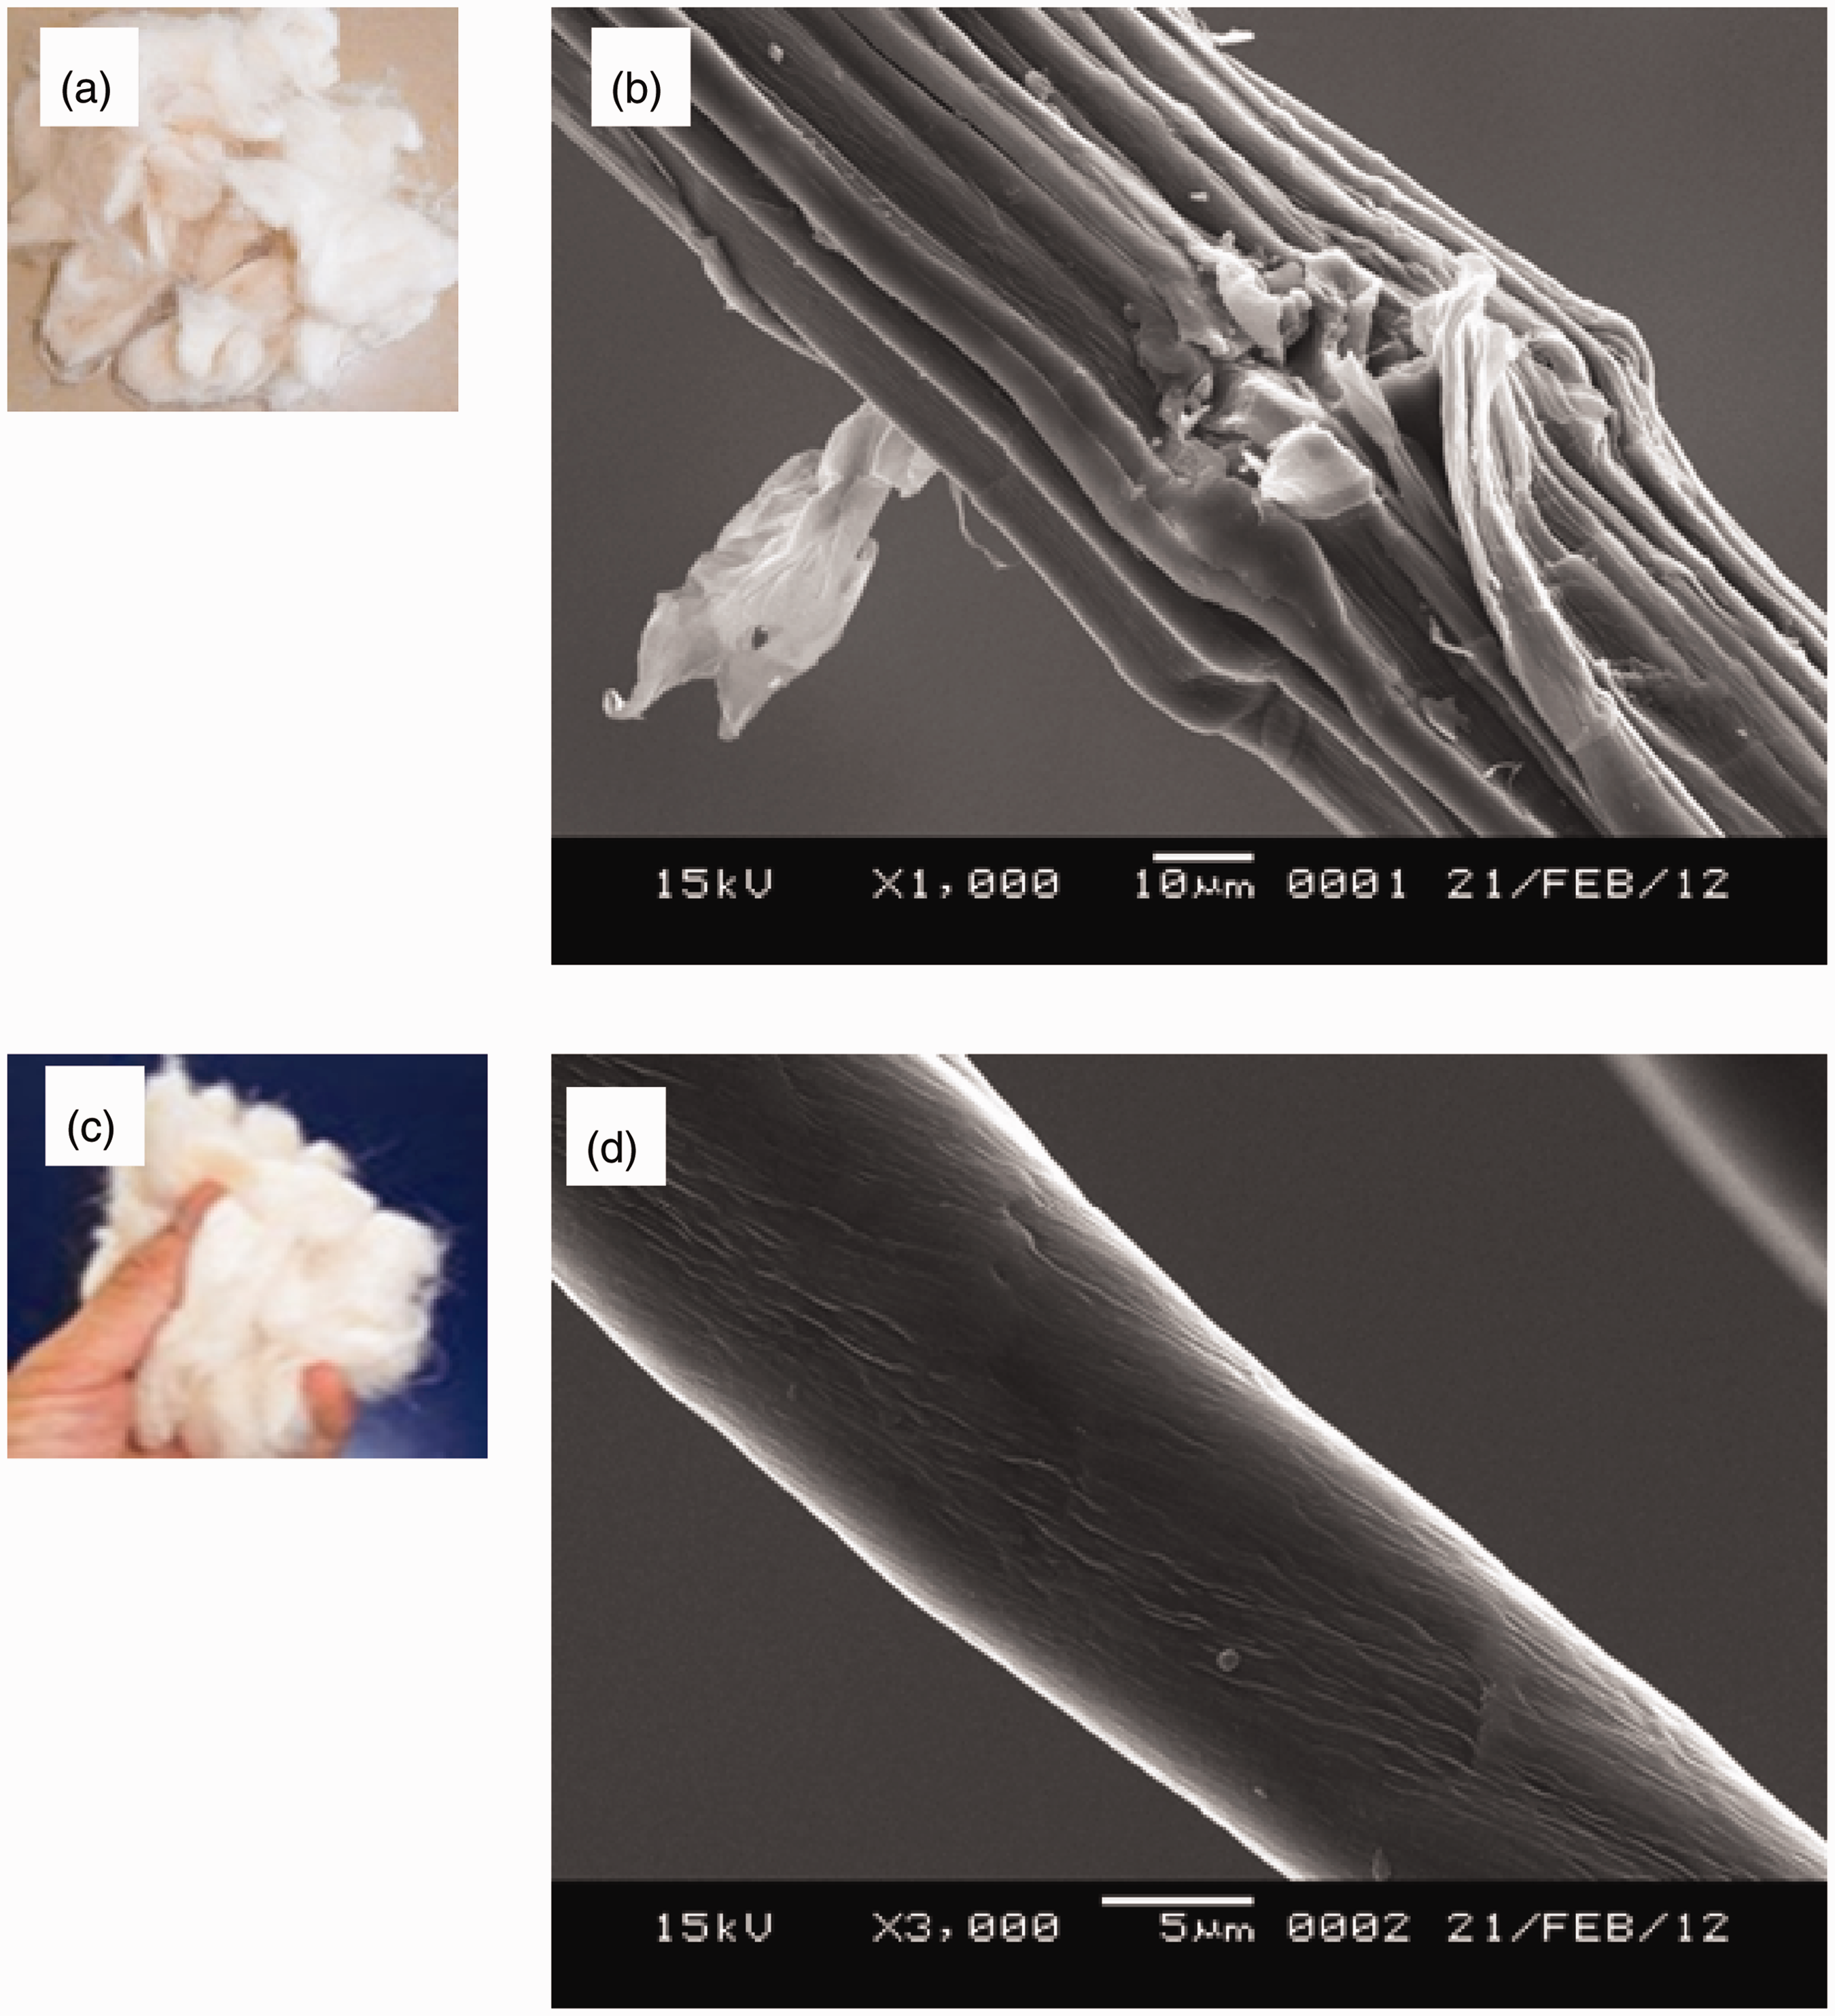


It can be found that the diameter of hemp fiber and cotton fiber is 14.306 and 14.750 µm, respectively. Length of hemp fiber and cotton fiber is 27.88 and 34.12 mm, respectively. Length, diameter, and blend ratio of hemp fiber and cotton fiber and preparation technology expressed in detail in this paper can be used as a reference for subsequent manufacturing of other hemp nonwovens and developing nonwovens of ramie, flax, jute, kenaf, sisal, and manila hemp. In order to simulate more conveniently in modeling process and get better accuracy in calculating in the following pages, the mean value, maximum, minimum, standard deviation, and coefficient variation of hemp fiber and cotton fiber are expressed in detail.
Preparation of hemp/cotton spunlaced nonwoven
After the processes of opening, impurity removing, blending, humidification, second blending, fine opening, pneumatic feeding cotton (BG179 Air pressure hopper), carding (BG218 Double doffer card machine), cross lapping, drafting (FZQS Drafting machine), and spunlaced reinforcement (small spunlaced reinforcement experimental equipment with no machine type), the hemp/cotton (60/40) nonwoven was manufactured (as seen from Figure 2). The webs were reinforced by first water prod head at pressure of 1.5 × 10⁶ Pa and second water prod head at pressure of 7 × 10⁶ Pa and then reinforced by the first water prod head at pressure of 1.5 × 10⁶ Pa and second water prod head at pressure of 9 × 10⁶ Pa.
Equipment of preparation process and SEM figures of hemp/cotton spunlaced nonwoven. (a) Drafting process, (b) spunlacing process, and (c) SEM figure (×100).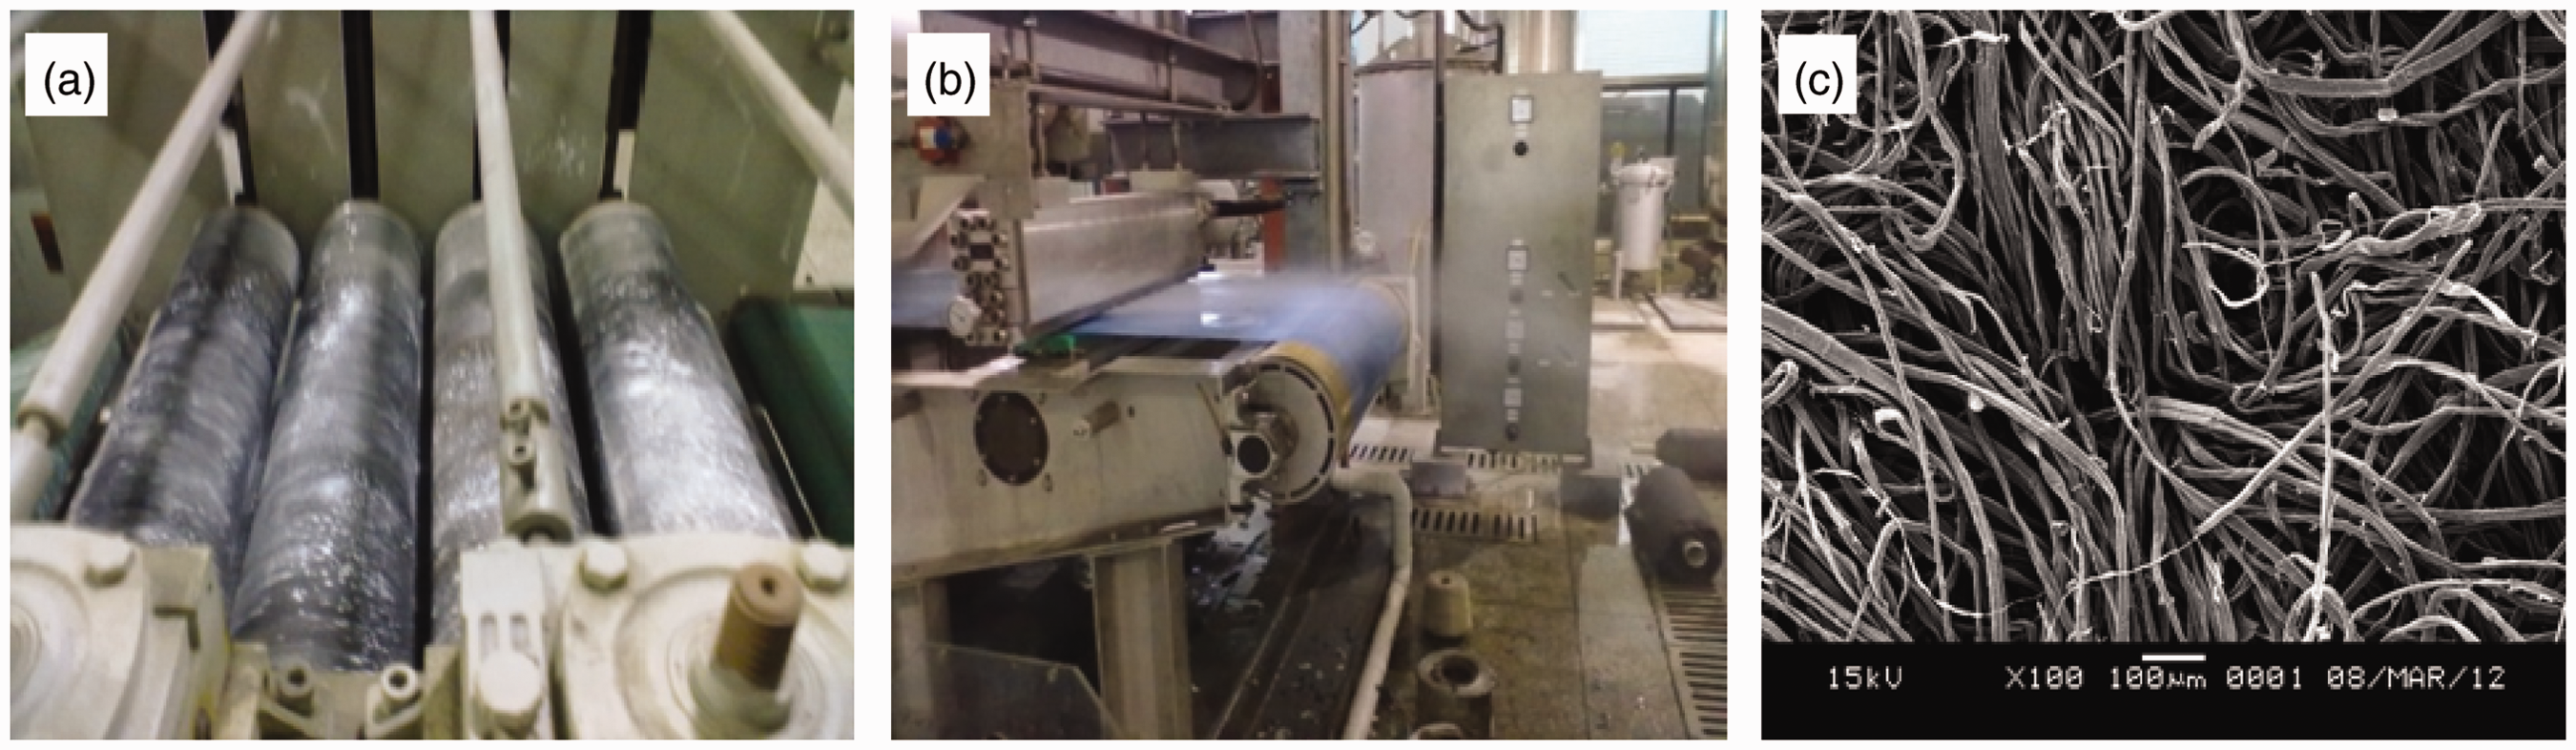
Measurement
The weight (mass per square area) of hemp/cotton (60/40) spunlaced nonwoven measured by AR 2140 electronic balance is 152.73 g/m2. The thickness of hemp/cotton (60/40) spunlaced nonwoven measured by YG141N fabric thickness gauge is 1.173 mm. Mean pore diameter of hemp/cotton (60/40) spunlaced nonwoven measured by MP-15 Kβ
x
(as seen from Figure 3(a)), which manufactured by Xinxiang Tianyi Filtration Technology Co., Ltd. (Henan, China), is 69.7 µm. Porosity of hemp/cotton (60/40) spunlaced nonwoven measured by AutoPore IV9500 Mercury Injection Apparatus, which is manufactured by USA (as seen from Figure 3(b)) at Tsinghua University (Beijing, China), is 0.8499. Due to limited samples and fewer test times of hemp/cotton spunlaced nonwoven in preliminary experiment, weight, thickness, and mean pore diameter of nonwoven cannot be given as the mean value plus their standard variations like Tables 1 and 2 in this paper. Fiber diameter of hemp fiber and cotton fiber, thickness, and mass per square area of hemp/spunlaced nonwoven prepared by us is in the range of 10 common oil-filtration materials for practical application, respectively.
Equipment of measuring pore diameter and porosity. (a) MP-15 Kβ
x
equipment and (b) AutoPore IV9500 Mercury Injection Apparatus.
LCS-6 experimental equipment, which has 100-cm2 filtration area and 0–4 L/min flux range, and D-30 experimental system, which has 113-cm2 filtration area and 0–6 L/min flux range, are used to measure the pressure drop at different fluxes. The density and kinematic viscosities of experimental oil are 850 kg/m3 and 15 cSt (cSt is not international unit), respectively. The properties of experimental oil provided by Xinxiang Tianyi Filtration Technology Co., Ltd. are used to measure the pressure drop of oil at filtration area 100 and 113 cm2. Apparatuses of LCS-6 experimental equipment and D-30 experimental system and experiment processes of measuring pressure drop at A = 100 cm2 and A = 113 cm2 are shown in Figure 4. First, the samples should be cut in filtration area A = 100 cm2 and A = 113 cm2. The samples are fixed on the equipment for clean oil-flowing samples (as seen from Figure 4(b) and (c)), and then the values of pressure drop at different fluxes can be seen from the pressure display device.
Equipment of measuring pressure drop of oil. (a) LCS-6 experimental equipment (constant filtration area A = 100 cm2), (b) oil tube, (c) different samples are put into the vessel, and (d) D-30 experimental system (constant filtration area A = 113 cm2).
Results and discussion
Effect of filtration area and flux on pressure drop
Due to the long and complex manufacturing technology of preparation hemp/cotton spunlaced nonwoven, some section of hemp/cotton spunlaced nonwoven is uneven in the same sample. So, it is difficult to research the effect of filtration area on pressure drop on the basis of same equipment and fixed test area. In order to accurately know the relation between filtration area and pressure drop for one sample, two different available equipments, which had various filtration areas for same hemp/cotton spunlaced nonwoven, are used to measure the pressure drop of clean oil at different fluxes. The flow direction of clean oil measured at filtration area 100 and 113 cm2 is perpendicular to the fiber axis of hemp/cotton spunlaced nonwoven.
There are many factors that can affect the result of the pressure drop in the process of experiment, i.e. filtration area, thickness, fiber distribution uniformity of hemp and cotton, pore diameter, and porosity of hemp/cotton spunlaced nonwoven, density and dynamic viscosity of experimental oil, and experimental apparatus. In order to study the influence of filtration area on pressure drop exclusively, other factors that have the same influence on pressure drop or other same factors are used in two experiments. However, it is difficult to ensure the completely same factor in the process of experiment on the basis of some insurmountable human errors.
Some assumptions can be made in the process of analysis and research for eliminating errors: (a) two same and uniformly hemp/cotton spunlaced nonwovens are measured by LCS-6 experimental equipment (constant filtration area A = 100 cm2) and D-30 experimental system (constant filtration area A = 113 cm2) in the experiment. Due to uneven of hemp/cotton spunlaced nonwoven in manufacturing process, two completely same samples containing different filtration areas are carefully selected for reducing the errors in experiment. (b) The influence of two equipments containing LCS-6 experimental equipment (manufactured by Xinxiang Tianyi Filtration Technology Co., Ltd., Henan Province of China) and D-30 experimental system (manufactured by Machinery products quality supervision and inspection center of aviation industrial filtration and separation, Henan Province of China) on pressure drop is same in the process of experiment. (c) The same oil is used by LCS-6 experimental equipment and D-30 experimental system for comparing. Therefore, the influence of experimental oil on pressure drop is same for A = 100 cm2 and A = 113 cm2.
It is indicated from Figure 5 that filtration area 113 cm2 has smaller pressure drop than filtration area 100 cm2 at different fluxes. Moreover, the filtration area 113 cm2 has smaller pressure drop change as the increasing of flux, while filtration area 100 cm2 has larger changes at same flux. Difference of pressure drop between 113 and 100 cm2 at same flux generated on both sides of hemp/cotton spunlaced nonwoven increases as the increasing of flux.
Effect of filtration area and flux on pressure drop.
Change of pressure drop for clean oil with the increasing of flux is similar to the previous researcher’s results. Kothari et al. [1] used two different types of materials containing woven fabric (parameters of weave fabric are 2/2 twill weave, 1.35 mm thickness, 580 g/m2 weight, 135 tex polyester yarn of warp and 165 tex polyester yarn of weft, 205 warps/dm, and 106 wefts/dm) and nonwoven fabric (parameters of nonwoven fabric are polyester needling nonwoven, 4.11 mm thickness, and 540 g/m2 weight) to research pressure drop of air at different flow rates. The results indicated that pressure drop of weave fabric and nonwoven fabric increased as the increasing of air flow rate as a result of increasing resistance. Therefore, pressure drop of clean oil increases with the increasing of flux due to increasing resistance.
It is demonstrated from Figures 4 and 5 that only 13 cm2 differences in filtration area can produce obvious difference of pressure drop at same flux in the case of previous three assumptions. The significant difference of pressure drop between 113 and 100 cm2 can be interpreted from the following two aspects. (a) The larger filtration area of sample produces smaller resistance at the condition of same flux, while the smaller filtration area of sample generates higher resistance as the clean oil flowing through its porosities. So, filtration area of 100 cm2 produces higher pressure drop than 113 cm2 at same flux as a result of higher resistance. (b) Due to limitations of experimental equipment on oil pressure drop measurement, few people study the influence of filtration area on pressure in previous literatures. In this paper, we assume that two different equipments containing LCS-6 experimental equipment and D-30 experimental system have the same effect on pressure drop in experimental process. However, the experimental results are not like previous assumptions in the comparison of pressure drop at same and different fluxes. The only 13 cm2 difference in filtration area can produce obvious difference of pressure drop. Moreover, the difference of pressure drop increases with the increasing of flux. It seems that the experimental equipment may affect the results of pressure drop on the basis of obvious differences in two curves.
Verification of previous pressure drop theories
Previous different pressure drop theories.

Values of different parameters in Table 3.

Values of different parameters are shown in Tables 4 and 5. Re (Reynolds number) at A = 100 cm2 and A = 113 cm2 can be obtained from equations (4) or (5). d, d², r, r², ɛ, α, ɛ², t, μ, d
f
², α³, Comparison of pressure drop between experimental value and theoretical value. (a) Filtration area A = 100 cm2 and (b) filtration area A = 113 cm2. Values of 

The difference of pressure drop between experimental values and theoretical values can be expressed from three reasons. (a) Different filtration materials: The filtration material is electrospinning PAN and chitosan-coating composite membrane in Yoon’s paper, any porous material in Davies’s equation, ceramic foam filter in Ambrogio’s paper, and polypropylene, polyester, and aramid fiber nonwovens in Lawrence’s equation. While hemp/cotton spunlaced nonwoven is in this paper
Obvious difference of pressure drop between theoretical values and experimental values at A = 100 cm2 and A = 113 cm2 is shown in Figure 6. It can be found that values of pressure drop at A = 100 cm2 and A = 113 cm2 have similar trend at different fluxes. Comparing the pressure drop with previous theoretical values, the results demonstrate that the experimental values of pressure drop at A = 100 cm2 have larger difference than A = 113 cm2. It can be seen from previous analysis in Figure 5 that experimental instrument for measuring pressure drop of oil may have an effect on the results. Comparison result at A = 100 cm2 and A = 113 cm2 shown in Figure 6 is a good evidence for demonstrating the validity of assumption. Due to larger difference between theoretical values and experimental values at A = 100 cm2, pressure drop measured by LCS-6 experimental equipment has larger errors in this paper. So, D-30 experimental system manufactured by Machinery products quality supervision and inspection center of aviation industrial filtration and separation for measuring pressure drop of oil has better accuracy and smaller errors.
Characterization of permeability coefficient
The mechanism of automobile engine oil flowing through porous spunlaced nonwoven is in accordance with the theoretical equation of Darcy’s Law, which can be expressed as follows [31]

The dynamic viscosity of experimental oil relates to kinematic viscosity and density can be defined as [32]

Theoretical equation of permeability coefficient.

Values of different parameters of Table 4.

The experimental values of pressure drop of hemp/cotton spunlaced nonwoven at different fluxes and filtration areas are shown in Table 8. Compared with the experimental values of pressure drop at different fluxes, it can be indicated that pressure drop of oil calculated from different permeability coefficient is very small. Due to the larger difference of pressure drop between theoretical values and experimental values in the same figure, only theoretical pressure drop calculated from different equations in Table 6 at A = 100 cm2 and A = 113 cm2 is shown in Figure 7. It can be found that the pressure drop calculated from A = 100 cm2 and A = 113 cm2 increases with the increasing of flux of experimental oil. Difference of pressure drop between A = 100 cm2 and A = 113 cm2 shows the same trend with the increasing of flux as the previous analysis in Figure 6. Smaller filtration area of A = 100 cm2 has larger pressure drop at different fluxes in these four equations, which is consistent with the previous analysis in Figure 5.
Theoretical pressure drop calculated from different permeability coefficient. (a) Filtration area A = 100 cm2, (b) filtration area A = 113 cm2, and (c) comparison of pressure drop calculated from equations in Table 4 between A = 100 cm2 and A = 113 cm2. Experimental pressure drop at different filtration area.

The difference of pressure drop between experimental values and theoretical values calculated from permeability coefficient and Darcy’s law can be expressed from two reasons. (a) Different oil flowing directions: The experimental clean oil flowing perpendicular to fiber axis of hemp/cotton spunlaced nonwoven is different from equations in Table 6. (b) Different fiber distributions and arrangements: The fibers distributed in three-dimensional and random state in Koponen’s research and Tomadakis’s paper are similar to our research of hemp/cotton spunlaced nonwoven. However, due to the combination of permeability coefficient and Darcy’s law for calculating pressure on the basis of theoretical model, there is an obvious difference of pressure drop between experimental values and theoretical values. Therefore, it is not suitable to directly use combination of permeability coefficient and Darcy’s law for calculating pressure drop of clean oil.
Process and Reynolds number of clean oil flowing through porous nonwoven
The process of pressure drop Process of clean oil flowing through hemp/cotton spunlaced nonwoven.
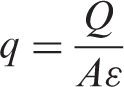
The flow rate q (area velocity, m/s) and flux Q (volume velocity, L/min) of cleaning oil flowing through porous nonwoven can be calculated from Boomsma and Poulikakos [38]
Re can be used to judge the state of fluid in porous material in the process of filtration [26]. If Re < 2300, the fluid is flowing through porous material at the motion of laminar flow. In fact, Reynolds number related to dynamic viscosity, flux, and the characteristics of pipeline [32] can be calculated from Wang et al. [39]

Combining equations (3) and (4), Reynolds number can be changed as

Equations (3) and (5) are used to calculate the flow rate and Reynolds number of hemp/cotton spunlaced nonwoven at different fluxes, respectively. Relation between flow rate, Reynolds number, and flux of oil at different filtration areas is shown in Figure 9. The results indicate that flow rate and Reynolds number of hemp/cotton spunlaced nonwoven decrease with the increasing of filtration area, while flow rate and Reynolds number increase with the increasing of flux of oil. Flow rate and Reynolds number of hemp/cotton spunlaced nonwoven almost have same values at 1 L/min and obvious differences at 5 L/min. Moreover, difference of flow rate and Reynolds number between A = 100 cm2 and A = 113 cm2 increases with the increasing of flux of oil. Due to smaller values of Reynolds number of hemp/cotton spunlaced nonwoven at different fluxes (Re < 1), it can be confirmed that the experimental oil flows through hemp/cotton spunlaced nonwoven at the state of laminar flow.
Relation between flow rate, Reynolds number and flux oil at different filtration areas. (a) Change of flow rate, and (b) change of Reynolds number.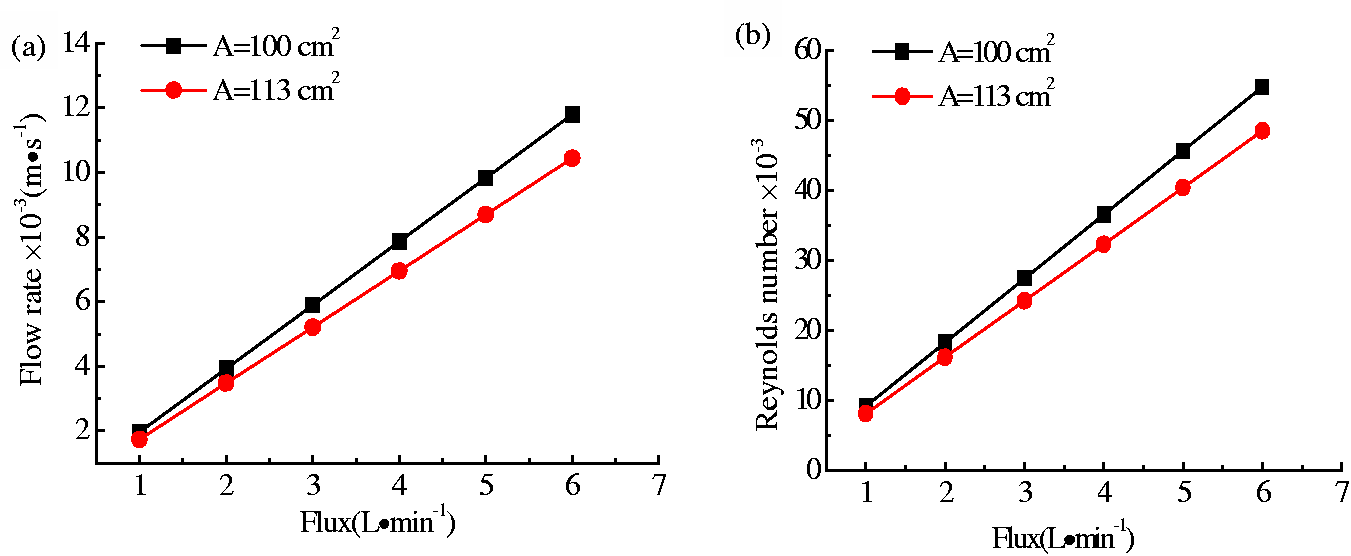
Theoretical simulation of clean oil flowing through hemp/cotton spunlaced nonwoven
Due to smaller values of Reynolds number (Re < 1) of hemp/cotton spunlaced nonwoven at different fluxes, it is necessary to simulate liquid stream and pressure drop distribution in pores of nonwoven at the state of laminar flow for theoretical analysis. The two-dimensional governing equation of clean oil flowing through hemp/cotton spunlaced nonwoven at the condition of laminar flowing can be expressed as follows [40]

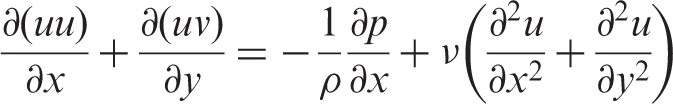
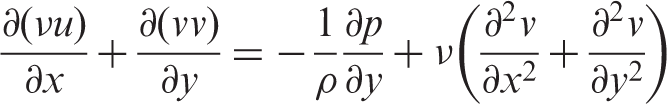
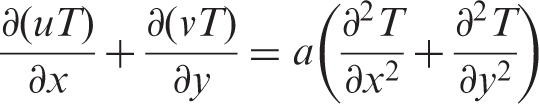
In the above equations, u and v are velocity along X-axis and Y-axis directions of two-dimensional geometry, respectively. ρ is oil density, p is pressure drop, and T is temperature.
Parameters of d
f
= 14.53 µm, ɛ = 0.8499, μ = 1.275 × 10⁻² Pa s, T = 40 + 273.15 = 313.15 K, and ρ = 850 kg/m3 are used to simulate two-dimensional internal flow field as the cleaning oil flowing through hemp/cotton spunlaced nonwoven. SEM figure of hemp/cotton spunlaced nonwoven is shown in Figure 10. Different from previous researches of completely theoretical simulating on the basis of mathematical model, this paper focuses on combining with practical application and theoretical simulation for better understanding the streamline and pressure drop distribution in the pores of material.
SEM figure of hemp/cotton spunlaced nonwoven (×1000).
Figures 11(a) and 12(a) are uniformly and disorderly arrangement fiber model in hemp/cotton spunlaced nonwoven, respectively. Figures 11(b) and 12(b) are pressure drop distribution state of uniformly and disorderly fiber model in hemp/cotton spunlaced nonwoven, respectively. Figures 11(c) and 12(c) are velocity distribution of uniformly and disorderly arrangement fiber model in hemp/cotton spunlaced nonwoven, respectively. It can be found that there is no difference of pressure drop distribution between uniformly and disorderly arrangement fiber model in hemp/cotton spunlaced nonwoven on the basis of same flux. Higher pressure drop generates on inlet and solid section of hemp/cotton spunlaced nonwoven as the clean oil flowing through porous material, while smaller pressure drop produces on the outlet and porosities of material.
Uniformly arrangement of fibers. (a) Geometric model (d
f
= 14.53 µm and ɛ = 0.8499), (b) pressure drop distribution (Δp = 0.6 kPa), and (c) velocity distribution. Disorderly arrangement of fibers. (a) Geometric model (d
f
= 14.53 µm and ɛ = 0.8499), (b) pressure drop distribution (Δp = 0.6 kPa), and (c) velocity distribution.

From Figure 12(c), we know that the flow rate is higher in porosities than in solid sections of material as clean oil flowing through hemp/cotton spunlaced nonwoven. The streamline of smaller fluid mixes to form larger liquid line in the form of tortuous state traversing through pores of nonwoven. The streamline is almost linear in uniformly arrangement fiber model and tortuous state in the disorderly arrangement fiber model. From SEM figure of hemp/cotton spunlaced nonwoven in Figure 10, we know that the fibers are in three-dimensional and disorderly arrangement. So, the uniformly arrangement fiber model is just an ideal situation in the case of hypothesis, and disorderly arrangement fiber model matches the clean oil flowing situation for practical application.
Conclusions
The green and biodegradable hemp/cotton spunlaced nonwoven is developed to research the oil flowing property. The filtration area of nonwoven and flux of experimental clean oil have great influence on pressure drop in the process of filtration. Pressure drop increases as the increasing of flux of oil and decreases with the increasing of filtration area. Filtration area, thickness, mean pore diameter, porosity, and fiber diameter of hemp/cotton spunlaced nonwoven, flux, and density of oil are used to verify the previous pressure drop theories and permeability coefficient. Compared with the experimental values of pressure drop, it is indicated that pressure drop calculated from different permeability coefficient has higher difference at different fluxes. Due to smaller difference of pressure drop between experimental values and theoretical values, pressure drop calculated from equation of Davies for gas filtration can also be used to calculate the pressure drop of clean oil.
The Reynolds number of hemp/cotton spunlaced nonwoven at different fluxes is small (Re < 1), which decreases as the increasing of filtration area while increases as the increasing of flux at the state of laminar flow. Through 2D simulation of oil flowing through porosities of hemp/cotton spunlaced nonwoven on the basis of uniformly and disorderly arrangement fiber model, the results indicate that streamline of oil is curve in porosities in the case of fiber disorderly arrangement model.
Footnotes
Declaration of Conflicting Interests
The author(s) declared no potential conflicts of interest with respect to the research, authorship, and/or publication of this article.
Funding
The author(s) received no financial support for the research, authorship, and/or publication of this article.