
Abstract
This article discussed the structural changes influenced by punching parameters and their impact on the functional properties of needle punched nonwoven. Three punching parameters i.e., punch density, needle penetration depth and stroke frequency were considered as process variables. Three factors three levels Box Behnken experimental design was used for sample preparation. Newly proposed structural indices were used to evaluate the fibre orientation in X and Y direction of fabric using tracer fibre technique. It was found that measured functional properties of fabrics are well correlated with considered structural indices. The fibre coverage area inferred an increase but coefficient of fibre curliness and anisotropy of inclination angle of fibre observed a decrease, with the increase of punch density, needle penetration depth and stroke frequency. Mean flow pore size followed an initial decrease and then, increase, but filtration efficiency and pressure drop followed an initial increase and then, decrease with the increase of punch density, needle penetration depth and stroke frequency. Finally, process parameters were optimized to achieve a filter media with maximum filtration efficiency and minimum pressure drop.
Introduction
The word nonwoven is taking over the world of technical textile. Large verity of nonwovens are available in the technical textile segment [1–6]. Earlier nonwoven fabrics were used as backing or supporting material. However, due to the higher production rate and low manufacturing cost, there has been a shift in the use of nonwovens. The end-user has become technology and fibre specific. For instance, needle punched nonwovens find applications as filters, interlinings, house furnishings, geotextiles, automotive trim and coated fabrics [7,8]. Das et al. [9] carried out a comparative study between thermal bonded and needle punched nonwoven. They found needle punched nonwoven performed better in terms of filtration efficiency and pressure drop. Kothari et al. [10] studied the impact of layering in a composite nonwoven air filter produced with different needle punching parameters. They investigated different functional, mechanical and physical properties with different punch density. They concluded that all properties are changing with changing the punch density up to a certain point. Hearle et al. [11] concluded that required fabric thickness and optimum packing density are controlled by the force applied in both surfaces of a nonwoven by the needle board. Lee et al. [12] studied the mechanical properties of nonwovens and concluded that the tensile strength increases with the increase in needle punch density. Roy et al. & Dixit et al. [13,14] observed that structurally induced gradient in layered structure is capable to provide higher filtration efficiency at minimum pressure drop. Pradhan et al. [15] used mixture of a different denier of fibre as gradient and found more effective for filtration efficiency, lower pressure drop and higher dust holding capacity. Neckář et al. [16] studied the orientation of fibres in the fibre webs using tracer fibre technique. The inclination of a huge number of fibres from the machine direction of the fibre webs was measured and the frequency distribution of the angle of inclination of fibres were obtained.
The formation of needle punched nonwoven involves the sequence of carding and punching processes. The carding process orients the fibres in a machine direction, whereas the punching integrates the carded webs into a single fabric. The orientation of fibres in X and Y planes is expected to be governed by both carding and punching parameters, hence, the properties of the nonwoven fabric. Roy et al. [17] studied the influence of carding parameters on orientation of fibres in un-punched and punched fibrous material, in X and Y directions at constant punching parameters. They observed disorientation of fibres in X and Y planes of the fabric, after punching process, due to inherent character of needling action. Therefore, it was felt necessary to study and optimize the punching parameters to retain fibre orientation in X and Y directions, provided by the carding process in the nonwoven fabric. Interestingly the literature is quite silent on the relation between needle punching parameters (punch density, needle penetration depth and stroke frequency) and the fibre orientation in the X and Y direction. Accordingly, the influence on orientation of fibres and its subsequent effect on filtration behaviour was studied using newly proposed structural indices of present authors [18,19].
Experimental
Materials and preparation of samples
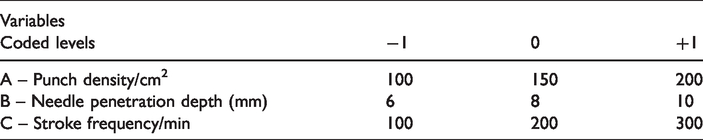
The research work was conducted by using viscose fibre of 1.5 denier with 38 mm staple length. Punch density, needle penetration depth and stroke frequency were considered as variables for the present set of experiments. Box & Behnken three factors three levels design as described by Thakur et al. [20], was used for sample preparation. The actual values of considered punching variables and three factors three levels of experimental design are shown in Tables 1 and 2 respectively.
Actual values of variables corresponding to coded values.
Box Behnken design for three variables.

All 15 samples were prepared with a constant combination of 0.164 m/min feeder speed, 250 m/min cylinder speed and 6.98 m/min doffer speed. Fibre orientation of carded batts was measured by using lindsley’s technique [21] and the measured value of proportion of curve fibre ends and coefficient of relative parallelization were found to be 0.190 & 0.560 respectively. The carded batts were punched from the top side to obtain final fabrics. The basis weight of all samples was kept constant at 200 ± 5 gsm. The selected SEM images of nonwoven fabric are given in Figure 1.

Images of nonwoven filter media- (a) optical microscopic image, (b, c & d) SEM images.
Evaluation of fibre orientation in X and Y direction and properties of needle punched nonwoven
In order to study the orientation of fibres in nonwoven structure, 0.3% of tracer fibres was used in parent mixing. In addition, α-methyl styrene was used as an optical reagent. Nikon SMZ microscope was used to measure the fibre configuration in X and Y direction of fabric. Following structural indices were used to evaluate the orientation of fibres in punched fabrics.
Coefficient of fibre curliness
The coefficient of fibre curliness is defined as the ratio of fibres extent to the actual length of the fibre and is expressed as given below:
where, lfe is the fibre extent and lfl is the actual fibre length. The value of the coefficient of fibre curliness lies in between 0 to1. Higher the value of coefficient of fibre curliness, more the fibre is aligned towards X direction (machine direction). The configuration of fibre is shown in Figure 2.
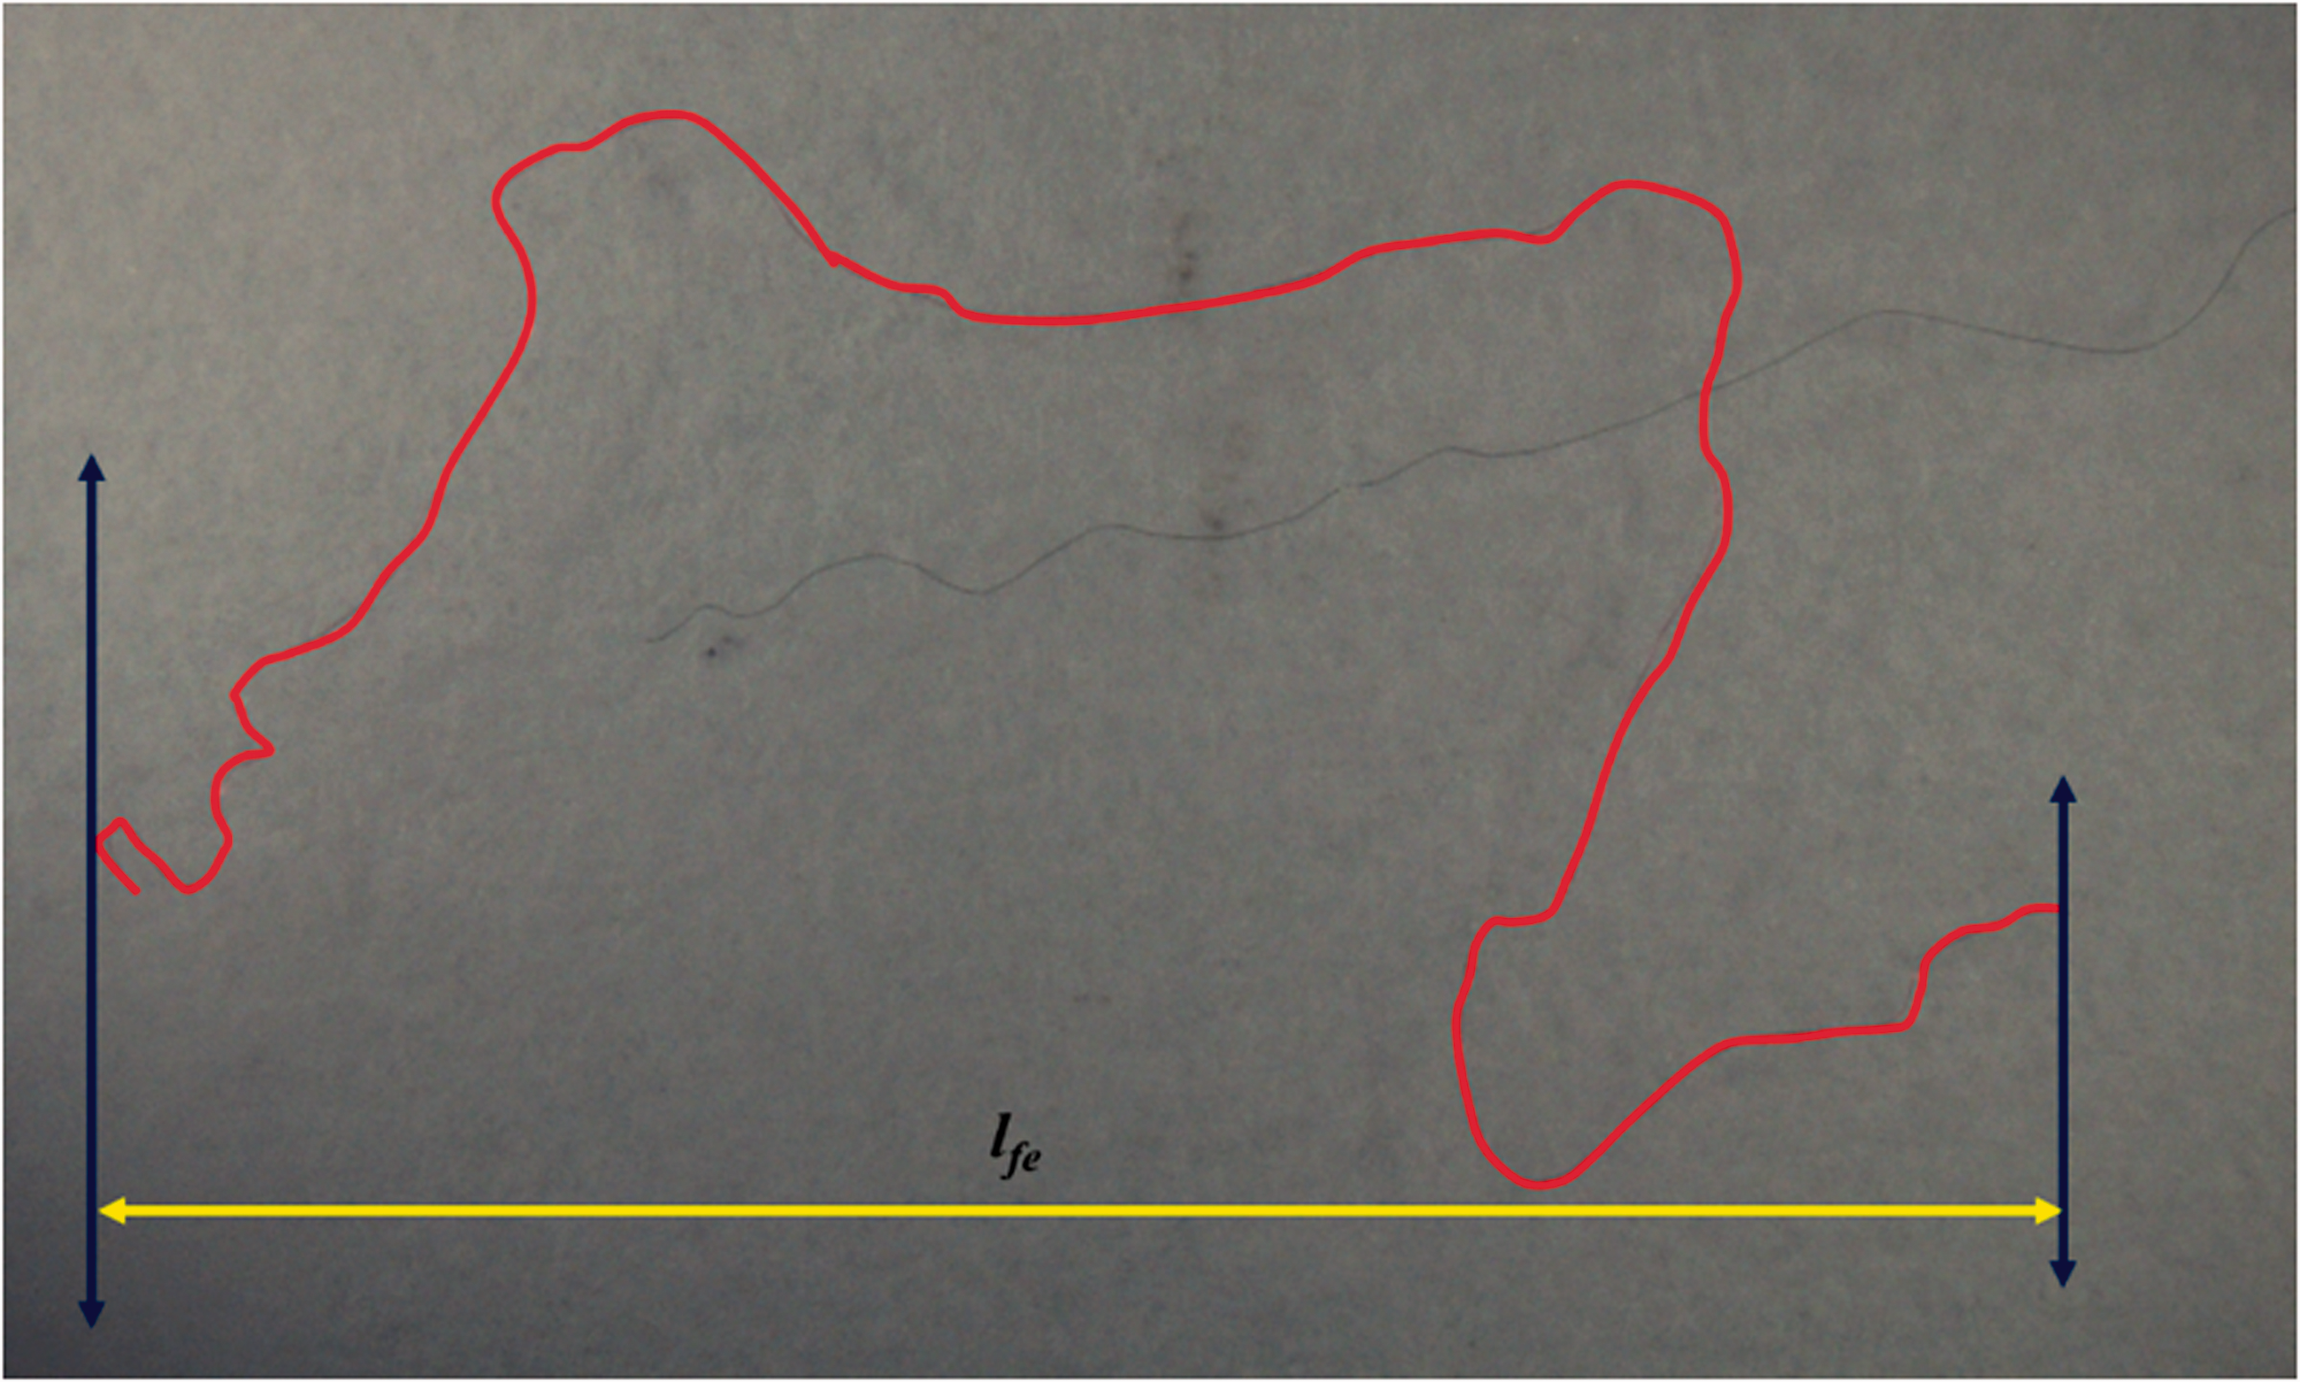
Evaluation of fibre extent and coefficient of fibre curliness.
Fibre coverage area
The area covered by the projected length of fibre in X and Y direction of carded web in the machine direction is defined as fibre coverage area. Higher the value of fibre coverage area, more is the spread of fibre segments in Y direction (cross direction). The NIS Elements software was used to measure fibre coverage area as illustrated in Figure 3. The system measures the area in terms of pixel value.

Evaluation of fibre coverage area.
Fibre inclination angle
Fibre inclination angle is a measure of the angle with the machine direction at an interval of 1 mm segments of any fibre. The mean value of these angles was considered as the fibre inclination angle as shown in Figure 4. Total 300 fibres were taken into consideration for the measurement of fibre inclination angle.

Evaluation of fibre inclination angle.
All readings of fibre inclination angle were grouped into twelve class intervals of equal range i.e., 15 deg (0.26 radian). Accordingly, the frequency distribution of inclination angle of the fibre was obtained. The histogram of fibre inclination angle in the machine direction was obtained using the mathematical model by Neckář et al. [16].
Where p(Ψ) is the probability density function of all inclination angle Ψ, and the measure of anisotropy of inclination angle of fibre of fibre orientation in carded web was denoted by ξ. The value of parameter ξ was calculated for each sample. The value of anisotropy of inclination angle of fibre ξ = p (0) /p (π/2) ≥1, where p (0) represents the maximum probability density of fibre orientation and p (π/2) represents the minimum probability density of fibre orientation. Obviously, ξ = 1 indicates the ideal isotropic orientation but with the increase of ξ, anisotropy of inclination angle of fibre increases.
The details of fibre orientation measurement procedure were elaborated in the earlier work of Roy et al [19]. The mean flow pore size was evaluated by using a porometer and porofil liquid whereas the filtration efficiency and pressure drop were measured by using a purpose built filter rig setup which was equipped with two particle counters, one manometer and one anemometer as discussed by Roy et al. [22]. The results of structural indices and properties of needle punched nonwoven as per experimental plan given in Table 2, are shown in Table 3.
Influence of punching parameters on fibre orientation and properties of needle punched nonwoven.

Results and discussions
Coefficient of fibre curliness
The variance analysis of the coefficient of fibre curliness is shown in Table 4 and the quadratic model was found to be significant. The linear influence of punch density and needle penetration depth were found to be significant as represented by p-values 0.0039 & 0.0002. The square effect of punch density also showed significant effect, with p-value of 0.0248.
Variance analysis of coefficient of fibre curliness.

The response surface equation for coefficient of fibre curliness, in terms of coded factors and significant model terms is represented in equation (2). Very strong correlation was observed between coefficient of fibre curliness and punching parameters with a R2 value 0.997.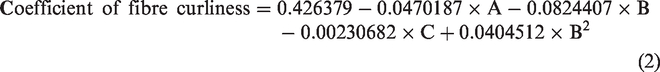
The 3 D surface plot of needle penetration depth vs punch density, at 200/min stroke frequency, is illustrated in Figure 5(a) and also represented by equation (2). The coefficient of fibre curliness observed a decrease with the increased needle penetration and punch density, at respective stroke frequency. The increase in both punch density and needle penetration depth, at different stroke frequencies depicted a significant decrease in coefficient of fibre curliness but a small decrease with the increased stroke frequency. The increase in punch density, needle penetration depth and stroke frequency together depicted a large decrease in the coefficient of fibre curliness.

Influence of punching parameters on coefficient of fibre curliness. (a) Stroke frequency –200. (b) Needle penetration depth –8 mm.(c) Punch density –150/cm2.
The 3 D surface plot of stroke frequency vs punch density, at 8 mm needle penetration depth, is shown in Figure 5(b) and represented by equation (2). The results of the coefficient of fibre curliness noticed a decrease with the increase in stroke frequency, as well as punch density, at respective needle penetration depth. At different needle penetration depths, the increase in both punch density and stroke frequency observed a decrease in the coefficient of fibre curliness, but increased needle penetration depth showed a decrease in the value of the coefficient of fibre curliness. The simultaneous increase of punch density, needle penetration depth and stroke frequency together inferred a decrease in coefficient of fibre curliness.
Figure 5(c) illustrates the 3 D surface plots of stroke frequency vs needle penetration depth, at 150/cm2 punch densities. It was noticed that the coefficient of fibre curliness decreased with increased needle penetration depth but remained moreover the same with the increased stroke frequency, at respective punch density. A continuous decrease in the coefficient of fibre curliness was noticed with the increase in both stroke frequency and needle penetration depth, at respective punch density and it also decreased with increased punch density. Further, the increase in all three considered punching variables observed a reduction in the coefficient of fibre curliness.
The response surface plots 5(a, b and c) and equation (2) reveal the decrease of coefficient of fibre curliness with the increase of punch density, needle penetration depth and stroke frequency. When the needle acted on fibre webs, the barb pushed the fibres downward, i.e., Z direction. The number of fibres carried downward by the barb depends on the size and shape of the barb. During needle punching, once the barb got filled with fibres, it does not carry fibres from subsequent layers any further. Therefore, the prevailing punching action was mainly responsible for the vertical integration of fibres. Due to obvious reasons, the fibres impacted by the barb of the needle got disoriented, in X and Y directions of nonwoven. The impact got further enhanced with the increase in punch density, stroke frequency and needle penetration depth. This, then, lead to disorientation of fibres, which resulted in lesser fibre straightening and parallelization. Hence, it reduced the value of the coefficient of fibre curliness.
The punching parameters were optimised for a maximum value of the coefficient of fibre curliness using equation (2). A maximum of 0.579 coefficient of fibre curliness was achieved, at a combination of 6 mm needle penetration depth, 163.534 stroke/min stroke frequency and 100 punch/cm2 punch density.
Fibre coverage area
The response surface equation for fibre coverage area, in terms of coded factors and significant model terms is represented in equation (3). As shown, very strong correlation was observed between fibre coverage area and punching parameters, with a R2 value 0.9873.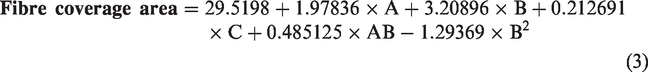
Figure 6(a) provides the 3 D surface plots of needle penetration depth vs punch density, at 200/min stroke frequency, and is represented by response surface equation (3). The fibre coverage area was increased with the increase in needle penetration depth and punch density, at respective stroke frequency. The fibre coverage area inferred an increase with the increase in both punch density, as well as needle penetration depth, at different stroke frequencies. But the increase in stroke frequency initially observed an increase in the fibre coverage area and then, slight decrease towards higher stroke frequency at all combinations of punch density and needle penetration depth was noticed. The fibre coverage area provided an increase with the increase in all three punching variables.

Influence of punching parameters on fibre coverage area. (a) Stroke frequency –200. (b) Needle penetration depth –8 mm. (c) Punch density –150/cm2.
The 3 D surface plot of stroke frequency vs punch density, at 8 mm needle penetration depth is shown in Figure 6(b). It depicted the increasing trend in fibre coverage area that was observed with the increase in punch density, but an initial increase and then slight decrease was noticed with the increase in stroke frequency, at respective needle penetration depth. The increase in both stroke frequency and punch density increased the fibre coverage area, at different needle penetration depths. It was further noticed that the increase in needle penetration depth also increased the fibre coverage area, at a different combination of punch density and stroke frequency. But the increase in punch density, needle penetration depth and stroke frequency, together, enhanced the fibre coverage area.
Figure 6(c) illustrates the 3 D surface plot of stroke frequency vs needle penetration depth, at 150/cm2 punch density. The fibre coverage area depicted an increasing trend with the increase in needle penetration depth, but observed an initial increase and then, slight decrease with the increase in stroke frequency, at respective punch density. The increase in both stroke frequency and needle penetration depth showed a continuous increase in fibre coverage area, at different punch densities. But the fibre coverage area also increased with the increase in punch density. It is interesting to note that the increase in punch density, needle penetration depth and stroke frequency provided an increase in fibre coverage area.
The response surface plots 6 (a, b and c) and equation (3) revealed an increase in fibre coverage area, with the increase of punch density, needle penetration depth and stroke frequency. The fibre coverage area increased with the increase of fibre disorientation, in X and Y direction. Therefore, the factors responsible to decrease the coefficient of fibre curliness increased the fibre coverage area, as discussed earlier, in section ‘Coefficient of fibre curliness’.
Finally, punching parameters were optimised for the minimum value of the fibre coverage area, using equation (3). The combination of 6 mm needle penetration depth, 120.324 stroke/min stroke frequency and 101.243 punch/cm2 punch density provided 23.74 mm2 minimum value of the fibre coverage area.
Anisotropy of inclination angle of fibre
The response surface equation for anisotropy of inclination angle of fibre, in terms of coded factors and significant model terms is represented in equation (4). Very strong correlation was observed between anisotropy of inclination angle of fibre and punching parameters, with a R2 value 0.9975.
The 3 D surface plot of needle penetration depth and punch density of anisotropy of inclination angle of fibre, at 200/min stroke frequency is given in Figure 7(a) and also represented in equation (4). The anisotropy of inclination angle of fibre followed a decreasing trend with increased needle penetration depth and punch density, at the respective stroke frequency. The anisotropy of inclination angle of fibre noticed a reduction with the increase in both punch density and needle penetration depth, at the respective stroke frequency, and it also slightly reduced with the increase in stroke frequency. The anisotropy of inclination angle of fibre provided a decreasing trend with the increase in punch density, needle penetration depth and stroke frequency.
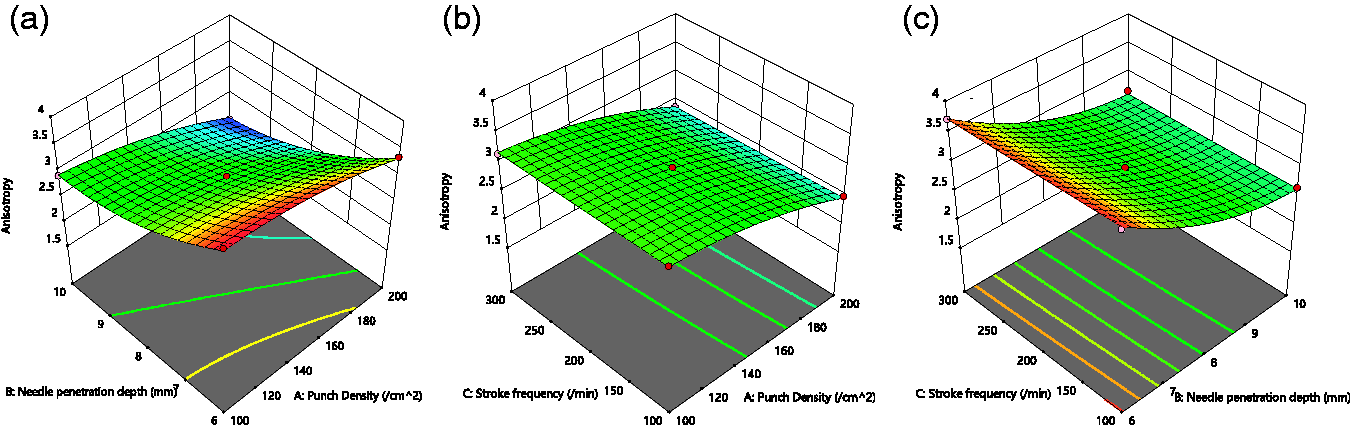
Influence of punching parameters on anisotropy of inclination angle of fibre. (a) Stroke frequency –200. (b) Needle penetration depth –8 mm. (c) Punch density –150/cm2.
Figure 7(b) demonstrates the 3 D surface plots of stroke frequency and punch density, at 8 mm needle penetration depth. The anisotropy of inclination angle of fibre decreased with the increase in punch density but remained moreover the same with the increase in stroke frequency, at the respective needle penetration depth. The increase in both punch density and stroke frequency, at the respective needle penetration depth followed a decreasing trend in the value of anisotropy of inclination angle of fibre and also decreased with the increase in needle penetration depth. The anisotropy of inclination angle of fibre depicted a decrease with the increase in punch density, needle penetration depth and stroke frequency.
The 3 D surface plot of stroke frequency and needle penetration depth, at 150/cm2 punch density of anisotropy of inclination angle of fibre is given in Figure 7(c). The fabric anisotropy of inclination angle of fibre depicted a decrease with the increase in needle penetration depth and a slight decrease with the increase in stroke frequency was noticed, at the respective punch density. The increase in both needle penetration depth and stroke frequency, at the respective punch density, showed a continuous decrease of anisotropy of inclination angle of fibre, but it also provided decrease with the increase in punch density. The anisotropy of inclination angle of fibre noticed a decrease with the increase in punch density, needle penetration depth and stroke frequency.
The values of anisotropy of inclination angle of fibre followed a decreasing trend with increased punch density, needle penetration depth and stroke frequency, as shown in Figure 7(a) to (c) and as noticed from equation (4). The increase in punch density, needle penetration depth and stroke frequency caused deterioration in the fibre orientation, in X and Y direction, and, hence, reduced the value of anisotropy of inclination angle of fibre.
Punching parameters were optimised for the maximum value of the anisotropy of inclination angle of fibre, using equation (4). The combination of 6 mm needle penetration depth, 100 stroke/min stroke frequency and 100 punch/cm2 punch density provided 3.954 value of the anisotropy of inclination angle of fibre.
Mean flow pore size
The response surface equation for mean flow pore size, in terms of coded factors and significant model terms is represented in equation (5). Very strong correlation was observed between mean flow pore size and punching parameters with a R2 value 0.9326.
Figure 8(a) and equation (5) illustrate the 3 D surface plot of needle penetration depth and punch density, at 200/min stroke frequency of mean flow pore size. The mean flow pore size noticed an initial decrease and then, increased with the increase in needle penetration depth and punch density, at the respective stroke frequency. The mean flow pore size followed a decrease and then, increase, as both punch density and needle penetration depth increased. The obtained pattern is applicable for all stroke frequencies. The initial decrease and then increase in mean flow pore size was noticed with the increase in stroke frequency, as both punch density and needle penetration depth increased. Further, an initial decrease and then increase in mean flow pore size was observed with the increase in punch density, needle penetration depth and stroke frequency.

Influence of punching parameters on mean flow pore size. (a) Stroke frequency –200.(b) Needle penetration depth –8 mm. (c) Punch density –150/cm2.
The results of Figure 8(b) and equation (5) show an initial decrease and then, an increased mean flow pore size with the increase in stroke frequency, as well as punch density, at the respective needle penetration depth. The increase of needle penetration depth noticed an initial decrease and then, increase in the mean flow pore with the increase in both stroke frequency and punch density. But mean flow pore size also observed an initial decrease and then, increase with the increased needle penetration depth. A reduction in mean flow pore size was observed with the increase in punch density, stroke frequency and needle penetration depth, upto a certain limit, after which mean flow pore size noticed an increase with the increase in three punching variables.
Figure 8(c) and equation (5) illustrate a decreasing and increasing trend with the increase in needle penetration depth and stroke frequency, at the respective punch density. An initial reduction in mean flow pore size was noticed with the increase in both needle penetration depth and stroke frequency but further enhancement of the two parameters increased the mean flow pore size. Increased punch density followed a decrease and then increase in mean flow pore size, with the increase in both needle penetration depth and stroke frequency. The increased punch density, needle penetration depth and stroke frequency followed an initial decrease and then, increase in mean flow pore size.
The results of mean flow pore size, as discussed above, depicted that the mean flow pore size reported an initial decrease and then, increased with the increase of punch density, needle penetration depth and stroke frequency. As established above, punching actions disturbed the fibre orientation in X and Y direction of the fabric, as compared to the fibre orientation in carded web achieved before punching. The expected changes in fibre orientation in Z direction due to punching actions were likely to influence the mean flow pore size in the fabric. As already discussed, initial increase in punch density, stroke frequency and needle penetration depth parameters made the structure more compact upto a certain limit, which can be supported from the results of fabric thickness. Thereafter, the increased values of punching parameters created through pores, to a large extent also broke the fibres and as a result, increased the mean flow pore size.
Punching parameters were optimised for the minimum value of the mean flow pore size, using equation (5). The combination of 8.23 mm needle penetration depth, 202.211 strokes/min (frequency) and 156.903 punch/cm2 (punch density) provided 16.048 µm, minimum value of the mean flow pore size.
Relationship between mean flow pore size and measured structural indices
A regression model of nonlinear process was established between the mean flow pore size and the measured structural indices, as shown in equation (6). A good correlation was observed between structural indices and mean flow pore size, with a R2 value 0.739.
Where,
X1 = proportion of curved fibre ends, X2 = coefficient of relative fibre parallelization, X3 = coefficient of fibre curliness, X4 = fibre coverage area, and X5 = anisotropy of inclination angle of fibre.
The nonwoven cards in general randomizes the fibre orientation in carded web to balance the fabric properties in machine direction and cross direction. However, in most of the cards, fibres are still oriented in machine direction with each fibre independently parallel to the others as observed above. Cross lapper folds carded web into zigzag patterns to achieve required fabric weight and thickness. However, the fibres are slightly cross direction oriented and orientation of fibres depends upon the angles and delivery speed while folding the webs. Needle punch process re-organizes the fibre orientation distribution by fibre transfer. Therefore, fibre reorientation and entanglement in web thickness direction are of extreme importance to decide the pore size. It is observed that with the increase in either punch density or needle penetration depth, increase in the size of the peg holes. The pore structure can be controlled by the design parameters, which are fibre diameter, porosity, and basis weight. As discussed above, the fabric possesses of minimum two different regions. The first region lies in between the portions associated with the needle marks but largely retains the original structure of carded webs. However, the second region having needle marked portions, consist of fibre segments that are oriented in Z direction of the fabric [21]. Accordingly, the patterns of pore size and pore distribution in both of the regions are likely to be different. Therefore, first region is largely influenced by the measured structural indices.
Filtration efficiency of 10 μm particles
The response surface equation for filtration efficiency of 10 µm particles, in terms of coded factors and significant model terms, is represented in equation (7). Very strong correlation is observed between filtration efficiency of 10 µm particles and punching parameters, with a R2 value 0.9771.
The 3 D surface plot of needle penetration depth and punch density of filter efficiency 200/min stroke frequency is given in Figure 9(a) and also represented by equation (7). The filtration efficiency for 10 µm particles followed an increase and then slight decrease with the increase in punch density. The filtration efficiency increased with the increase in both punch density and needle penetration depth initially thereafter reduction was noticed at respective stroke frequency. The filtration efficiency initially observed an increase, and then decrease with the increase in stroke frequency. But the filter efficiency for 10 µm particles shows an increasing trend with the increase in punch density, needle penetration depth and stroke frequency up to a limit but at very higher punching combination a reverse was noticed.
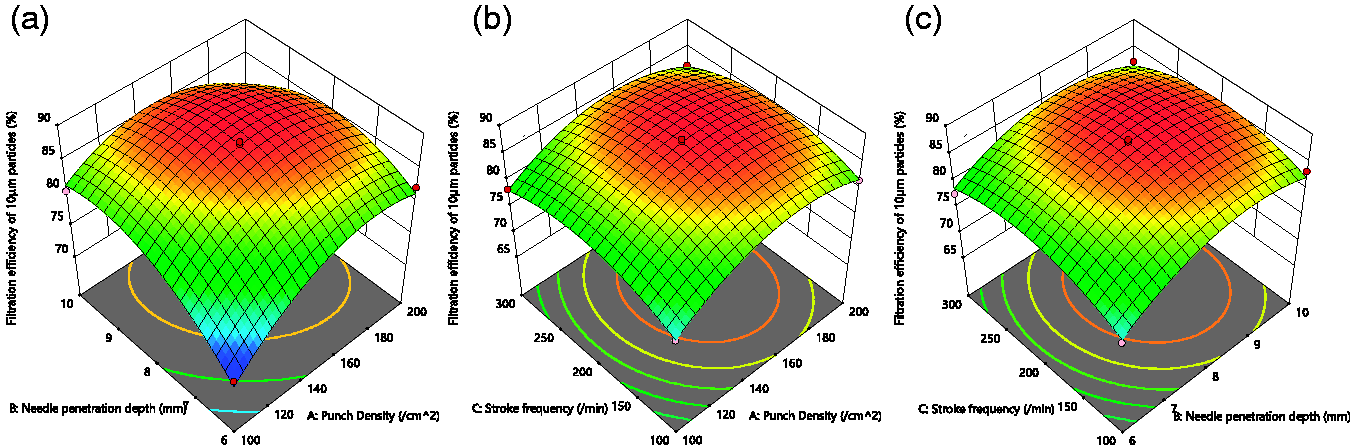
Filtration efficiency of 10 µm particles – Influence of punching parameters. (a) Stroke frequency –200. (b) Needle penetration depth –8 mm. (c) Punch density –150/cm2.
Figure 9(b) shows the 3 D surface plots of stroke frequency and punch density at 8 mm needle penetration depth. The filtration efficiency of 10 µm particles initially noticed an increase, and then decrease with the increase of stroke frequency and punch density at respective needle penetration depth. The increase of both punch density and stroke frequency at respective needle penetration depth followed an initial increase, and then decrease in the filtration efficiency. But increase in needle penetration depth followed an increase, and then decrease in the filtration efficiency. The filtration efficiency of 10 µm particles noticed an increase, and then decrease with the increase in punch density, needle penetration depth and stroke frequency.
The 3 D surface plot of stroke frequency and needle penetration depth at 150/cm2 punch density of filtration speed of 10 µm particles is given in Figure 9(c) and also represented by equation (7). The filtration efficiency depicted an increase, and then decrease with the increase of stroke frequency and needle penetration depth at respective punch density. But towards lowest value of punch density, it continuously increased with the increase of needle penetration depth. The increase of both needle penetration depth and stroke frequency at respective punch density followed an increase of filtration efficiency but it noticed a reduction with the increase of punch density.
Filtration efficiency is a dependent variable of mean flow pore size, air permeability, fabric thickness, and pressure drop of nonwoven fabrics. As discussed above, filtration efficiency noticed an increasing and decreasing trend, with the increased needle penetration depth, stroke frequency and punch density. The observed trends stood valid for all different sizes of particles. It was further noticed that filter efficiency increased as the size of the particles also increased. Hence, smaller the pore size, higher was the filtration efficiency. The results discussed above showed that the obtained trends of mean flow pore size followed an initial decrease and then, increased with the increase in punch density, needle penetration depth and stroke frequency. Therefore, the filtration efficiency of nonwoven highly depended on mean flow pore size.
A combination of 8.39 mm needle penetration depth, 202.814 stroke/min (frequency) and 158.708 punch/cm2 (punch density) provided with 88.150%, maximum value of the filtration efficiency, for 10 µm particles.
Relationship between filtration efficiency of 10 µm particles and measured structural indices
A regression model of nonlinear process was established between the filtration efficiency of 10 µm particles and the measured structural indices, as shown in equation (8). A good correlation was observed between structural indices and filtration efficiency, with a R2 value 0.723.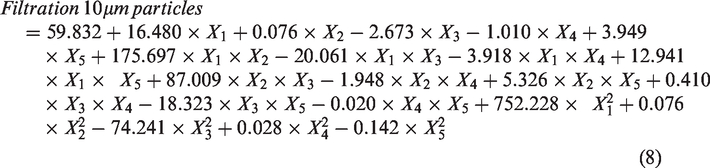
An ideal filter media provides high particles holding capacity and low pressure drop. Therefore, an optimization or balance is required between these two attributes. However, nonwoven media consists of random distribution of pores of varying size and shape. Each different pore size refers to a specific value of pressure drop. But for all practical purposes, a balanced pore structure is required to trap a specific range of particles by nonwoven media. Therefore, it can be concluded that a sufficient amount of variation in air resistance is required to be achieved by increasing the total exposed surface area of the fibres within the fabric. This will result in decreasing the size of the air channels within the fabric through which air flows. While obtaining the air flow through porous fibrous materials, the shape, arrangement, and size distribution of pores through which flow occur play an extremely important role.
Pressure drop
The response surface equation for pressure drop, in terms of coded factors and significant model terms, is represented in equation (9). Very strong correlation was observed between pressure drop and punching parameters, with a R2 value 0.9068.
The results given in Figure 10(a) and equation (9) followed an initial increase and then, decrease with the increase in needle penetration depth and punch density, at the respective stroke frequency. The pressure drop depicted an initial increase and then, decrease with the increased punch density and needle penetration depth, at respective stroke frequencies, though it followed an increasing and decreasing trend with the increase in stroke frequency. Pressure drop observed an initial increase and then, decrease with the increase in all punching parameters.

Influence of punching parameters on pressure drop. (a) Stroke frequency –200. (b) Needle penetration depth –8 mm.(c) Punch density – 150/cm2.
The results of Figure 10(b) and equation (9) illustrate an increasing and decreasing trend in pressure drop, with the increase in stroke frequency and punch density, at the respective needle penetration depth. The pressure drop noticed an increase and then, decrease with the increased punch density and stroke frequency, at the respective needle penetration depth. Though, the increase of needle pentration depth also followed a similar trend. The pressure drop observed an initial increase and then decrease with the increase in punch density, needle penetration depth and stroke frequency.
The results of pressure drop given in Figure 10(c) and equation (9) indicated an initial increase and then decrease with the increased needle penetration depth and stroke frequency, at the respective punch density. The pressure drop initially inferred an increase and then, decrease with the increased needle penetration depth and stroke frequency, at the respective punch density. But the increased punch density followed a similar trend of pressure drop. The pressure drop showed an increasing and decreasing trend with the increased punch density, needle penetration depth and stroke frequency.
It was observed in the above analysis that the pressure drop depicted an initial increase with the increase of needle penetration depth, stroke frequency and punch density but, thereafter, the pressure drop decrease. However, pressure drop is rather dependent on mean flow pore size. Additionally, pressure drop has an inverse relation with mean flow pore size. The explanations given above for fabric mean flow pore size support the trend of pressure drop, with the increased needle penetration depth punch density, and stroke frequency.
Punching parameters were optimised for the minimum value of the pressure drop, using equation (9). The combination of 6.098 mm needle penetration depth, 298.077 stroke/min (frequency) and 100.989 punch/cm2 punch density provided 58.778 Pa; value of the pressure drop.
Relationship between pressure drop and measured structural indices
A regression model of nonlinear process was established between the pressure drop and the measured structural indices, as shown in equation (10). A correlation with a R2 value of 0.654 was observed between structural indices and fabric pressure drop.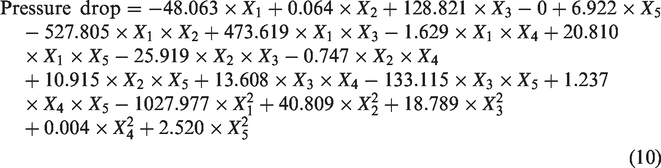
The filtration performance of the filter media is derived by initial pressure drop, dust loading characteristics and particle collection efficiency. Therefore, the filter medium is required to have a bulky structure with high porosity, hence the filter medium should have an open structure with high particle penetration rate. The pressure drop varies with fabric thickness because of the available surface area and layered web structure. The basic objective of filter media is to restrict the particles of different sizes at their respective trap points which is dependent on pore size. Since multiple layers of carded webs are punched together in needle punched nonwoven fabrics, then the orientation of fibres in carded web will play a decisive role on pressure drop and filtration efficiency. It has already been established above that orientation of fibres plays a major role to control the pore size which is the most dominant factor in filtration. Therefore, it can be concluded that the directional arrangement of fibres influenced by carding parameters determines the pore size and pore size distribution and these factors play a crucial role to control pressure drop and filtration effectively. Accordingly, anisotropy of inclination angle of fibre, fibre coverage area and coefficient of fibre curliness have noticed as significant influence on pressure drop.
From the above discussion it can be summarised that the increase all punching parameters deteriorated the fibre orientation in final nonwoven fabrics. The mean flow pore size initially decreases with the decrease of in-plane fibre orientation, but at higher level of fibre disorientation mean flow pore sizes drastically increases due to the presence of through pores. The filtration efficiency and pressure drop follows completely opposite trend to the mean flow pore size, therefore at lower level of fibre disorientation filtration efficiency and pressure drop followed an increasing trend whereas at higher level of in-plane fibre disorientation depicted a decreasing trend of both properties.
Process parameters optimization for filter media
The process parameters were optimized for achieving the highest filtration efficiency at the lowest pressure drop. Filtration efficiency was given maximum emphasis. The optimized process parameters and obtained values of fibre orientation and other properties are given in Table 5. The optimization process was carried out by using response surface methodology in Design-Expert® Version 11 software.
Optimized process parameters and the values of properties.

Conclusions
The above discussion lead to the conclusion that improved carded web characteristics influenced by carding parameters significantly helped to minimise the structural changes, in nonwoven, after punching. Hence, it further strengthened the importance of fibre orientation in carded web, influenced by carding parameters in which cylinder speed showed maximum impact followed by doffer and feeder speeds. The retained fibre orientation, after punching, contributed towards reduced mean flow pore size of nonwoven. Evidently, the filtration efficiency depicted an increase for all particle sizes, but with higher value of pressure drop. The inherent characteristic needling action deteriorated fibre orientation in X and Y directions of nonwoven, and accordingly, fibre coverage area inferred an increase but coefficient of fibre curliness and anisotropy of inclination angle of fibre observed a decrease, with the increase of punch density, needle penetration depth and stroke frequency. Mean flow pore size followed an initial decrease and then, increase, but filtration efficiency and pressure drop followed an initial increase and then, decrease with the increase of punch density, needle penetration depth and stroke frequency. According to the overall optimization, a combination of 175.530 punches/cm2 punch density, 7.150 mm needle penetration depth and 168.220 strokes/min stroke frequency provided required fabric characteristics as per pre-defined goals.
Footnotes
Declaration of conflicting interests
The author(s) declared no potential conflicts of interest with respect to the research, authorship, and/or publication of this article.
Funding
The author(s) received no financial support for the research, authorship, and/or publication of this article.