
Abstract
Randomly distributed fiber-reinforced soils have recently attracted increasing attention in geotechnical engineering for the second time. On the basis of predictive models that have been presented till now, shear strength of fiber-reinforced soil increases with increase in fiber aspect ratio, fiber content, fiber modulus, and soil fiber surface friction. The main aim of this paper is therefore shear modeling of polypropylene-fiber-reinforced soil composite by considering the fiber orientation parameter. Force equilibrium method proposed by Waldron was extended to predict shear behavior of randomly distributed fiber–soil composite. The fiber orientation factor was derived by using electrical conductivity contours as a novel technique. In electrical conductivity contour method, electrical conductivity is measured between different points through the soil composite. After that a visual matrix is drawn that shows the uniformity of fiber distribution within the soil matrix. The experimental shear tests revealed that the shear strength of 19-mm polypropylene-reinforced soil composite is less than that of 6 - and 12-mm reinforced samples. On the other hand, electrical conductivity contour method showed that polypropylene fibers of 19-mm length present the worst fiber distribution compared to 6-mm and 12-mm fibers. Therefore, the theoretical model was modified with an orientation factor.
Introduction
Randomly distributed fiber-reinforced soils have recently attracted increasing attention in geotechnical engineering for the second time [1,2]. Therefore, it is emphasized that short fiber composite soil is still a relatively new technique in geotechnical projects as a mimics of the past [3]. As well, a comprehensive literature review shows that using natural and/or synthetic fibers in geotechnical engineering is feasible in six fields including pavement layers (road construction), retaining walls, earthquake engineering, railway embankments, protection of slopes, and soil foundation engineering [4,5].
Some researchers have reported that the increase in strength and stiffness of fiber–soil composite may be a function of fiber characteristics (e.g. aspect ratio, skin friction, weight fraction, and modulus of elasticity), soil characteristics (e.g. shape, particle size, and gradation), and test condition (e.g. confining stress) [5]. On the whole, direct shear tests, unconfined compression tests, and conventional triaxial compression tests have demonstrated that shear strength of soil composite is increased and postpeak strength loss is reduced when short staple fibers are randomly mixed with the soil [5,6]. In this way, polypropylene (PP) fiber is the most widely used inclusion in the laboratory testing of soil reinforcement [7–9]. Currently, PP fibers are used to enhance the soil strength properties, to reduce the shrinkage properties, and to overcome chemical and biological degradation [10–12].
Puppala and Musenda indicated that PP fiber reinforcement enhanced the unconfined compressive strength (UCS) of the soil and reduced both volumetric shrinkage strains and swell pressures of the expansive clays [12].
From the experiments on field test sections in which a sandy soil was stabilized with PP fibers, Santoni and Webster concluded that the technique showed great potential for military airfield and road applications and that a 203-mm-thick sand fiber layer was sufficient to support substantial amounts of military truck traffic. Field experiments also indicated that it was necessary to fix the surface using emulsion binder to prevent fiber pullout under traffic [13].
Consoli et al. investigated the load–settlement response carried out on a thick homogeneous stratum of compacted sandy soil reinforced with PP fibers. The PP-reinforced specimens showed a considerable hardening behavior up to the end of the tests, at axial strains larger than 20%, whereas the nonreinforced specimens demonstrated perfectly plastic behavior at large strains. This improvement suggests the potential application of fiber reinforcement in shallow foundations, embankments over soft soils, and other earthworks that may suffer excessive deformation [14].
In an extensive study, Yetimoglu et al. conducted a set of California bearing ratio (CBR) tests on geotextile-reinforced sand specimens overlying soft clay under PP-reinforced soil. They concluded that the penetration value tended to increase with increasing fiber reinforcement content. In addition, the test results showed that increasing fiber reinforcement content could increase brittleness of fiber-reinforced sand fill–soft clay system providing higher loss of postpeak strength [15].
Tang et al. reinforced kaolinite soil with PP fibers and observed an increase in the UCS [16]. Consoli et al. conducted a set of drained standard triaxial tests on artificially cemented sand specimens reinforced with randomly oriented PP fibers. The fiber reinforcement increased peak strength just up to a certain cement content (up to about 5%), increased ultimate strength, decreased stiffness, and changed the cemented sand brittle behavior to a more ductile one. The triaxial peak strength increase due to fiber inclusion is more effective for smaller amounts of cement, while the increase in ultimate strength is more efficacious when fiber is added to sand improved with higher cement contents [17].
Zaimoglu found that the mass loss in PP-reinforced soils (12 mm, 0.75% of total dry soil) was almost 50% lower than that in the unreinforced soil. It was also illustrated that the UCS of specimens subjected to freezing–thawing cycles generally increased with the increasing fiber content [18].
Ghazavi and Roustaie showed that the addition of 3% PP fibers (12 mm) results in the increase of UCS of soil before and after applying freeze–thaw cycles by 60–160% and decrease of frost heave by 70% [19].
Therefore, this paper firstly compares the effect of PP fiber length on shear strength of soil composite. Afterward, a theoretical model based on force equilibrium method is developed by consideration of an orientation factor. The fiber orientation factor would be derived by using electrical conductivity contours (ECCs) as a novel technique. In other words, this paper is going to investigate the fiber parameters that influence the uniformity of fiber distribution within a soil matrix.
Shear modeling of randomly distributed fiber-reinforced soil composite
Soil samples reinforced with short fibers may be analyzed as if it were a composite material in which fibers of relatively high tensile strength are embedded in a matrix of lower tensile strength. This can be the basis of the engineering technique of fiber-reinforced soil in which true cohesion is imparted to soil [20,21]. Force is carried from point to point within the matrix by forces tangential to the fibers producing differing tensions along their length. These tangential forces may be carried by friction and/or by bonding between fibers and surrounding matrix. The Waldron’s method [21] is extended to model the role of fibers in shear improvement of soil composite. It is assumed that reinforcing fibers have a random orientation within the shearing surface of the soil matrix. Figure 1 shows the schematic of the proposed model. The following assumptions should be made in the model: (1) shearing occurs in a horizontal zone of thickness D which is penetrated by vertical fibers; (2) D does not change during shear; (3) fibers are flexible with circular cross-section of uniform diameter df and are linearly elastic with the modulus of Ef having an initial inclination angle γ into the shear surface.
The schematic of a fiber within a soil composite with an initial inclination angle γ into the shear surface before and after shear loading.
According to the short fiber composite theory [22,23], the soft matrix inserts tension on the fibers through tangential stresses τ. When the upper mass of soil matrix in Figure 1 has been displaced a distance Δx, the fiber segment The geometrical relation between initial inclination angle γ and deformation angle β.


According to Figure 2, it is clear that for π/2 < γi < π, the fiber element does not play any resistant role against the shear loading of the soil composite. Furthermore, assuming symmetric fiber distribution within the soil matrix, the total tangential force of Nf fibers resisting against shear loading (Ft) can be calculated

Therefore, the total shear strength improvement of fiber-reinforced soil composite ΔS can be obtained


Materials and methods
PP fibers
Some properties of PP fibers used in this study.

Soil
The soil used in the reinforcement tests was silty sand prepared from Segzi Desert, Isfahan, Iran. Table 2 presents some physical properties of the soil. As it can be seen, the soil is not a chemically problematic soil. Since, the compressive strength of the soil is low (CBR (%) = 1.62), therefore, it is logical to use mechanical methods, i.e. using PP fibers to reinforce soil. The sieve size distribution of the soil particles is shown in Figure 3.
The sieve size distribution of the soil particles: particle size mm (x) versus percentage of passing (y). Some physical properties of soil used in this study.

Direct shear test
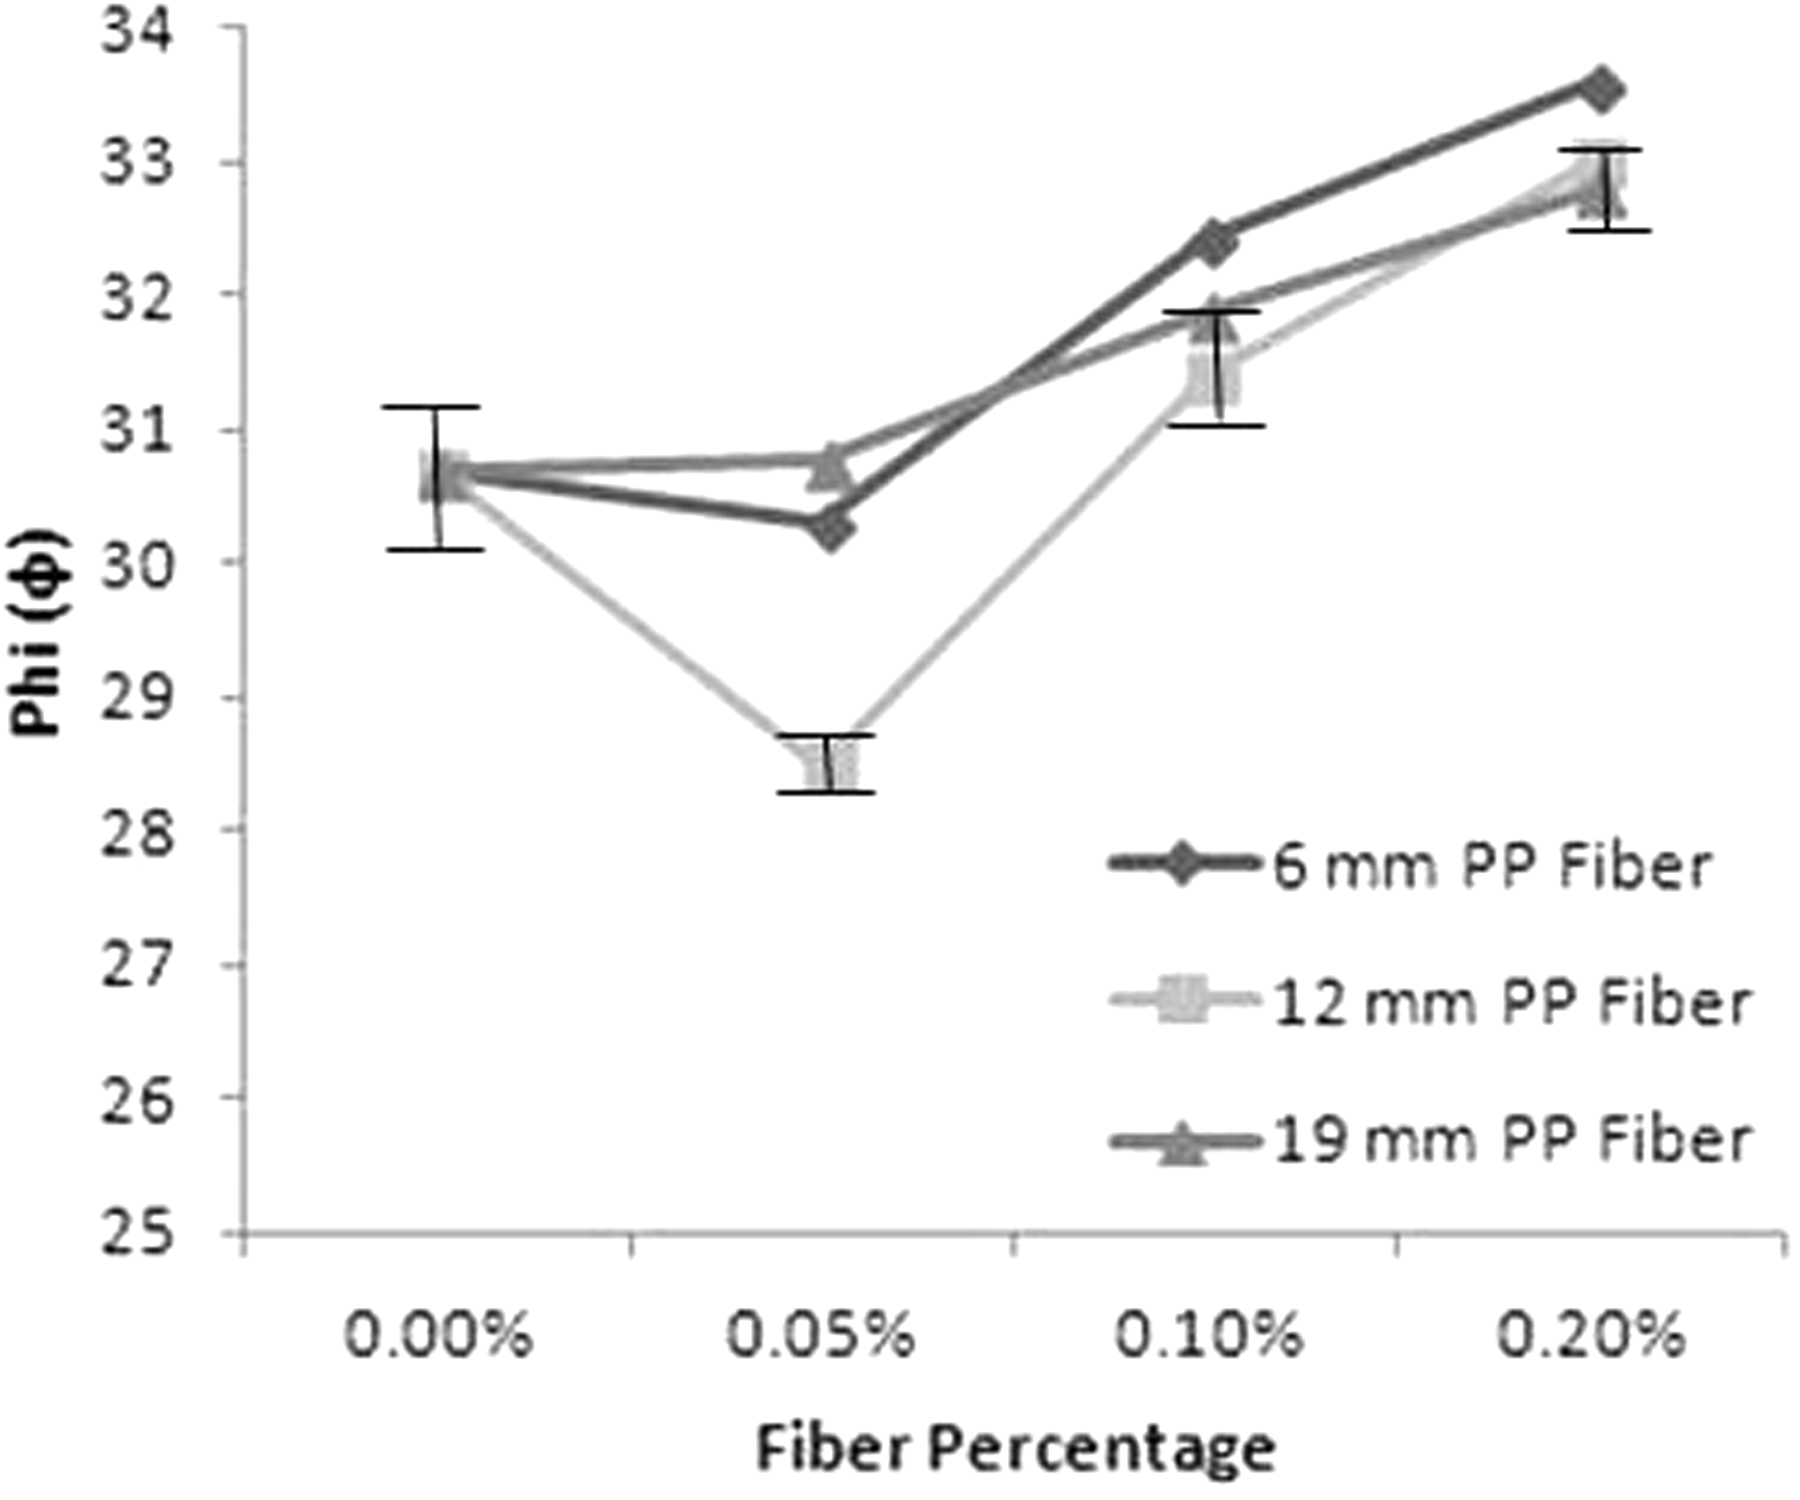
The shear tests were conducted using a standard laboratory direct shear apparatus in accordance with ASTM D 3080. The specimens for shear tests were shaped in a cylindrical mold (20-mm height and 63-mm inner diameter) by static compaction at the optimum moisture content (OMC) state of the soil. The OMC value was 13.82% determined through the standard Proctor compaction test designated by ASTM D 698. The shear tests were strain controlled with the rate of 1 mm/min. The tests were also performed at three vertical normal stresses (σv) of 49, 98, and 196 kPa in order to determine shear behavior of the soft-matrix composite at different compressive loads. Based on the experimental design, three shear tests should be repeated for each treatment to achieve reliable results. The results of the three different tests for the neat soil were presented in a chart with maximum measured shear stress τ on vertical axis and vertical normal stresses σv on the horizontal axis. A linear curve was fitted to the test result points. The intercept of this line with the vertical axis gives the cohesion c and its slope gives the peak friction angle ϕ. Figure 4 shows the plots of τ versus σv for neat soil and soil reinforced with PP fibers of 12 mm and 0.1%. Figures 5 and 6 compare different values of c and ϕ between neat and reinforced treatments, respectively.
The plots of vertical stress σv versus shear stress τ for neat soil and soil reinforced with PP fibers of 12 mm and 0.1%. The cohesion c for neat and modified soil samples derived from direct shear test. The friction angle ϕ for neat and modified soil samples derived from direct shear test.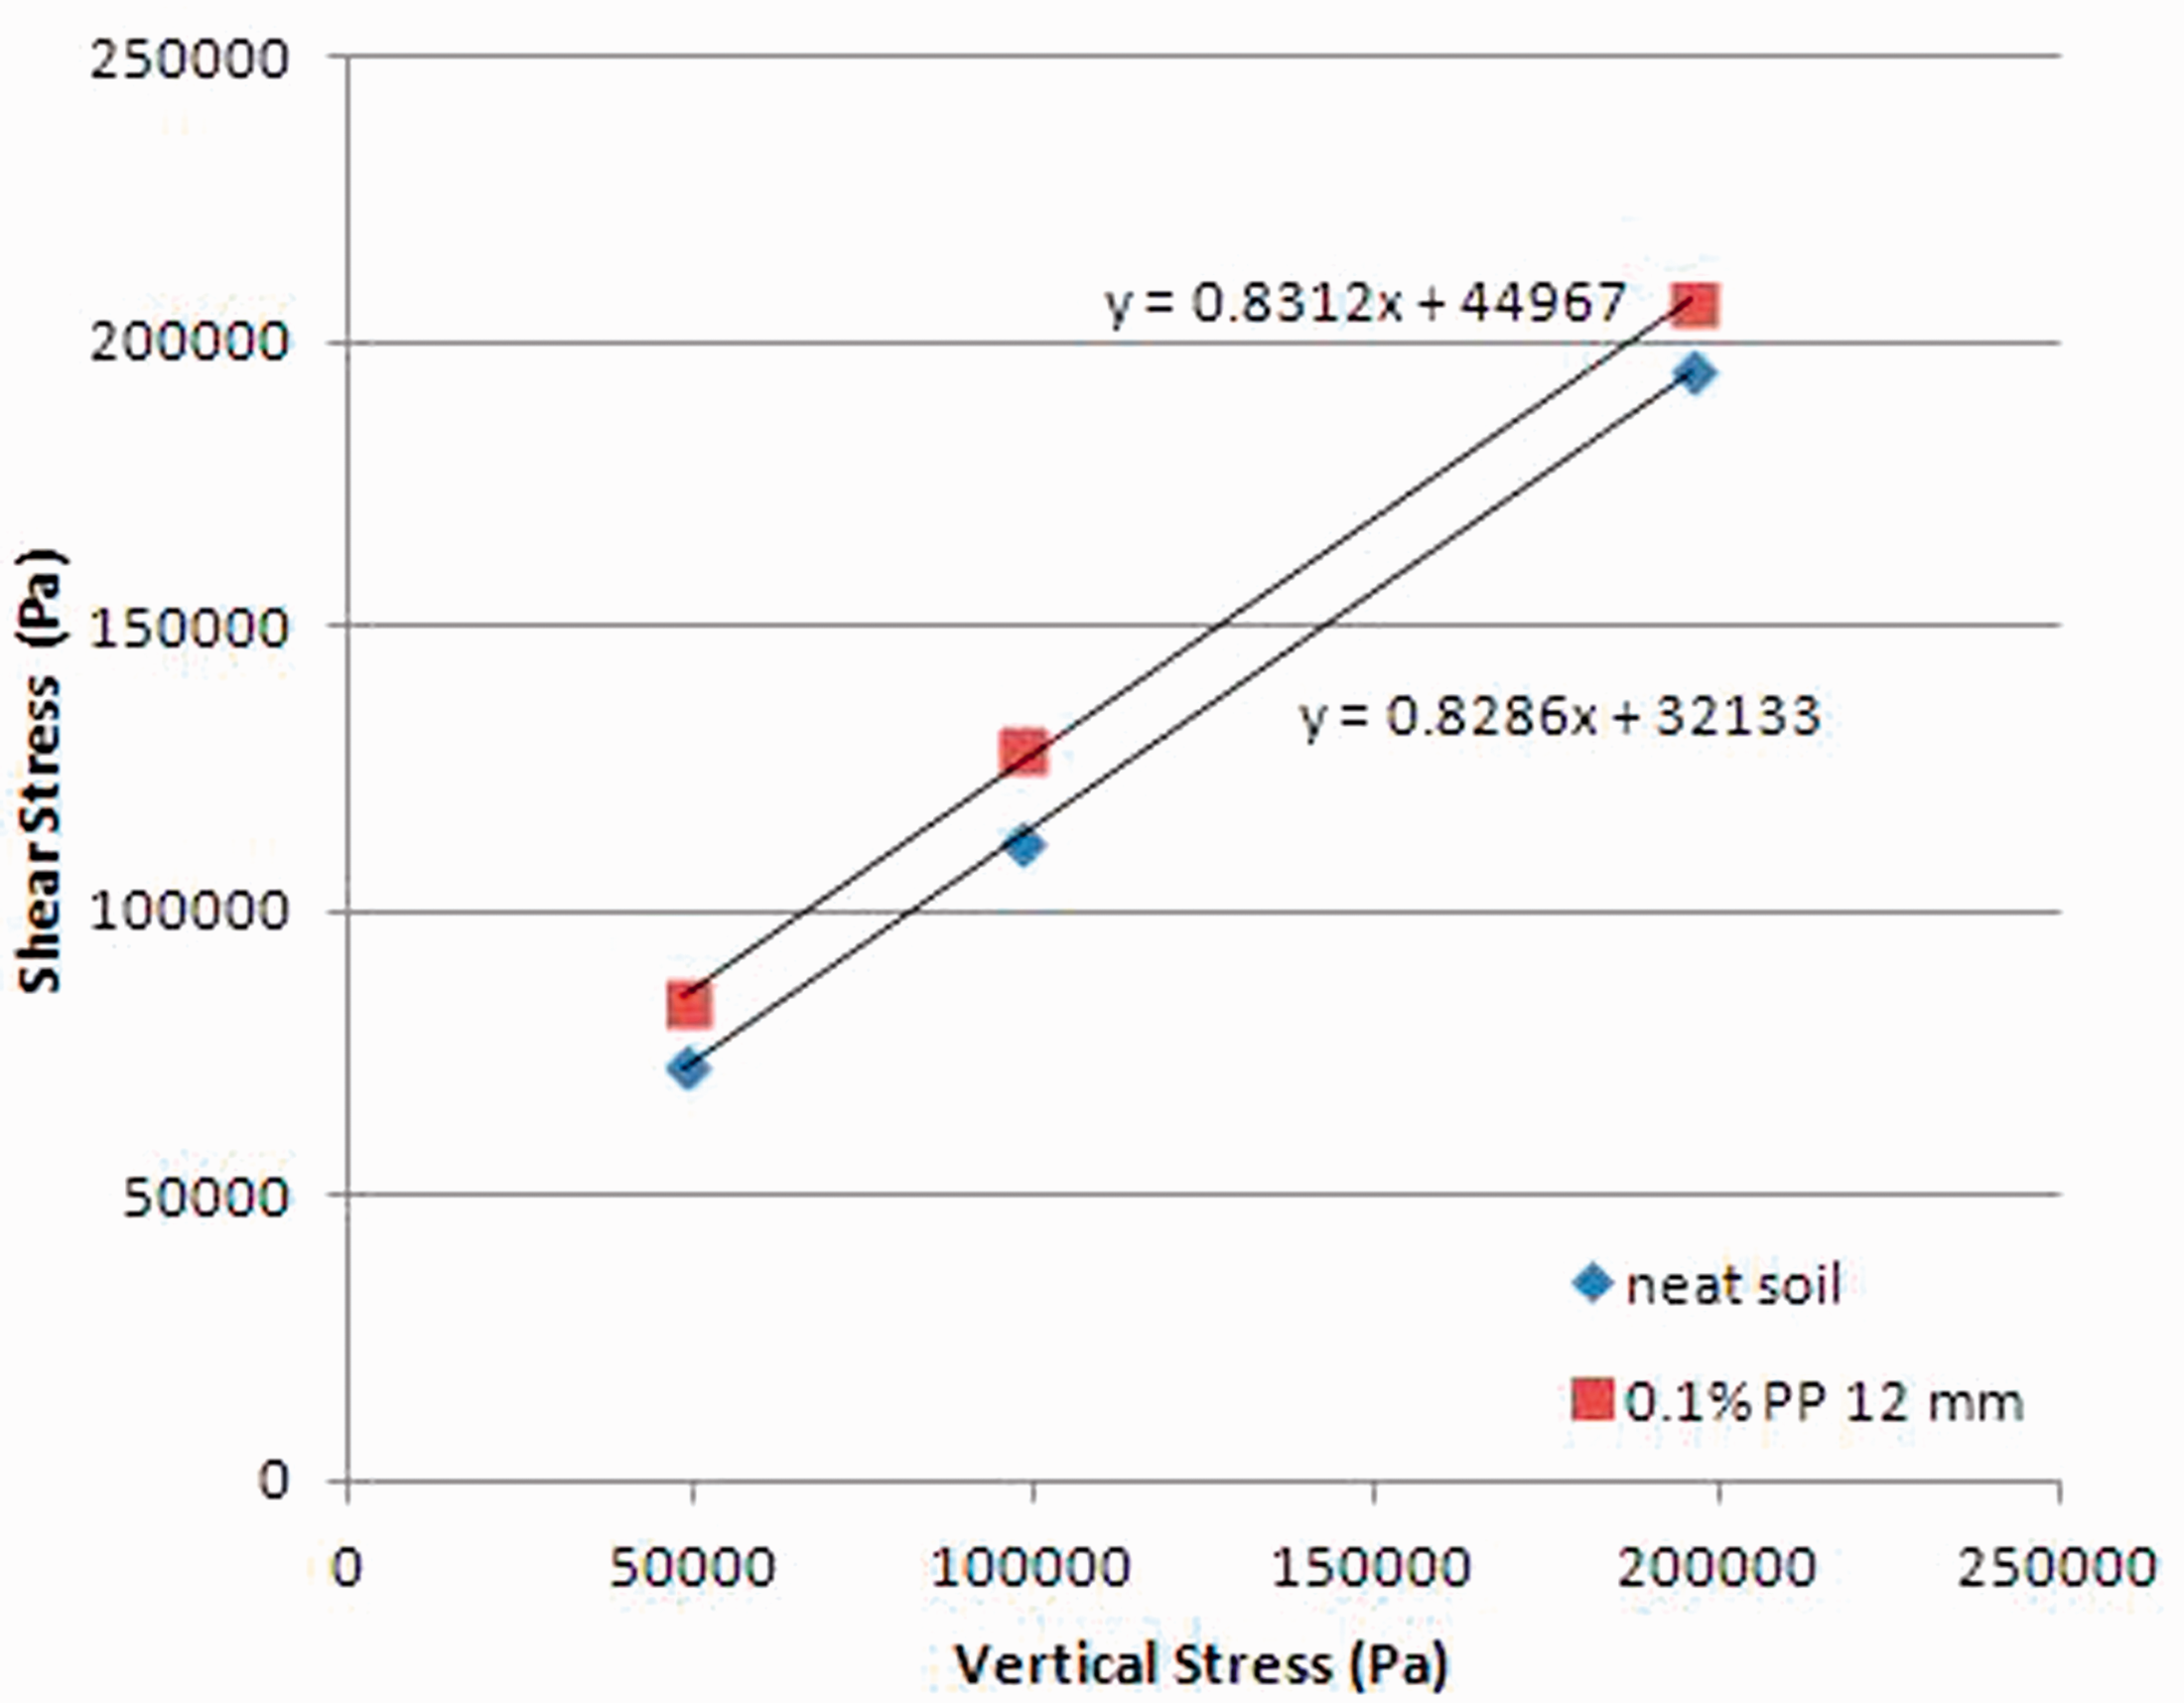

Electrical conductivity test
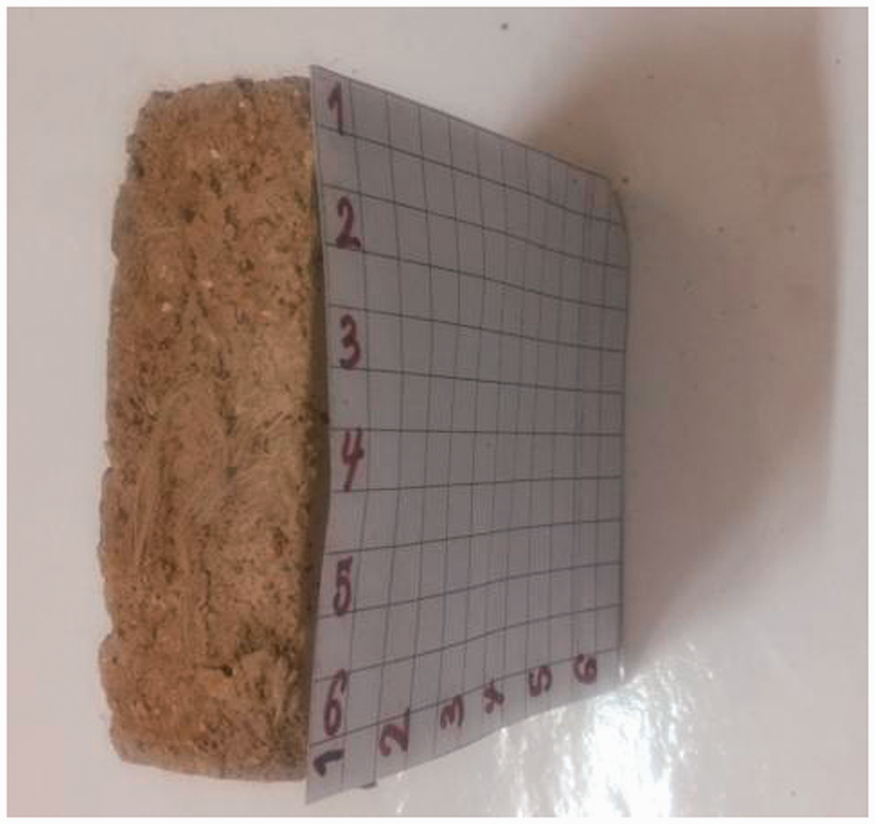
The electrical conductivity test was done to evaluate the uniformity of PP fiber distribution within the soil matrix based on the fiber length and fiber content. Clumping and balling are the two main problems involved with short fiber composites that decrease the reinforcement efficiency of staple fibers within the matrix. Therefore, a reduction factor should be considered for any model adapted to predict mechanical properties of short fiber composites. That is why electrical conductivity test was done in this study. The electrical conductivity method has been widely used to determine the void content of cement composites, e.g. [24]. It is clear that by increasing the void content, the electrical conductivity of the composite will be decreased. In this study, PP fibers were immersed in Fe2O3 powder. Accordingly, fibers were randomly distributed within the soil matrix. The size of the soil and/or reinforced soil samples was 6 cm × 6 cm × 2 cm in accordance with the size of soil sample in direct shear test. Consequently, a graph including 24 nodes was considered for each soil composite and/or neat sample. The electrical conductivity was accurately measured between each two nodes that were included 72 routs. Figure 7 shows the experimental specimen prepared for electrical conductivity test. Afterward, the measured conductivities were schematically drawn for each sample as a colored contour. Figures 8 to 11 show the contours of 6, 12, and 19 mm PP-reinforced soil samples at 0.2% fiber content and the neat soil sample, respectively.
The contour for the neat soil sample. The experimental specimen prepared for electrical conductivity test. The contour of 6-mm PP-reinforced soil sample at 0.2% fiber content.

Results and discussions
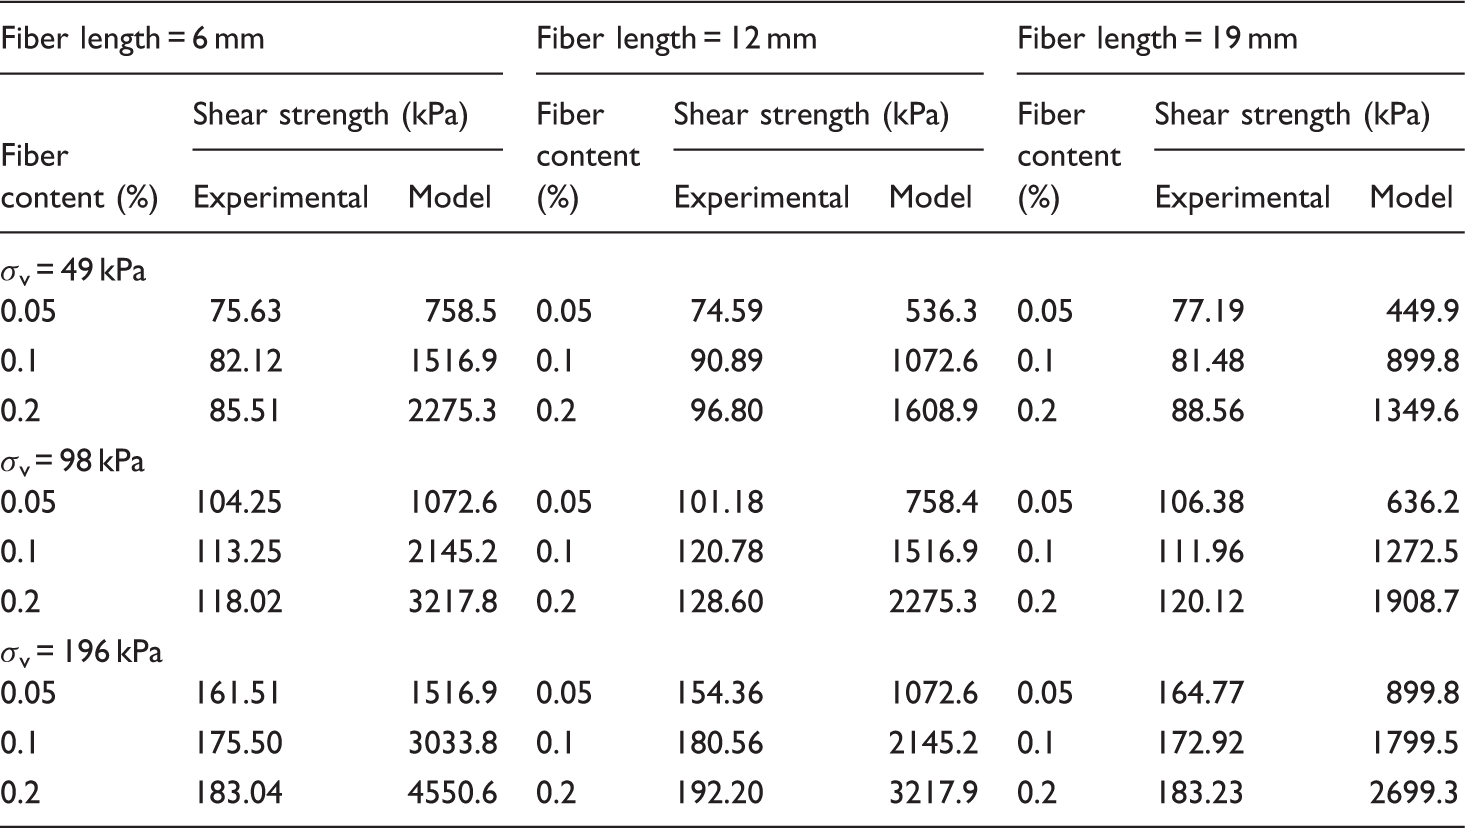
Equation (12) gives the total shear strength improvement of fiber-reinforced soil composite according to fiber parameters and shear test conditions. Table 3 compares shear strength of composite soil derived from experimental shear test with the proposed model outputs. Assuming symmetric fiber distribution, the primary inclination angle of fiber with regard to the shear surface can be considered 45° for all fibers in equation (12). The experimental shear strength of each soil composite sample at vertical stress σv can be calculated in accordance with Mohr–Coulomb equation [25]
The contour of 19-mm PP-reinforced soil sample at 0.2% fiber content. The schematic of effective (red) and ineffective fibers (black) within a soil composite. The contour of 12-mm PP-reinforced soil sample at 0.2% fiber content. Comparison of shear strength of composite soil derived from experimental shear test with the proposed model outputs.


The orientation factor ξ.

Conclusion
This paper was mainly intended to introduce the ECCs as a novel technique to evaluate the uniformity of fiber distribution in randomly distributed fiber–soil composites. Another novelty and innovation in the work was modifying force equilibrium method proposed by Waldron to predict shear behavior of randomly distributed fiber–soil composite. Thus, it was found that the fibers within a randomly distributed fiber–soil composite would be divided into two categories including effective and ineffective fibers. Effective fibers in which exist within both top and bottom shear boxes resist against shear loading of soil composite. On the other hand, clumping and balling of fibers in short fiber composites decrease the reinforcement efficiency of short fibers within the matrix. Therefore, the model was modified by using a reduction factor that was nominated “fiber orientation factor” in this work. The fiber orientation factor was derived by using ECC method. This parameter is a combination of occurring two phenomena: “the number of effective fibers” and “clumping and balling of fibers.” On other words, the orientation factor ξ is made from two components: the number of effective fibers and the concept of clumping/balling.
The proposed model indicated that the number of fibers, fiber diameter, fiber length, the primary inclination angle of fiber with regard to the shear surface, coefficient of friction between fiber and soil matrix, elastic modulus of fiber, the area of shearing zone, and vertical compressive stress determine shear resistance of randomly distributed fiber–soil composite. Consequently, in order to evaluate the accuracy of the model, the soil was selected as the soft-matrix material to prepare composite samples reinforced with PP fibers of 6, 12, and 19 mm at three mass percentages of 0.05, 0.1, and 0.2%. Therefore, the proposed model adequately predicted shear behavior of randomly distributed fiber–soil composite. In the future work, more attempts should be focused on determination of number of effective fibers within the shear zone. Using image processing technique is a novel method that can be used in this way. In addition, investigation of shear behavior of saturated soil is suggested for future works.
Footnotes
Funding
This research received no specific grant from any funding agency in the public, commercial, or not-for-profit sectors.