Abstract
This article studies the relation between fabric tightness and shielding effectiveness (SE) of blended electromagnetic shielding fabric (BESF). The SE of different tightness BESFs is tested using a waveguide testing method. Experimental analyses show that the SE of BESF associates to the tightness linearly, the SEs of same tightness fabrics are consistent under same metal fiber contents, same weave types and different yarn linear densities condition, and the SEs of different type fabrics are inconsistent under same tightness, same metal fiber contents and same yarn densities condition. Moreover, a theory about the relation between the SE and the tightness determined by adjacent yarns states is proposed according to the electromagnetic theory. A number of computation equations about tightness boundary determination are given, which would provide reference for the BESF design, manufacture and testing.
Introduction
Blended electromagnetic shielding fabric (BESF) shield the electromagnetic wave by metal fibers [1]. The shielding effectiveness (SE) is reduced because of a number of interstices among yarns [2]. However, there is no definite interpretation about the interstices influence on the SE at present. In this study, we aim to clear the relationship between the interstice and the SE.
Fabric interstice is denoted by an indicator named tightness. A bigger cover ratio results in tighter fabric and smaller interstice size. A smaller cover ratio results in looser fabric and bigger interstice size [3]. Therefore, we study the relation between the SE and the interstices to explore the relation between the SE and the tightness.
Currently there is little information about the relation between the fabric tightness and the SE. Researches about the relation between the SE and the density associated with the tightness were conducted with simple discussion and lacked targeted study. Li and Zhang [4] discussed the density influence on the shielding fabric when they constructed the fabric model of silver-plated filament, and proposed that a greater density fabric resulted in a higher SE. However, the focus of their study was the influence of frequency on the SE of shielding fabric. They only listed the fabrics with six kinds of density and conducted comparisons for the SE of fabrics. Su and Chen [5] selected a conductive filler to produce stainless steel hybrid yarns to manufacture woven fabrics for testing, and obtained that a denser structure possessed a higher SE. Lou and Lin [6] combined two or many different kinds of fibers to spin the ply yarn and wove them into fabrics. They concluded that the helix angle and tightness of the twist-wrapped yarn were changed to enhance the mechanical properties and EMI SE, but they did not give further discussion about tightness variation. Rajendrakumar and Thilagavathi [7] developed woven fabric samples using composite yarn consisting of copper mono-filament and PET filaments to test and evaluate the SE. They found that the weave and thread spacing of fabric samples significantly influenced the SE, and considered that the density was a critical parameter in determining the SE of textile fabrics. Zhou et al. [8] discussed the effect of cotton stainless steel filament ply embedded density on SE of fabric. They also presented that the SE of fabric increased as cotton stainless steel filament ply density increased, and that the SE was basically consistent after reaching a critical value. But they did not give a specific variation and a threshold range. Ortlek et al. [9] investigated the electromagnetic shielding characteristics of woven fabrics consisting of hybrid yarns, and proposed that the direction, density and settlement type of conductive hybrid yarn in fabric structure were important parameters affecting electromagnetic shielding characteristics of woven fabrics. Perumalraj et al. [10] and Cheng et al. [11] selected copper as a conductive filler to produce copper core yarns to manufacture woven fabric for SE testing. They concluded that with an increase in the number of warp density and weft density, an increase in SE was observed. Moreover, more researches about the relation between density and the SE was reported in the knitting fabric fields [12–14], but the discussions were only suitable for the knitting fabric density and the density value was limited, making it difficult to explain the inner variation. When researchers studied the BESF performance [15–17], fiber shielding performance or yarn testing [18,19], and BESF development [20–22], the relation between the density and the SE was also involved. However, those discussions are in small parts in their total studies. They only listed a number of data variations, and did not completely analyze the relation between the density and the SE and theoretical explanation was also lacking. Therefore, reference values are little.
The research about the relation between the SE and the density is a surface simple observation and analysis, and detailed discussion about the internal variation and theoretical description are lacking. Otherwise, the two indicators are different though the tightness indicator is approximate to the density indicator. Achievements mentioned above are difficult to describe the relation between the tightness and the SE. Therefore, researchers have not explored the relationship and principle between the tightness and the SE in above studies. Scholars proposed some approaches for the interstices influence on the shield SE in other fields such as mechanical and electronics [23–25]. The interstice in those studies was considered as idea rectangular to construct model and conduct theoretical analysis, which has made a number of achievements. However, the interstice in fabric has many characteristics, which is different from that of other shields, such as the number of interstices in the fabric is more than that of other shields, and the size of interstices in the fabric is also smaller when compared to other shields. Therefore, the method applied in normal electromagnetic shield is not suitable for fabric application.
In general, there is little information on the relation between the SE and the tightness, and the approaches in other fields are not suitable for the application in the BESF field. In this article, we test the SE of different tightness and different blended types BSEFs using a waveguide system based on the theoretical analysis. The relation between the tightness and the SE is described by experimental analysis, and the influence mechanism of fabric tightness on the SE is explained from a microscopic view. A number of computational methods of the fabric tightness are given.
Theoretical analysis
Electromagnetic shielding principle of fabric
The shielding of an ideal metal shield can be divided into reflection, multiple reflection and absorption according to the electromagnetic theory. The SE is defined as follows [26]

Let the plane wave be vertically incident to the fabric surface, the reflection loss is calculated by
Therefore, the SE can be expressed as [27]

Equation (2) shows that the BESF SE is determined by its relative magnetic permeability and its relative conductivity. The relative magnetic permeability and the relative conductivity are determined by the metal content of fiber per unit area because non-metal fiber does not shield the electromagnetic wave [28]. The smaller tightness results in the bigger interstice size and the fewer metal fiber content per unit area under unchanged fabric thickness and fiber metal content conditions. The tightness determines the relative magnetic permeability and the relative conductivity of fabric, and also determines the fabric SE. Therefore, exploring the relation between the tightness and the SE is to explore the relation between the interstice and the SE.
Fabric tightness
The fabric tightness is divided into weft tightness, warp tightness and total tightness [3]. Warp tightness Et is defined as the diameter ratio of warp yarn to the distant between two warp yarns, which is expressed as

Weft tightness Ew is defined as the diameter ratio of weft yarn to the distant between two weft yarns, which is represented as:

Total tightness E is defined as the coverage area ratio of weft yarn and warp yarn to total fabric area, which is given by

The yarn diameter and hairiness are tested by the microscope method [29] and the tightness is calculated by equations mentioned above to analyze the relation between the tightness and the SE. Ct and Cw of stainless steel/cotton blended yarn are all 0.043 obtained by experimental testing.
Experiments
Experimental material
To explore the relation between the tightness and the SE of the BESF, we select a number of stainless steel/cotton (15/85) fibers with different linear densities to develop fabrics, and different weaves and tightness fabrics are manufactured by Shanghai Angel Textile Company as experimental samples. We also design a number of high tightness fabrics to analyze the influence of tightness on the SE. The discussion range of the fabric tightness increases and reaches 120%.
Experimental samples are classified into three groups and the fabric weaves are designed as plain, twill and satin, respectively. The plain fabrics are the main research objects. The yarn linear densities of samples are divided into three groups, they are 41.67 tex, 31.25 tex and 25 tex. The twill fabrics and satin fabrics in which yarn density is 31.25 tex are manufactured to analyze the weave influence on the SE. The tightness in each group samples is chosen for every 5% from 60% to 120%. Three experimental samples with the size of 30 cm ×30 cm are manufactured.
Experimental equipment and experimental method
Different BESFs are tested using waveguide tube BJ22 testing system which abides by standard ASTM D4935-2010 [30]. The waveguide testing system consists of analyzers, oscilloscopes, frequency sweep signal source, waveguide, waveguide coaxial converter constitutes. In this system, the signal is launched by transmitting sensor, and then is received by the receiving sensor and is transmitted to the analyzer after the fabric shielding. Finally, the SE can be calculated by the analyzer.
The yarn diameter and the fabric density are tested under a microscope to calculate the total tightness of each sample. Each sample is placed in the middle of the waveguide tube to test the SE. The frequencies of the waveguide tube system are selected from 1.3 GHz to 3.5 GHz. For each sample, the SE testing frequency is in every 0.2 GHz. The distance between the emission source and the sample is 1.5 m. Finally, the SE average value of three samples is calculated.
Results and analysis
Results
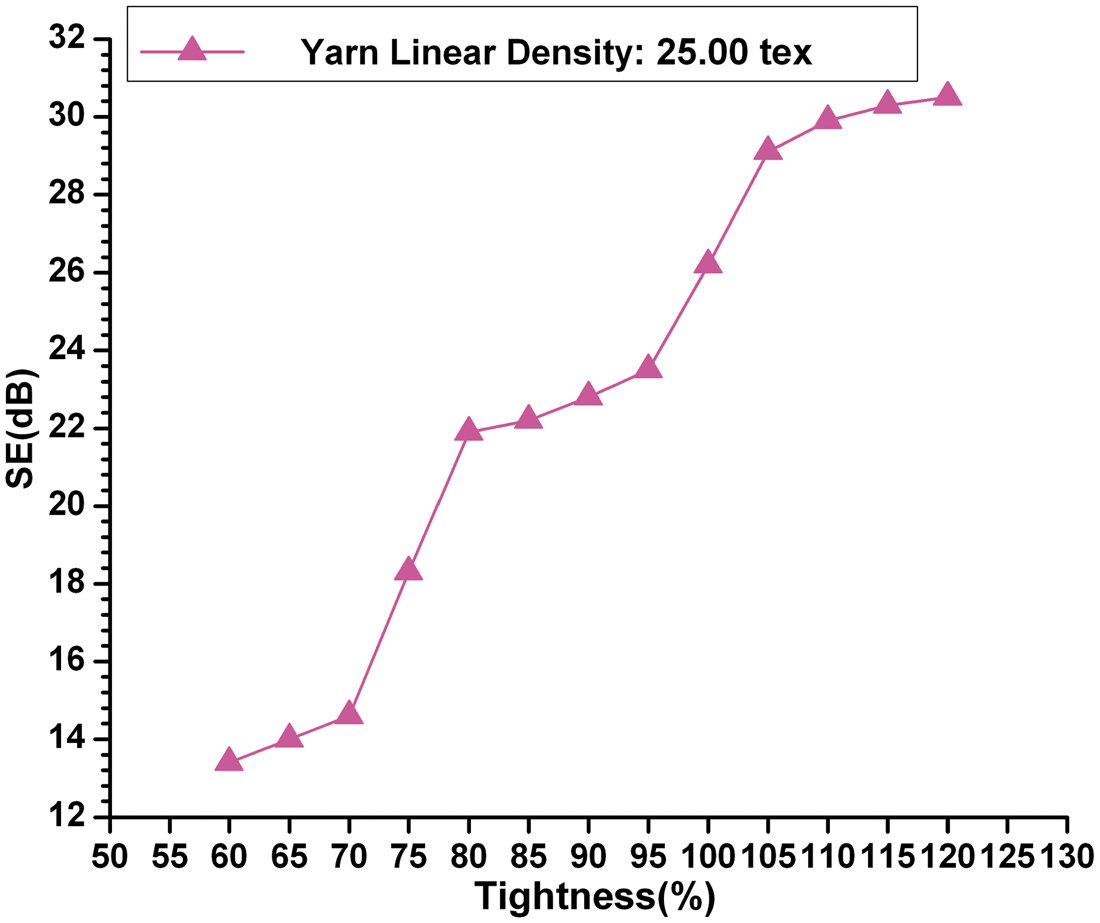
According to equation (2), the SE is determined by the relative magnetic penetrability, the relative conductivity, and the BESF thickness when the frequency is stable. As the frequency of the electromagnetic wave is changed, the SE is changed. However, the tightness and the SE of fabric abide by a certain relation at a certain frequency, which we have verified through experiments. Therefore, we present the experimental results at a middle frequency (f = 2.4 GHz) from the frequency range, i.e. 1.3 GHz and 3.5 GHz, for analysis, and detail the relations between the tightness and the SE of the plain weave samples.
Figures 1 to 3 show the relation between the SE and the tightness of the plain weave samples with different yarn linear densities. Tables 1 to 3 present the samples specification in each relation figure.
Relation between the shielding effectiveness and the tightness of the samples (yarn linear density: 41.67 tex). Relation between the shielding effectiveness and the tightness of the samples (yarn linear density: 31.25 tex). Relation between the shielding effectiveness and the tightness of the samples (yarn linear density: 25 tex). Specification of samples in Figure 1. Specification of samples in Figure 3.


Relation between tightness and SE
There is a positive increasing relation between the tightness and the SE of the BESF in Figures 1 to 3. A bigger fabric tightness results in a better shielding effect. There are two rapid increasing zones in Figures 1 to 3. They are ‘the first increasing zone’ and ‘the second increasing zone’ as illustrated in Figure 4. The BESF SE increases rapidly in the two increasing zones. In literatures [4–11], some researchers have explained that a greater fabric density produced a higher SE, which mean that the greater density result in the greater tightness and the higher SE under the same yarn linear densities condition. The results are consistent with our experimental results. However, the discovery of ‘the first increasing zone’ and ‘the second increasing zone’ is not reported at present. The discovery of two zones would play an important guiding role for the BESF design and reasonable tightness selection.

As can be seen in Figures 1 to 3, the relation between the tightness and the SE is unrelated to the yarn linear density. Figure 4 is a combination diagram of Figures 1 to 3. It can be observed that three curves almost coincide, which means that regardless of the yarn linear density, the SE approximates consistently as long as the tightness is same.
When the tightness reaches a stable value, no obvious increase of the SE occurs in the stable zone as shown in Figure 4. Therefore, the zone is called as tightness boundary of the SE. Finding this critical value is very important for manufacture instruction, which can properly design the fabric and reduce material consumption and manufacture cost.
SE of same tightness and different weaves fabric
Figures 1 to 4 show that the SE of fabric with different yarns and same weaves is consistent as long as the tightness is same. In order to verify if the other weaves fabric follows the same variation, we compare the SE of the samples in Figure 2 with that of other two groups of twill weave samples and the satin weave samples. The twill weave samples and the satin weave samples also consist of stainless steel/cotton (15/85) fibers; the yarn linear densities are all 31.25 tex, and other fabric specifications are same as the plain weave samples. Figure 5 illustrates the SE and tightness variation.
Relation between the shielding effectiveness and the tightness of the different weaves samples.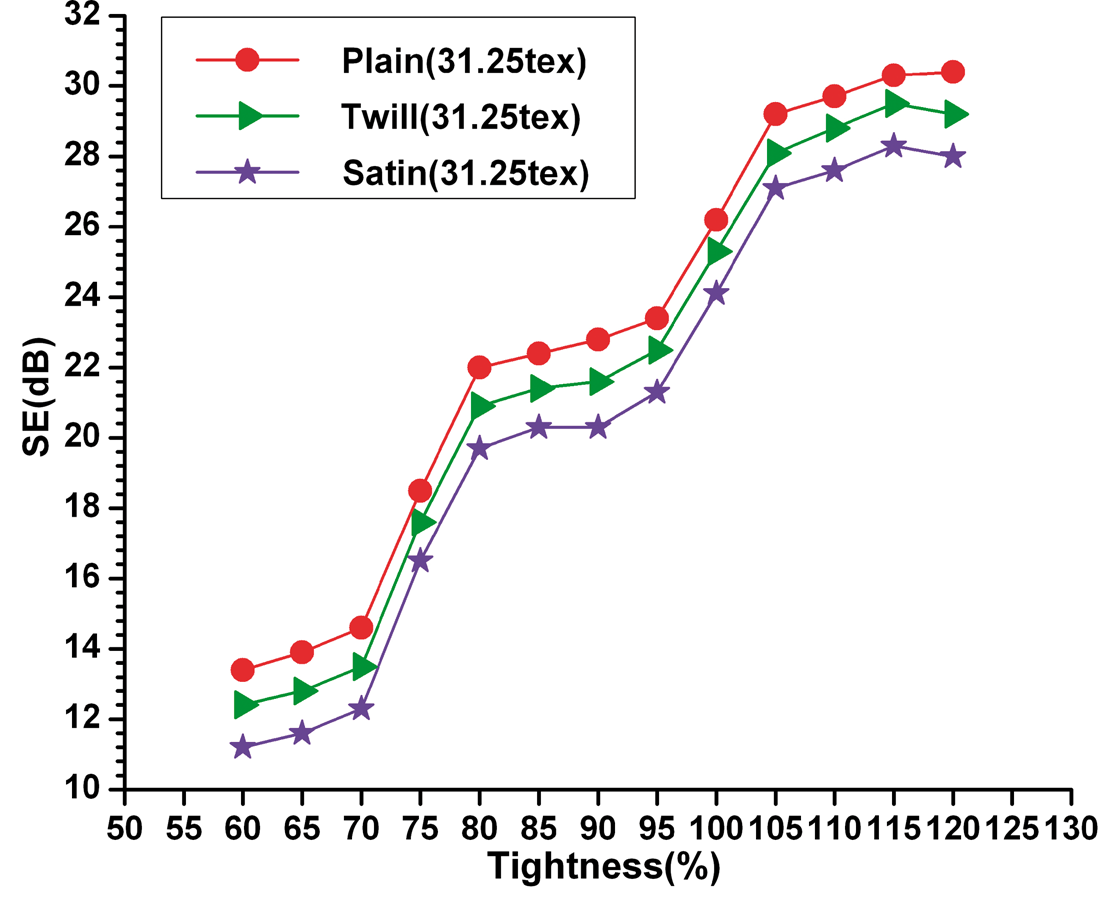
The SE and the tightness change of the other weave samples are consistent with that of the plain weave samples. From Figure 5, it can be observed that the SEs of same tightness and different weaves samples are different. The difference of the plain weave samples is the greatest, followed by the twill weave samples, and the difference of the satin weave fabric is the least. The reason for this phenomenon is mainly due to the influence of the floats. The floats can make the fabric loose and there are many interstices in the fabric. Therefore, those interstices add to the electromagnetic wave leak [17,24], thus decreasing the SE of the fabric. The total lengths of the float yarns of different weaves fabric are different. The total length of the satin weave fabric is longest, followed by the twill weave samples, and that of the plain weave fabric is shortest. Therefore, the SE of the plain weave fabric is better than that of the twill fabric and the satin fabric.
Influence of frequency on the SE
Experimental analyses show that the SE of same tightness fabrics decreases with the increase of the emission frequency in the frequency range 1.3–3.5 GHz. The phenomenon is determined by the performance of the stainless steel. The change in the conductivity is gentle and the magnetic permeability decreases rapidly with the increase in frequency [31]. The fabric SE declines according to equation (2). Figure 6 gives the SE variation by the frequency as the fabric weaves are plain, twill and satin and the total tightness is 80% and the yarn linear density is 31.25 tex. As can be seen in Figure 6, for three groups of samples the SE decreases by the speed of 0.3 dB as the emission frequency increases.
Influence of frequency on the shielding effectiveness of the same tightness samples in a frequency range (3–3.5 GHz; tightness: 80%).
Influencing mechanism of fabric tightness on the SE
As shown in Figures 4 and 5, the curve of the SE and the tightness is not increasing linearly, and there is a rapid increasing zone and a stable zone. The two zones are produced by different adjacent states yarn. According to the electromagnetic theory [26] and equations (1) and (2), there are fewer metal fibers per unit area and less contact among metal fibers when the interstices of fabric are bigger; also the relative magnetic permeability and the relative conductivity decrease as the SE decreases, and vice versa. Therefore, it is concluded that the adjacent states of yarn determining the metal fibers distribution also determines the SE variation.
Figure 7(a) shows local structure of adjacent yarns in the fabric, and Figures 7(b) to (g) illustrates the interstices change among yarns. Figure 7(b) represents the interstice state among yarns. Yarns are not in contact with each other, and there are many tiny interstices, and the fabric SE is low. With the increase of the tightness of the fabric, yarns start to contact, i.e. the yarns hairiness contacts each other, and the fabric SE increases (Figure 7(c)). Corresponding to Figure 4, it is the left border of the first increasing zone. With the increase of the tightness of fabric, the quantity and interface of hairiness increases; the interstices are fewer as shown in Figure 7(d), and hence the fabric SE increases obviously. When the tightness increases and reaches a certain degree, the increase of metal fiber in the interstice tends to be stable as illustrated in Figure 7(e), and the increase of the SE also tends to be stable. The tightness further increases and the yarns contact completely as shown in Figure 7(f). As the interstices among yarns are filled, the SE increases significantly. It is a step into the second increasing zone in Figure 4. Then the yarns show compressive state, and the content of metal fiber per unit area and the SE increases rapidly. With the continuous increase in the tightness, the compressive status of yarn reaches a certain degree, as shown in Figure 7(g), and the content of the metal fiber per unit area also becomes stable. Later, the yarn compressive degree reaches a limit and the SE becomes stable.
Change of interstice among yarns.
Mathematic description of SE–tightness curve and border determination
As can be seen in Figure 4, we can easily give two rapid increasing zones and a stable zone of the SE of the plain weave fabric with different tightness, which can provide reference for the tightness determination of the BESF. Let 
However, equation (7) is only suitable for the plain weave fabric, and not for other weaves fabric. Equation (7) is obtained by experimental results. If all SE computation equations of other fabrics are obtained by experiments, it will be time-consuming and not cost-effective, and it also seems clearly unrealistic. Therefore, according to the change mechanism of the SE with the tightness and equation (6), the SE computation of other fabrics can be given as follows


Figure 4 shows that the SE reaches a stable state when the fabric tightness is 
From equations (8) to (12), the yarn average diameter and the hairiness thickness can be obtained by experimental testing such as microscopic testing or projection testing [29], but its value will be different as influenced by yarn quality grade and fiber type.
We calculate the tightness range with the parameters of the yarn linear density and hairiness of the plain, twill and satin weave samples according to equations (8) to (12). The computation results are consistent with that of equation (7). Thirty other samples, where weaves are plain, twill and satin and the tightnesses are different, are tested and the tightness range of samples is calculated by equations (8) to (12). The computation results are consistent with that of equation (7).
Conclusions
There is a positive correlation between the SE and the tightness of the BESF, and there are two rapid increasing zones and a stable zone. When the metal fiber content of yarns is consistent and the BESF weaves are certain, the SE of the same tightness fabric is consistent though the yarn linear densities are inconsistent. The BESF SE is determined by the adjacent states of yarns. The yarn adjacents include three factors: the distance between yarns, the interlaced state between yarns and yarns compression. The tightness value of the left and right boundary in the first zone, and the second zone of the SE curve is calculated using equations (8) to (12). Normally, the value of the left boundary is (65, 75), and the value of the right boundary is (100, 110). The SE of the different types of BESF is different under the same metal content and the same yarn linear density. Specification of samples in Figure 2.