
Abstract
This paper reports a fast, accurate, and non-destructive three-dimensional imaging approach based on using quantum dots and confocal laser scanning microscopy to get three-dimensional images of internal pore structure of the nanofibrous materials. A practical method of making the fiber fluorescent using quantum dots was applied before three-dimensional imaging by confocal laser scanning microscopy. Fibrous scaffolds with different porosity parameters produced by electrospinning and their three-dimensional pore structure was evaluated by this approach. Furthermore, the introduced approach can be used to measure the pore interconnectivity of the scaffold.
Introduction
Electrospun fibrous scaffolds have received great interest in recent years due to their promising properties which make them suitable structure for mimicking the natural extracellular matrix (ECM) [1,2]. This three-dimensional (3D) structure has already been studied for different applications such as tissue engineering of bone [3,4], vascular scaffolding system [5–8], cardiac tissue [9–11], peripheral nerve system [12–16], ligament/tendon and intervertebral disc [17,18], wound healing and drug delivery [19] and skin [20,21]. There are a few basic requirements that have been widely accepted for fibrous scaffolds such as biocompatibility, reliable thermal and mechanical properties similar to those of ECMs, adequate surface properties and appropriate 3D pore architectures [22–28].
The 3D pore structure of fibrous scaffolds is one of the key properties which can determine cell in-growth, and proliferation within the scaffold, as well as integration with surrounding tissues. It is also well-documented [4,8,10,25,29–31] that an ideal scaffold for tissue engineering would be highly porous and contains an interconnected pore network through which nutrients and metabolic waste could flow. Also, cells would be able to migrate, and tissue would be able to in-grow through the mesh and integrate with surrounding tissues. Also, it is increasingly believed that for any type of cells including fibroblasts, mesenchymal stem cells (MSCs) [21,32–35] chondrocytic cells [22], human osteosarcoma [4] etc, pore structure of the scaffold contributes to provide appropriate nutritional conditions and spatial organization for tissue regeneration. For instance, Holy and co-workers [36] attributed their great success in forming 3D bone tissue to highly porous, interconnected morphology of biodegradable polymeric scaffold. Therefore, depending on the desired applications, porous structure must be carefully controlled [22]. These architectural characteristics would include total porosity, pore size, pore throat diameter and more importantly, interconnectivity [24,31,37–40]. Consequently, to engineer scaffolds design with desirable pore architecture, an effective evaluation approach is required [2].
There are several well-documented approaches in literature to evaluate these pore structure properties including scanning electron microscopy (SEM) analysis, gas pycnometry and adsorption, flow and mercury porosimetry, theoretical modeling and most recently micro-computed tomography (micro-CT). To choose a suitable technique, the associated virtues and pitfalls of each technique should be scrutinized. Sometimes a combination of techniques is required. However, a single non-destructive and capable of providing a comprehensive set of data is the most attractive option [24,41].
SEM image analysis of fibrous scaffolds by incorporating different image analysis methods is one of the renowned methods for researchers to measure porosity parameters of woven fabric [42], non-woven and membranes [37] and nanofiber scaffolds [38,43–45]. Although image processing of SEM micrographs for geometrical characterization is useful for measuring total porosity, pore shape, pore size and pore size distribution of relatively thin non-wovens, it cannot be applied to multilayer electrospun fibrous scaffolds. Another problem encountering to this method is that it is not possible to measure 3D pore characteristic of the scaffolds and it is limited to relatively small fields of view. However, using the TEM images for characterizing the porosity of membranes has many advantages, it is very time-consuming and costly and it is still limited to single (or very thin) layer of scaffolds [37,46].
Other common methods for pore structure characterization by using the adsorption and desorption of a known fluid like gas adsorption methods, mercury and liquid porosimetry and so on are the other approaches for understanding the pore structure of fibrous materials, but all of them have some pitfalls like: these techniques cannot conduct the scaffold’s interconnectivity or require a high pressure to push the fluid (like mercury) to the scaffolds, which in case of nanofiber scaffolds may change morphology of the scaffolds. Moreover, these techniques cannot measure pore throat diameter of scaffolds [44,47,48]. Some of them can only measure the pore size and distribution within the range of 0.013–500 µm with ignorable nanofibers distortion errors [24,41,49]. More importantly, they cannot measure isolated pores size (closed and blind pore) in scaffolds, nor does it distinguish pore interconnections.
X-ray micro-tomography (micro-CT), on the other hand, is a more recent non-destructive method of examining the characteristics of scaffolds. This method, by obtaining 3D image of a scaffold, when combined with 3D image analysis techniques can provide not only qualitative but also quantitative information of the scaffold [24,50]. In spite of numerous advantages of micro-CT, there are some serious concerns in case of nano-microfibrous scaffolds (scaffolds with the range of fiber diameters from couple of nanometers to a few microns) such as needed synchrotron high-beam energy facility to enable it to observe down to 100 nm objects, which make this technique very expensive and/or inaccessible for many countries up to this moment [2].
As mentioned in earlier introduction part, the desirable way to evaluate the scaffold 3D pore architecture after the fabrication process would be a non-destructive, non-invasive, easy-to-access and quantitative technique on a relatively large fields of view. Such goals can be achieved from confocal laser scanning microscopy (CLSM) images after suitable image analysis methodology. CLSM is a non-destructive sectioning imaging technique that can in principle obtain and reconstruct 3D information of structure, providing that the materials is sufficiently transparent [39,51]. CLSM allows resolutions and in-depth contrast of a few micrometers down to100 nm if two-photon excitation microscopy is used as the excitation source. A wide range of structures and materials have been characterized with CLSM: membranes, scaffold, fiber-reinforced composites and various organic materials such as polymers and materials for tissue engineering [25,39,52–54]. Fluorescent dye can be added to a sample in order to reveal features that do not reflect light or highlight areas of interest. Dyes such as fluorescein [41], rhodamine [52] and 40’6-diamidino-2-phenylindole (DAPI) [25] are used extensively within biological labeling applications; however, their application is less common in materials science. The common methods to make the fibrous material fluorescent is incubating in a fluorescent dyes solution which in case of nano-microfibrous scaffolds would change their morphological and pore structure properties. In this research work, we incorporated quantom dots (QDs) nano-particle into polymer solution to make the fibers fluorescent before electrospinning. QDs have a long fluorescent lifetime after excitation, which make them an excellent choice for time-gated imaging [55].
This work introduces a new method of 3D imaging technique by CLSM after incorporating QDs into the nanofibers. In order to demonstrate the potential of this approach, polymeric nanofibrous scaffolds with incorporating QDs in the polymer solution was initially produced by electrospinning process and then scaffolds were evaluated by this approach. Application of this method for further study of nanofibrous materials including analyzing the 3D pore structure and fiber-to-fiber contacts are also reported in serial papers elsewhere [2,56].
Materials and methodologies
Preparation of fibrous scaffolds
Polycaprolactone (PCL, 80000 MW, Sigma-Aldrich, St. Louis, MO) was dissolved in Chloroform/Methanol (3:1) (Sigma-Aldrich, St. Louis, MO) at a concentration that ranged from 14 to 20%wt polymer in solvent. CdSe-CdZnSZnSZnSZnS colloids quantum dot (QDs, Invitrogen Co., USA) with 578 nm emission peak and 5.72 nm average particle diameters were added to the polymer solution at 8%v/v to encapsulate them inside the fibers and make them visual through CLSM. Polymer solution was fed by syringe pump (KD Scientific, USA) at a rate of 0.55 ml/h through a 21 G blunt-tipped needle. A voltage of 16–20 KV was applied to the needle tip with a high-voltage power supply (Gamma High Voltage Research, Ormond Beach, FL, USA). A set of collectors was placed with needle-tip to collector distance 15 cm, as described in details by Bagherzadeh et al. [57]. The fibrous scaffolds then were dried in a controlled atmosphere at ambient temperature for 1 day and in vacuum of less than 5 mmHg for at least 12 h and then were stored in a dessicator before testing.
To visualize the fibers in the scaffolds, colloids QDs were blended with polymer solution for 2 h before electrospinning (Figure 1). After that, aqueous QD–PCL blend solutions were electrospun to make the fibrous scaffold, in which QDs were confined. After a pre-study of the best volume percent of QDs in the polymer solution, 8% v/v had chosen to make the fiber enough bright and uniform fluorescent.
A schematic mechanism for incorporating the quantom dots (QDs) into the fiber structure [2].
Surface morphology of nano-microfibrous scaffolds
The average diameter of the electrospun fibers was observed by an SEM (Zeiss, Supra550). Images were taken using a microscope operated at an accelerating voltage of 2–3 kV, after sputter coating with gold (BAL-TECSCD 050 Sputter coater, UK). Diameters of the electrospun fibers were analyzed from the SEM images using image analysis software (ImageJ, National Institutes of Health, USA). Typical SEM photographs of fibrous scaffolds with different polymer concentrations are shown in Figures 2–4.
Scanning electron microscopy (SEM) micrograph of 20% wt/v polycaprolactone (PCL) in solvent. Scanning electron microscopy (SEM) micrograph of 17% wt/v polycaprolactone (PCL) in solvent. Scanning electron microscopy (SEM) micrograph of 14% wt/v polycaprolactone (PCL) in solvent.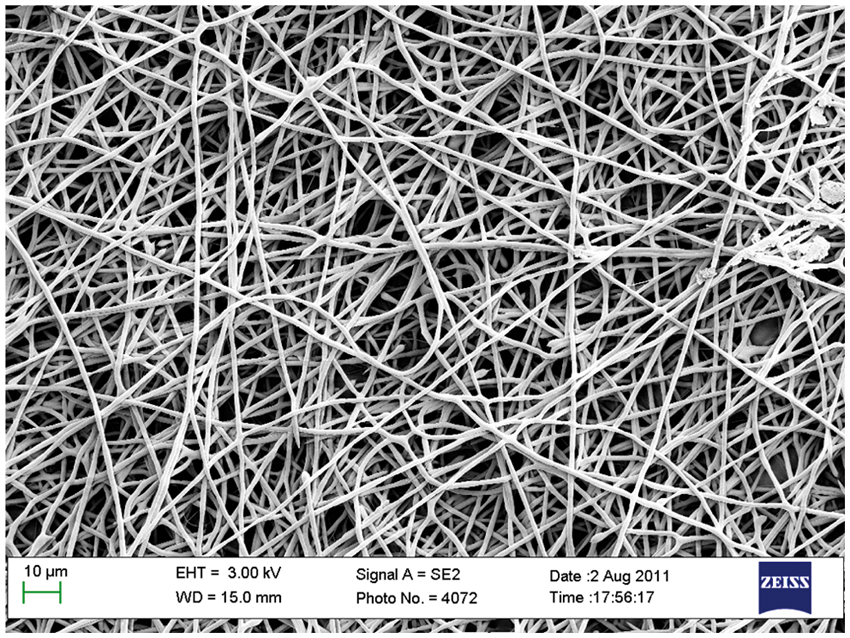


CLSM approach methodology
A schematic configuration of the approach followed in this study is shown in Figure 5. After incorporating the QDs into the solution, they were electrospun to make the fibrous scaffold. Scaffolds were prepared for confocal stacking image capturing from different part of scaffolds, and then 3D stacks of images were reconstructed by using ImageJ software for further studies. To do this, stacks of images were opened by the software and were used to reconstruct a 3D image by using the interactive modules of the software.
Configuration of pore structure study of fibrous scaffold.
Image acquisition from labeled fibrous mats
A Leica TCS SP5 confocal laser scanning microscope was used to capture 3D images from scaffolds. To prepare the samples for the confocal microscope, samples were placed onto a glass slide with a cover glass. Scanning was performed starting from the top layer of each scaffold towards the deeper layers and stopped when no fluorescence could be detected.
3D image reconstruction
The CLSM images were processed as a series of 50–60 slices of 1024 × 1024 pixels with a spatial resolution of 0.10 µm. A small section of scaffold slices was selected by an automated crop algorithm to process a representative sample of the scaffold and reduce the computational time. 3D reconstruction module of ImageJ software was used to visualize the 3D reconstructed images.
Porosity and pore size
The porosity of the nanofiber mats was measured using gravimetry method. The thicknesses of the scaffolds were measured using CLSM reconstructed images, which can be found in detail elsewhere [2]. Using the measurement of the thickness and knowing the diameter of the mats, the volume of the structures could be determined. The mass of the scaffold was also measured allowing for determination of the apparent density of the mats, ρmats. The porosity, ɛ, was then calculated according to equation (1) by having the density of PCL, 1.145 g/mL,

To estimate the mean pore size of scaffolds, a previously developed theoretical model was applied [58]. In this model, an electrospun scaffold was considered to be a collection of randomly placed single-layer networks. Mean pore size of 3D networks formed from n single-layer nanofibrous network was computed on the basis of the porosity and mean fiber diameter. The average pore radius for multilayer network,

Results and discussions
Average fiber diameter
To measure the average diameter of nano-microfiber mats, 100 fibers in the SEM micrograph were selected randomly and the average value of them was considered as the average fiber diameter. Figure 6 shows the histogram of fiber diameters for different samples. The average diameter of nano-microfibers for different samples based on the above procedure is presented in Table 1.
Histogram of fiber diameters for different specimens. Average value of fiber diameters for different specimens measured by ImageJ software

Statistical analysis on the fiber diameter of different samples was done by using SPSS software (V.14) with considering confidence interval 0.95. It can be easily confirmed that with an increase in concentration of polymer solution (keeping other parameters constant), the average fiber diameter increases. The larger fiber diameters at high concentrations could be attributed to the viscosity of the solution that could be high enough to lower the bending instability of the jet and consequently decreasing the drawing forces in the spinning zone [57].
Scaffold porosity and predicted pore size
Mean porosity and pore size of the samples

Measurable properties from reconstructed images
Structural pore properties including pore diameter, pore interconnectivity and porosity of different samples can be easily seen from the reconstructed pictures. Figure 7 shows typical 3D CLSM stacks of PCL 14% sample (a) and the corresponding 3D reconstruction (b).
Typical three-dimensional (3D) stacks of confocal laser scanning microscopy (CLSM) (a) and reconstructed micrograph (b) for the polycaprolactone (PCL) 14% sample.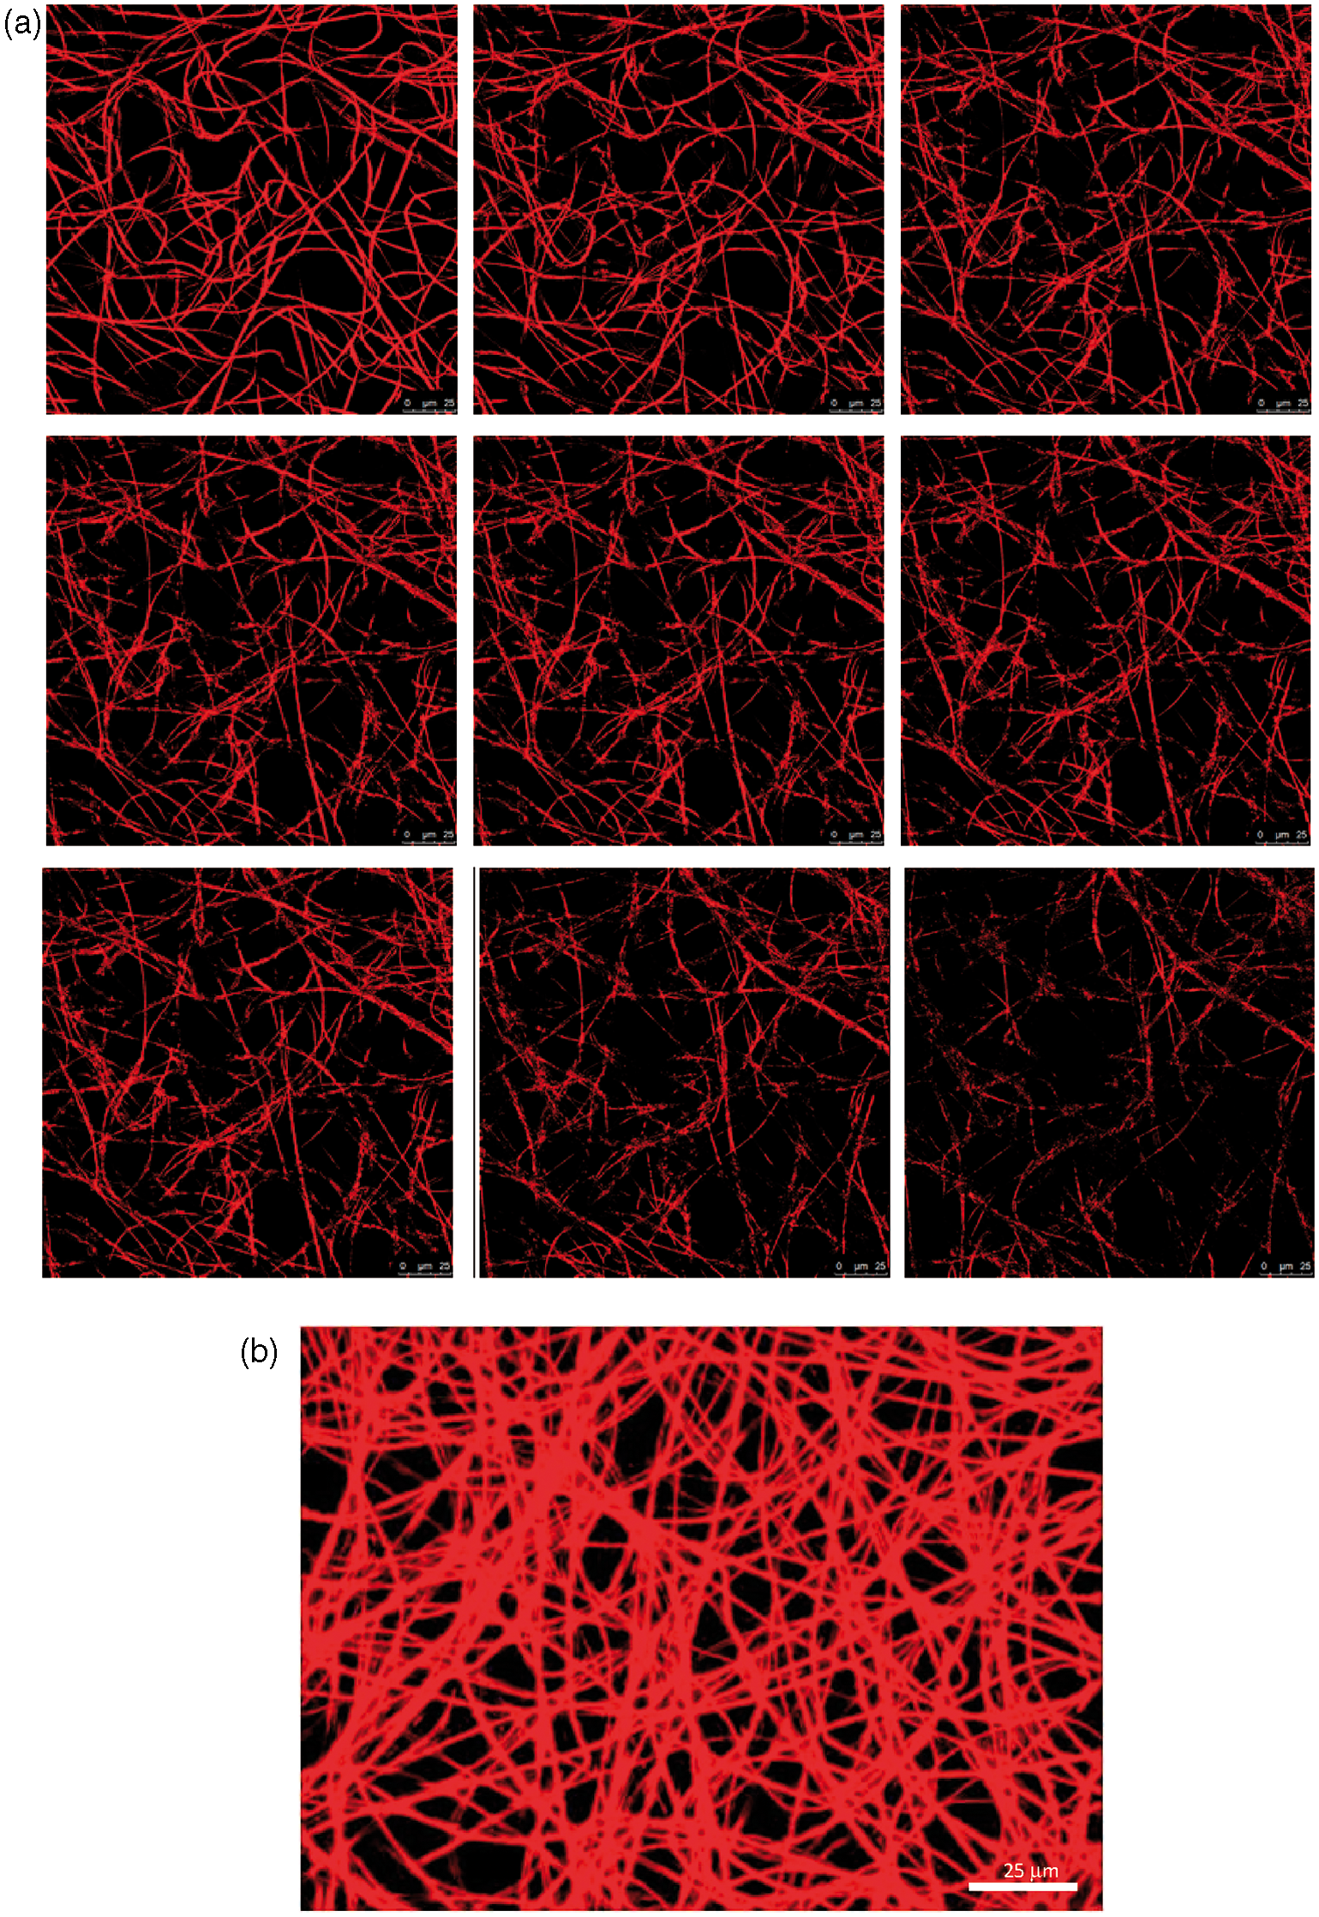
The image analysis of the CLSM stacks allows one to calculate a set of pore structure parameters, e.g. pore interconnectivity, which cannot be obtained by other techniques [55]. Incorporating the QDs into the fiber structure is a simple method to make the nanofibers fluorescent comparing with other staining methods. This method is more useful when one wants to study the micro-structure of fibrous materials, which in the case of incubating the scaffolds in the fluorescent dyes solution would change their morphological and pore structure properties. Introduced approach allows one to calculate a set of pore structure parameters including pore throat diameter, porosity and pore interconnectivity of nanofibrous scaffolds which is reported in detail elsewhere [55]. It is reported [55] that a good agreement can be observed by comparing the results of pore size diameter obtained from capillary flow porometry and those obtained from image analyzing of the reconstructed images from the CLSM (with significant level 0.05).
Another application of the introduced approach is for study of structural and morphological parameters within the nanofibrous materials where it is difficult to obtain a section along the full length of any fiber in a nanofibrous structure. More recently, this technique successfully has been used [56] to investigate the effect of theoretical dependence of fiber diameter and network porosity on average number of fiber contacts in nano-microfiber mats.
Conclusions
In conclusion, incorporating QDs plus using CLSM demonstrated some advantages to other existing methods. This approach is a non-destructive, simple, cheap (in terms of sample preparation and imaging technique) and easy-to-access method, hence samples remain intact for further assays. Overall, our results support using CLSM and incorporating QDs into the nanofiber assembles approach as an easy and reliable method to study morphology and microstructure of nanofibrous scaffolds.
Footnotes
Acknowledgements
The authors kindly thank Dr. Alessandra Sutti, Institute for Technology Research and Technology (ITRI), Deakin University, for her help in the confocal laser scanning microscopy observations, and Dr. Mary She and Dr. Edin Nuhiji for their scientific contributions.
Funding
This research received no specific grant from any funding agency in the public, commercial, or not-for-profit sectors.