
Abstract
In this article, three test methods are described to measure the water spreading behaviour of textiles such as rate of absorbency and total absorbent capacity. The methods described are manual method, commercial image analysis method using Photoshop and embedded image analysis method using digital signal processor through MATLAB software (EIAS). With these methods the rate of absorbency and total water absorbent capacity were analysed in 12 different knitted/woven fabrics. In order to compare the three test methods, the correlation among the methods were analysed. A very good correlation (more than 0.9) was found between the manual water spreading tests and commercial image analysis method using Photoshop when compared to manual versus EIAS method. Also Photoshop versus EIAS method correlation was found better than manual versus EIAS method.
Keywords
Introduction
Clothing comfort is an important aspect for any garment used for sportswear and leisurewear. Every human being sweats during different kinds of activities. Das et al. [1] have stated that in sweating conditions, wicking is the most effective process to maintain a feel of comfort. In case of clothing with high wicking properties, moisture coming from the skin is spread throughout the fabric and may offer a dry feeling; the spreading of the liquid enables moisture to evaporate easily.
According to Mahadevan [2] wicking is the ability of a fabric to take in moisture. Kissa [3] has stated that liquid moisture transfer through a textile material consists of two processes – wetting and wicking. In the wetting process, the fibre–air interface is replaced with a fibre–liquid interface and wicking starts as the liquid enters into the capillary formed by two adjacent fibres or yarns. Ghali et al. [4,5] and Hanett et al. [6] have reported that wickability is the ability to sustain capillary flow whereas wettability describes the initial behaviour of a fabric, yarn or fibre when it comes in contact with liquid.
Wicking of a drop can be divided into two phases of different kinetics [7,8]. At first, the drop spreads on the substrate and penetrates the porous substrate underneath. During the second phase of the capillary penetration process, all of the liquid is contained within the substrate and spreads radially under the influence of capillary forces.
As per AATCC 198 [9], horizontal or transverse wicking is the ability of horizontally aligned fabric specimens to transport liquid along and/or through them by capillary action.
Sampath et al. [10] have stated that the analysis of transverse wicking characteristics of the fabric is also as important as the longitudinal wicking because the perspiration (sweat) transfer from skin involves its movement through the lateral direction of the fabric
Therefore objective measurement of the moisture transfer properties of clothing is important to apparel product development. As per AATCC 198 [9], there are two parameters most commonly used to characterise the properties of liquid moisture management performance of fabrics, which are the rate of absorbency and the total absorbent capacity. The former determines the rapidity with which fluid is imbibed while the latter determines the total capacity of the material to absorb and hold fluid.
Many authors have tried to find the moisture transfer properties of textile objectively using different test methods. Kissa [11] has measured the spreading area of a drop on textile fabric as a function of time. The area of a spreading liquid was photographed at uniform time intervals with an instant-picture camera. The area depicting the spreading liquid was cut out from the dried photograph and weighed. Kissa found that assuming that the fabric was impermeable to the liquid, the spreading rate could be represented by equation (1)

In this study, the equations developed by Kissa are applied to a more rigorous measurement of spreading behaviour using the image analysis of frames captured at fast rates, especially in the initial stages. Measurements of the dynamic change of shape of the spreading area of the liquid are also made.
Hu et al. [12,13] have developed another method based on the change of the electrical resistance of the fabric with its water content. It consists of six concentric rings (sensors) of different sizes which are then placed on both the surfaces of the fabric. The distance between two consecutive rings is 5 mm except the first one which is at 1.5 mm from the centre.
A similar instrument has been developed by Adams et al. [14] to measure the in-plane flow of fluids in a fibrous network. They have used an image analysis technique to obtain the shape and position of a radially advancing fluid front, which can define the directional permeabilities in the plane.
Lee et al. [15] have conducted horizontal wicking with a spectrophotometer in order to avoid using balances. They have determined the liquid weight wicked into the fabric by measuring the difference in colour depth between wet fabric and dry fabric. Various researchers like Morent et al. [16] and Perwuelz et al. [17] have proposed the image analysis instead of an analytical balance to determine the extent of horizontal wicking. In the study by Morent, the progression of the liquid front during wicking was recorded with a digital camera and an algorithm was used to calculate the area of the fabric wetted by fluid.
Petrulyte et al. [18] have measured the dynamic water absorption of terry woven fabrics using image analysis technique. They have found the terry woven fabrics absorption speed, influence of pile height with respect to liquid retention capacity and the impact of macerating process on absorption process.
Transverse wicking measurement is also as important as vertical wicking measurement for engineering and designing sportswear. Transverse wicking behaviour of the fabric or garment is more responsible for sweat evaporation during active sports events. Recent studies are focused on analysis of transverse wicking behaviour of fabric for active sportswear. Work still needs to be done in order to analyse transverse wicking behaviour of textiles quantitatively in the model.
Some standards and test methods can be employed to evaluate a fabric’s simple absorbency and wicking properties. However, the existing standards are unable to measure the behaviour of dynamic liquid transfer in clothing materials as the static test results will not serve the purpose of sportswear re-engineering. Dynamic liquid transfer analysis helps to re-engineer the active sportswear products. In this research work, dynamic transverse wicking test methods have been developed using image processing technique. Applying these new methods can be helpful for measuring the transverse wicking in textiles more accurately and cost effectively. Also comparison of the performance of the different test methods helps to understand the test results and the reliability of the test results and devices.
In image analysis method, using different software techniques helps find exact colour of pixels (wet area pixels) from the image. Still there is a further scope in terms of speed (using embedded image processing system using digital signal processor) and accuracy improvement in the image analysis method. Also the study of spreading measurement by image processing through commercial image processing software like Photoshop has not been done earlier.
In the present study, three test methods (two dynamic methods) are described and comparisons are made between three different test methods. The methods are: (i) Manual method; (ii) Commercial image analysis method through Photoshop; and (iii) Embedded image analysis technique using digital signal processor through MATLAB software. The reliability of the three methods is analysed using correlation coefficient analysis.
Material and methods
Fabric particulars.

EPC: ends per centimeter; WPC: wales per centimeter; PPC: picks per centimeter; CPC: courses per centimeter.
Sample no. 1–3, 11 and 12 are knitted fabrics; Sample no. 4–10 are woven fabrics.
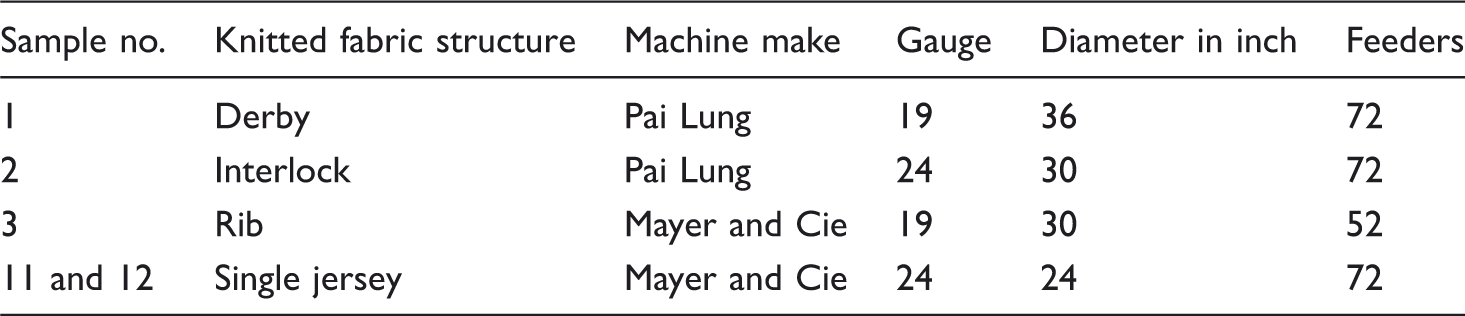
Knitting machine details.
The knitted and woven fabrics were subjected to scouring and bleaching processes using winch and jigger machine, respectively with the following procedure.
Scouring: The bath containing 1.5% NaOH, 1% Na2CO3, and 1 g/L wetting agent was processed at the temperature of 90℃ for 60 min by maintaining pH at 10.5–11.
Bleaching: The bath containing 2.5% H2O2, 0.3% peroxide stabiliser was treated at 90℃ temperature for 60 min by maintaining pH 10.5–11. Then the samples were treated with hot water followed by treatment with 1 g/L peroxide killer followed by hot wash at 80℃ temperature for 15 min. Then the samples were neutralised with 0.5 g/L of acidic acid.
The polyester/viscose blended woven fabrics were subjected to scouring using 0.5% soap solution (Lisapol) at 80–90℃ temperature for 1 h and the fabrics were bleached using 4 g/L of hydrogen peroxide for 1 h at 90℃ at pH 10.5–11.
Contraction percentage of knitted fabric was measured and was noted as 5% in course wise and 4% in wale wise direction.
Sample measuring 10 cm× 10 cm and 25 cm× 25 cm (based on type of test) was prepared and then placed in climatic chamber at 20℃ and 65% RH. The 10 tests were conducted from each sample and the average test results were discussed.
Transverse liquid spread test
After full relaxation, the following tests were carried out for all the 12 samples.
Rate of absorbency
It is the ability of the fabric to transfer the water by spreading action. In this method, 50 µL of distilled water is allowed to fall on the fabric and the spreading area is recorded with respect to time. Rate of absorbency is calculated from the value of spreading area with respect to time. Sample size used for testing is 10 cm × 10 cm.
Total absorbent capacity
It is the ability of the fabric to transfer and retain the water by spreading action. In this method, 40 µL of distilled water is allowed to fall on the fabric continuously for every 2 s till the fabric reaches its saturation point. When the sample cannot absorb any more water, the excess water droplets falls down through the fabric. The experiment is stopped at this stage. Time taken from starting to saturation point is noted. Total volume of water retained by the fabric is calculated by multiplying the time taken in seconds for the test with amount of water (40 µL) falling on every 2 s.
Volume of water in mL = ((time taken for saturation point in seconds/2)*40 µL)/1000. Total area of water spread at the saturation point is also noted with respect to time. Sample size used for testing is 25 cm × 25 cm.
Different test methods of transverse wicking area measurement are correlated with Pearson correlation coefficient.

Method I: Measuring water spreading behaviour on the fabric by manual method
Apparatus description
As shown in Figure 1 in manual method, as per the type of test (rate of absorbency, total absorbent capacity) the fabric sample is mounted on an embroidery frame. The frame is fixed on a slot in the stand without any movement. For measuring total absorbent capacity, a burette is clamped vertically with the help of holder. Burette tip is positioned 6 mm above the surface of the fabric [19]. As per the testing procedure of AATCC method 198-2011, 40 µL of water is allowed to fall on the fabric continuously for every 2 s till the fabric reaches its saturation point. Water flow rate is controlled with the help of water flow rate controller knob. For measuring the rate of absorbency Investigating liquid spreading behaviour on the fabric. (a) Front view of transverse liquid spreading instrument; (b) Close view of liquid spreading after drop placed; (c) Marking and transferring of liquid spreading area using pencil (keep transfer sheet between graph sheet and the fabric); (d) Transferred line on the graph sheet; (e) Finding the area in mm2 by counting.
Area calculation
The centimeter graph sheet should be kept between transfer sheet and the fabric surface, and the boundary of the water spread area should be traced by using a pencil as shown in Figure 1. From the marked graph sheet the area in mm2 can be found. A total of 10 samples are tested. This method took 10 min to measure water spread area in mm2 for each sample (depends upon the area of manual counting from graph sheet).
Method II: Measuring water spreading behaviour on the fabric by commercial image processing method using Photoshop
As shown in Figures 2 and 4, a high resolution Logitech HD Pro webcam c910 with Carl Zeiss optics autofocus facility camera is used to measure the dynamic movement of the liquid over the fabric surface. The camera has the facility to produce razor-sharp images of high-definition 10-megapixel video capture quality and automatic brightness adjustment and colour compensation. The camera is mounted on a stand, equipped with a LED light, and connected to personal computer via its USB port. The distance between the camera and fabric sample is calculated as per the calibration procedure.
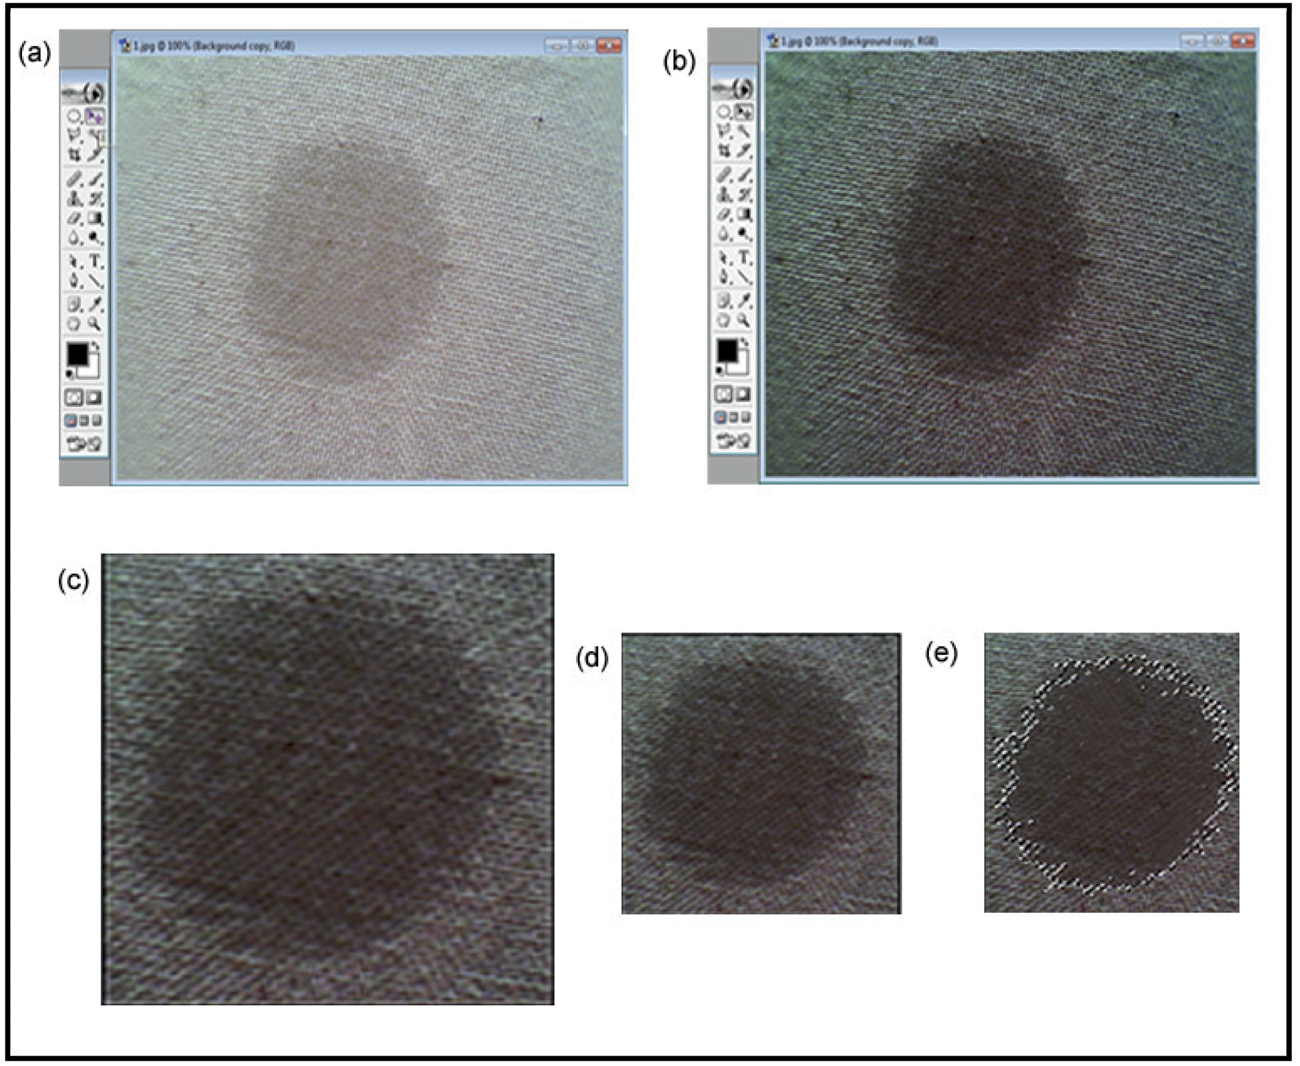
Schematic diagram of commercial image processing method. Digital processing of captured water spreading image. (a) Raw image received from digital video camera; (b) Quality improved image after adjusting (brightness/contrast); (c) Cropped image; (d) Resized image (resolution: 10 pixels/cm); (e) Dark pixels selected through magic wand selection tool with the help of grow option. Experimental setup of embedded image processing method using DSP. Schematic diagram for assessing water spreading area.

For measurement of dynamic liquid spreading rate, the fabric sample (as per the type of test) was mounted on an embroidery frame. The frame was fixed on a slot in the stand without any movement. For measuring total absorbent capacity, a syringe was connected with water reservoir through water flow rate controller knob and it was positioned 6 mm above the surface of the fabric. 40 µL of water was allowed to fall on the fabric continuously for every 2 s till the fabric reached its saturation point. Water flow rate was controlled with the help of water flow rate controller knob. For measuring the rate of absorbency
Calibration
Before starting the new test, the position of the camera height from the fabric stand was calibrated. For this a black solid circle (20 mm diameter) was drawn on a white paper and it was placed over the embroidery ring where the camera captures the image.
Total area of 20 mm diameter solid circle in mm2
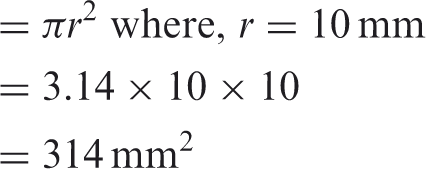
The captured image was transferred into Photoshop and the image resolution was changed into10 pixels/cm. Then the area of circle (as per the procedure mentioned below) was found in terms of pixels. The total pixels were compared with calculated value (314 mm2), when it did not match with the result, the camera height was adjusted and a new image snap was taken. This process was repeated until the Photoshop method result matched with the calculated result.
Area calculation
As shown in Figure 3, the required raw image is opened to find the area in commercial image processing software Photoshop. The image quality is adjusted by correcting brightness and contrast (Image menu – Adjustment option). The unwanted areas are removed by cropping the image using crop tool. The image is calibrated by changing the image resolution value into 10 pixels/cm. The darken pixels (water spread area) are selected using magic wand selection tool with the help of tolerance property. The magic wand selection tool from the tool box is taken and clicked over the water spread area and then grow option is used from select menu for further exact selection of water spread area. After exact selection of water spread area, histogram option is used from window menu to know the number of pixels in the selected area, i.e. water spread area in mm2. This method took less than 3 min to measure water spread area in mm2 for each sample.
Method III: Measuring water spreading behaviour on the fabric by EIAS
Apparatus description
Basic instrument setup procedure is same as method II (Photoshop method). Instead of image processing setup, the new instrument was developed with embedded coding in digital signal processor (DSP) with MATLAB tool (EIAS).
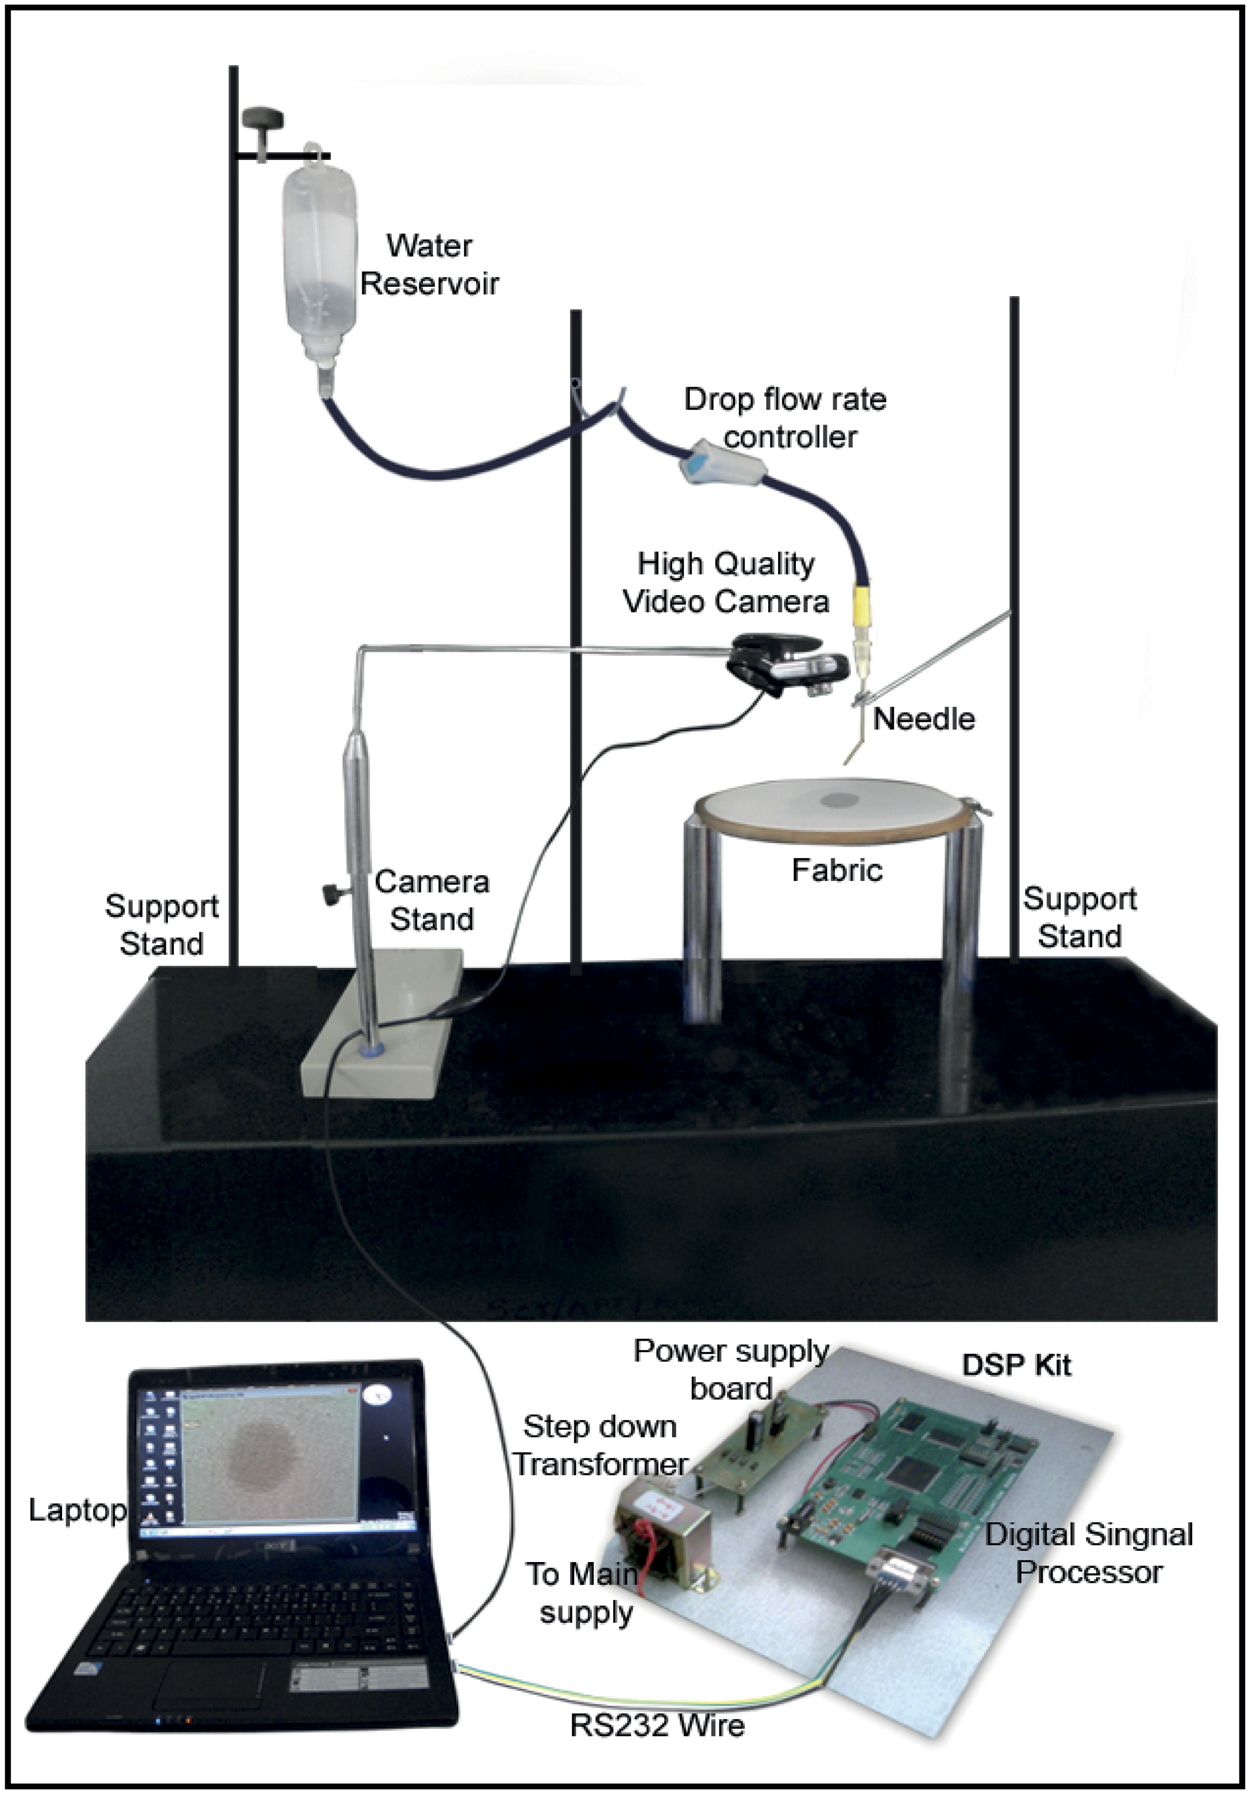
As shown in Figure 4, the DSP kit is connected via RS232 in to the USP port. The DSP kit receives main supply and this power supply is reduced into 12 V using step down transformer. The developed software through MATLAB is capable of adjusting to record number of frames per second. The software has the provision to change interval time (seconds) of image capture. For each sample, the recording is started approximately 1 s before drop falling. This is for the purpose of taking reference frame.
From the experimental system (Figure 4), the captured videos are transferred and stored simultaneously in the computer. The stored videos are converted into individual frames using MATLAB coding. Individual frames are transferred into embedded Blackfin ADSP-BF532 DSP kit through RS-232 cable. Using background subtraction algorithm (Figure 5) the processor will subtract reference frame with successive frame and the resulting output image is the difference image. The difference image is the binary image, which is obtained by thresholding. The area of spreading is calculated based on the number of the white pixels for each successive frame.
The thresholding process may vary depending on the lighting conditions, so there should be constant lighting conditions. The final calculated areas are sent back to computer for plotting the graph with the help of MATLAB software. This method took less than a minute to measure water spread area in mm2 for each sample.
EIAS method is used to measure the transverse wicking area in each and every second, i.e. continuous measurement and similar to the Photoshop method images can be captured continuously with a fixed delay. Due to continuous measurement both the method can be referred to as dynamic method.
Results and discussion
Rate of absorbency test
Measured liquid spreading area in mm2 in three methods.
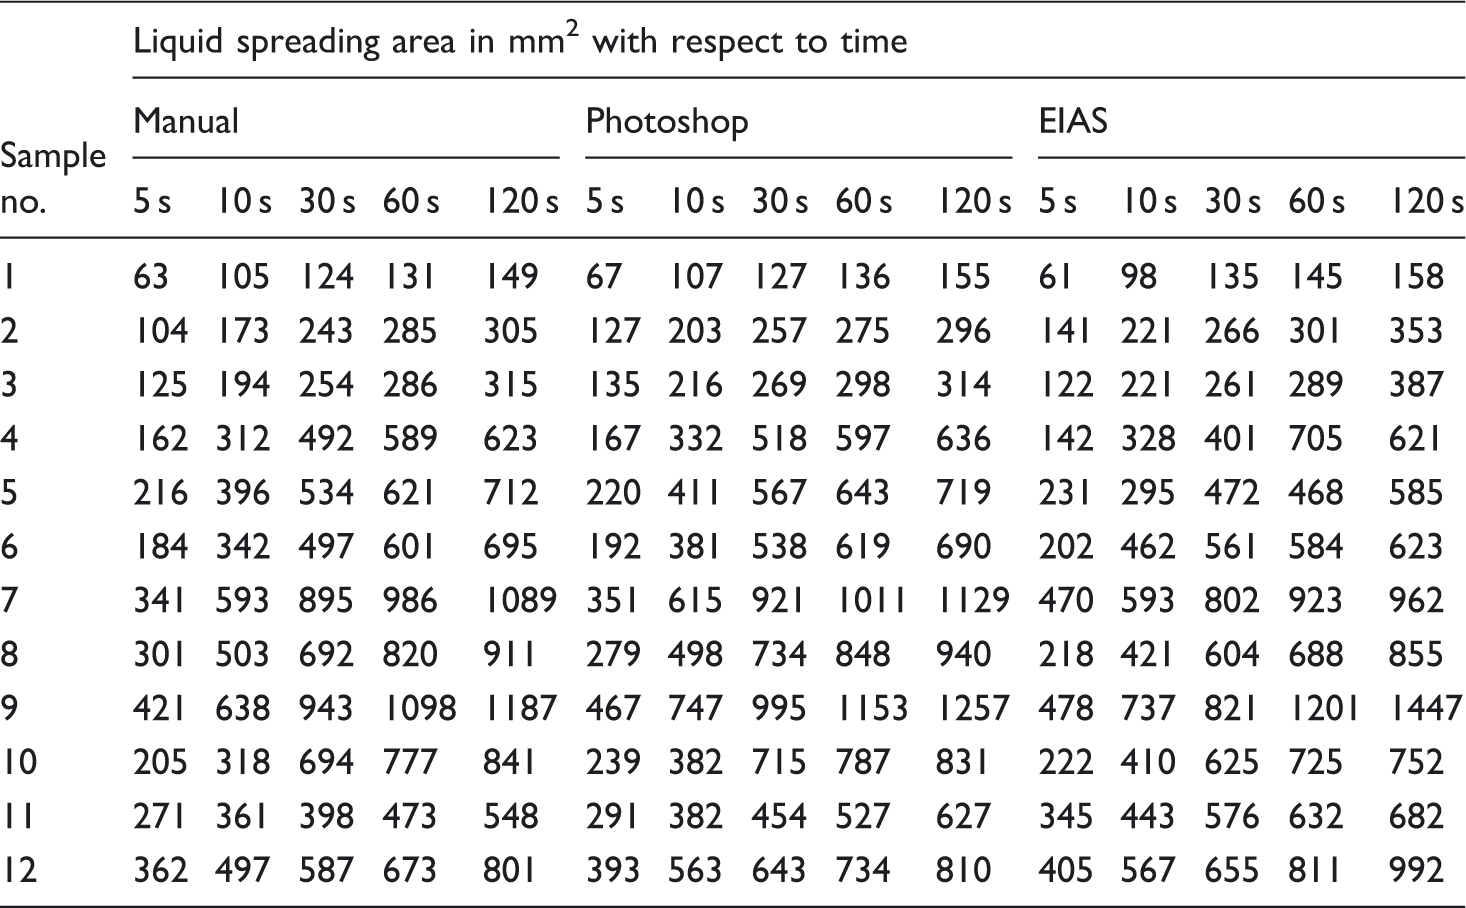
Rate of absorbency measured in three methods.

Three test methods correlation coefficient value.
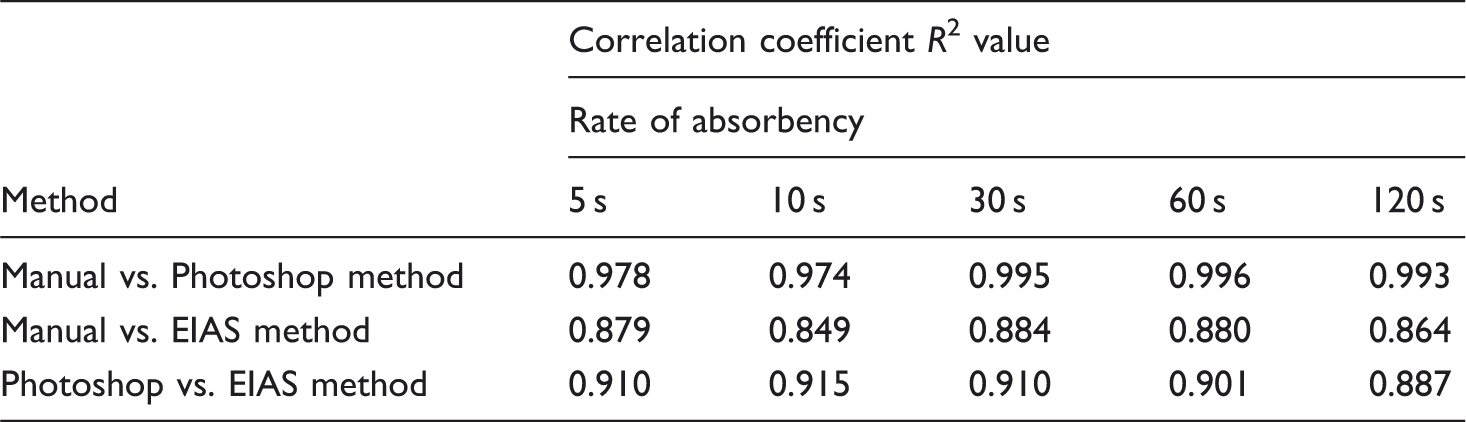
For manual and EIAS methods the correlation coefficient R2 was 0.879, 0.849, 0.884, 0.88 and 0.864 for rate of absorbency at 5, 10, 30, 60, 120 s, respectively. The dynamic transverse liquid spreading measurements done by the EIAS are also in parallel with the manual transverse spreading method.
Similarly, between Photoshop and EIAS methods the correlation coefficient R2 was 0.910, 0.915, 0.901 and 0.887 for rate of absorbency at 5, 10, 30, 60, 120 s, respectively. The dynamic transverse liquid spreading measurements done by the Photoshop are also in parallel with the EIAS transverse spreading method.
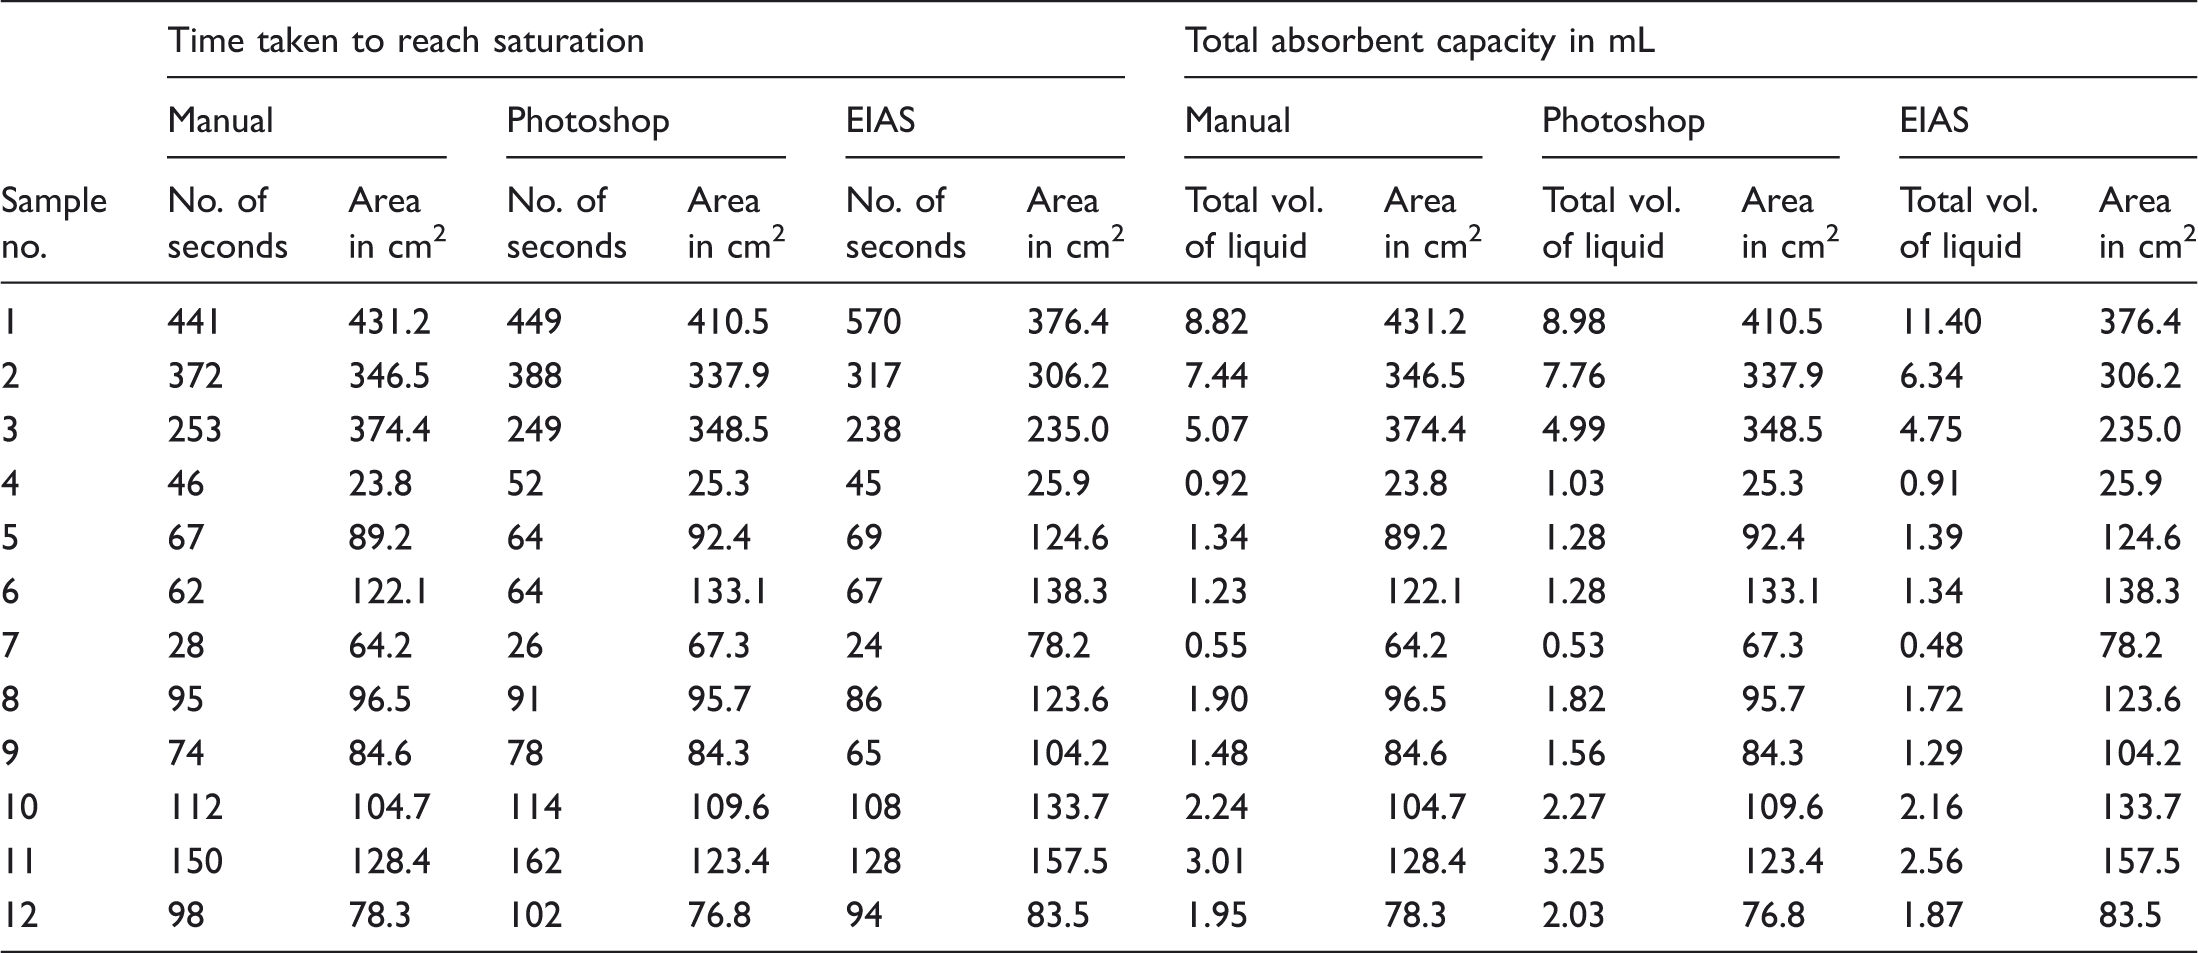
Total absorbent capacity
Time taken to reach saturation and total absorbent capacity measured in three methods.
The graph shown in Figure 6 compares the volume of water in mL absorbed per unit volume of fabric (mL/mm3) in all the three methods. Manual and Photoshop method results are well correlated than the EIAS method. The results are obtained from total volume of water absorbed in mL with respect to saturation point area in cm2 (from Table 6). Fabric volume in mm3 was calculated by multiplying saturation point area in mm2 with fabric thickness in mm.
Comparison of fabric absorbent capacity in ‘volume of water (in mL) absorbed per unit volume of the fabric’ (mL/mm3).
Three test methods correlation coefficient value.

For manual and EIAS method the correlation coefficient R2 was 0.934 for the total absorbent capacity measurement and correlation coefficient R2 was 0.916 for the total area to reach saturation results. The total absorbent capacity measurements done by the EIAS are in parallel with the manual method.
Similarly, between the Photoshop and EIAS method the correlation coefficient R2 was 0.937 for the total absorbent capacity measurement and correlation coefficient R2 was 0.928 for the total area to reach saturation results. The total absorbent capacity measurements done by the Photoshop are in parallel with the EIAS method.
Conclusion
Three test methods namely manual, commercial image analysis method using Photoshop software, embedded image analysis system using digital signal processor methods were described. The commercial image analysis method using Photoshop and EIAS method can be used to measure the rate of absorbency and total absorbent capacity of the fabric objectively. When compared to commercial analysis method, the EIAS method takes less time for testing because of fully automatic calculation through MATLAB coding with DSP. Three test methods were compared for its rate of absorbency and total absorbency statistically. A good correlation (more than 0.9) was found between manual and commercial image analysis method. Commercial image analysis test result has shown good correlation with manual method as compared with manual versus EIAS method. Also Photoshop versus EIAS method correlation was found better than manual versus EIAS method
Footnotes
Acknowledgements
We thank the management of Sona College of Technology, Salem for their valuable suggestions and providing necessary facilities for carrying out this research work.
Funding
This research received no specific grant from any funding agency in the public, commercial, or not-for-profit sectors.