
Abstract
The dynamic sweat transfer tester for analyzing the sweat transfer behavior of multi-weave structure fabrics (single fabric contains different weave structures) has been designed and developed. This instrument has been developed to evaluate the sweat transfer rate in 16 different directions and 48 different regions for a test specimen of 7 cm diameter. The concept of the sweat measurement is to measure the sweat transport time required to reach the unit area of the fabric. The instrument works under the principle of electrical conductivity, that is, wetted cotton fabric acts as an electrical conductor between the power connected (5 V) copper pins and ground connected copper pins. The unique feature of this instrument is that the sweat transfer rate can be measured in fabrics which have irregular spreading behavior (single fabric that has different weave structures) at one step. Twelve different woven fabrics have been analyzed for the sweat transfer behavior using the instrument, and the results were well correlated (R2 = 0.925) with manual test method.
Keywords
Introduction
Sweat is a great cooling system. Human body works well when its temperature is about 98.6° F (37°C). When our body gets hotter than that, the brain does not like it—it wants the body to stay cool and comfortable. The part of the brain that controls temperature is called the hypothalamus, and it sends a message to the body, telling it to sweat. Then, there are special glands in the skin called the sweat glands which induce sweat [1]. During strenuous body activity, the wearer perspires and the cloth worn next to skin will get wet. Sports and leisure wears exert a barrier for efficient transfer of excess heat resulting in a rise in core body temperature and skin temperature >37°C which increases sweating [2]. To keep dry and comfortable, clothing has to be able to deal with the sweat (perspiration) produced during different activities. There are two main properties of clothing, which affect the handling of moisture. The first factor is the easiness with which the clothing allows the perspiration to be evaporated from the skin surface during the activity. Second, after the activity has ceased, there is a need for the moisture that is contained in the clothing layer next to the skin to dry out quickly. This ensures that the wearer does not lose heat unnecessarily through having a wet skin [3,4].
The garments we wear perform an important role in sweat evaporation from the skin. Fabric that is used to produce the garment should have good moisture management properties (i.e. sweat absorption capacity, transfer rate, and sweat evaporation capacity). Different instruments have been developed to test the sweat absorbency behavior of the fabric.
The in-plane wicking behavior of single layers can be assessed visually using different methods [5,6].
As per AATCC 198 [7], horizontal or transverse wicking is the ability of horizontally aligned fabric specimens to transport liquid along and/or through them by capillary action.
Sampath et al. [8] stated that the analysis of transverse wicking characteristics of the fabric is as important as longitudinal wicking, because the perspiration (sweat) transfer from skin involves its movement through the lateral direction of the fabric. One of the advantages of these assessments is that, as transverse wicking being multi-directional, it eliminates the directional effect and the results are most effective for developing sportswear.
Hence, the objective measurement of the moisture management properties of clothing is important to apparel products. General transverse wicking is measured using AATCC 195-2010 and AATCC 198-2011. As per AATCC 198, there are two parameters most commonly used to characterize the properties of liquid moisture management performance of fabrics, which are the rate of absorbency and the total absorbent capacity.
Kissa [9] measured the spreading area of a drop on textile fabric as a function of time. The area of a spreading liquid was photographed at uniform time intervals with an instant picture camera. The area depicting the spreading liquid was cut out from the dried photograph and weighed.
Ramesh Babu and Koushik [10] have developed an apparatus that uses a technique based on electrical open and close circuit principle to measure the vertical capillary height of the liquid in the woven fabric as a function of time.
Another apparatus has been developed by Ito and Muraoka [11] based on the principle of electrical capacitance to test liquid flow in vertical direction through bulk fibers. The di-electric constant of the fiber will vary when water traverses through the sample. The change in di-electric constant is monitored continuously. Based on the changes, the vertical wicking behavior of the bulk fiber and yarn sample can be predicted.
A similar instrument has been developed by Petrulyte and Baltakyte [12] to measure the in-plane flow of fluids in woven structure. They have used an image analysis technique to obtain the shape and position of a radially advancing fluid front, which can define the directional permeability in the plane for testing terry woven fabrics.
Wardman and Abdrabbo [13] used the image analysis technique to study the effect of oxygen plasma treatment on two polyester fibre types, polylactic acid and standard polyester, and its influence on their respective wetting characteristics. The area of water spread on plasma treated fabric was measured through the tool “Free Hand” of the software measurement tools package.
Fangueiro et al. [14] described another apparatus to evaluate the horizontal wicking rate. They evaluated horizontal wicking rate by recording the water mass absorbed per unit of fabric thickness through electronic balance.
Different studies have analyzed the (transplanar) water transport between the layers of a multi-layer fabric using gravimetric methods [15–21]. Zhuang et al. [22] analyzed the water transport between knitted fabrics subjected to an external pressure. With increasing pressure, the liquid water transfer rose because of the higher contact area between the two layers. Above a critical pressure, however, the water transport decreased due to the lack of void space in the dry fabric. All these gravimetric methods have the common disadvantage that for every measurement, the system has to be separated into its single components, which might lead to additional evaporation of moisture during the manipulation of the samples and to subsequent weight measurement inaccuracies.
Li et al. [23] developed moisture management tester based on the change of the electrical resistance of the fabric with its water content. It consists of six concentric rings (sensors) of varying sizes. The rings are placed on the top and bottom surface of the fabric to predict the moisture management properties at both surfaces. The distance between two consecutive rings is 5 mm, and the first ring is placed at 1.5 mm from the center of the fabric sample. The test time is 120 s, and the water inlet is 0.01 g/s. The resistance between the two consecutive rings is monitored continuously by the instrument. Based on the variation in resistance, the result is obtained. The proposed sweat transfer tester is able to measure liquid spreading behavior of irregular spread behavior fabric, that is, multi-weave structure fabrics. In addition, it measures liquid spreading behavior in both radial path and elliptical path (particularly in knitted fabric, the spreading is more in wale wise than course wise).
In our earlier work [24], the comparison between three test methods was carried out, to measure the water spreading behavior of textiles such as rate of absorbency and total absorbent capacity. The methods described are manual method, commercial image analysis method using Photoshop and embedded image analysis method using digital signal processor through MATLAB software (EIAS). In addition, the effects of short interval dynamic extension and recovery on fabric transverse wicking behavior, as the samples were subjected to different rate of extension (speed), different level of cyclic extension and different rates of liquid flow [25] were examined.
Transverse wicking behavior of the fabrics was analyzed using various test methods. The test methods were used to test single weave fabrics. So far, the fabrics that contained combination of different or multi-weave structures were not studied. The study is important because the change in thread density or number of binding points per unit area influenced the wicking behavior of the fabrics. This is also considered in this study.
In this paper, a new sweat transfer tester has been designed and developed for analyzing transverse wicking behavior of single fabric which contains different woven structures.
With this instrument, the rate of (time per unit of area) sweat traveling through a fabric specimen is measured on the principle of electrical conductivity. Transverse wicking behavior in different woven fabrics is analyzed. This will help to evaluate the transverse wicking behavior of multi-designed woven fabrics.
Design of sweat transfer tester
Concept
A block diagram of the working principle of dynamic sweat transfer tester is shown in Figure 1. This instrument is used to measure the dynamic sweat transfer behavior of a fabric in all 360° direction. The fabric to be tested is placed over the copper pin in the copper board.
Block diagram of sweat transfer tester for measuring transverse wicking behavior of fabrics.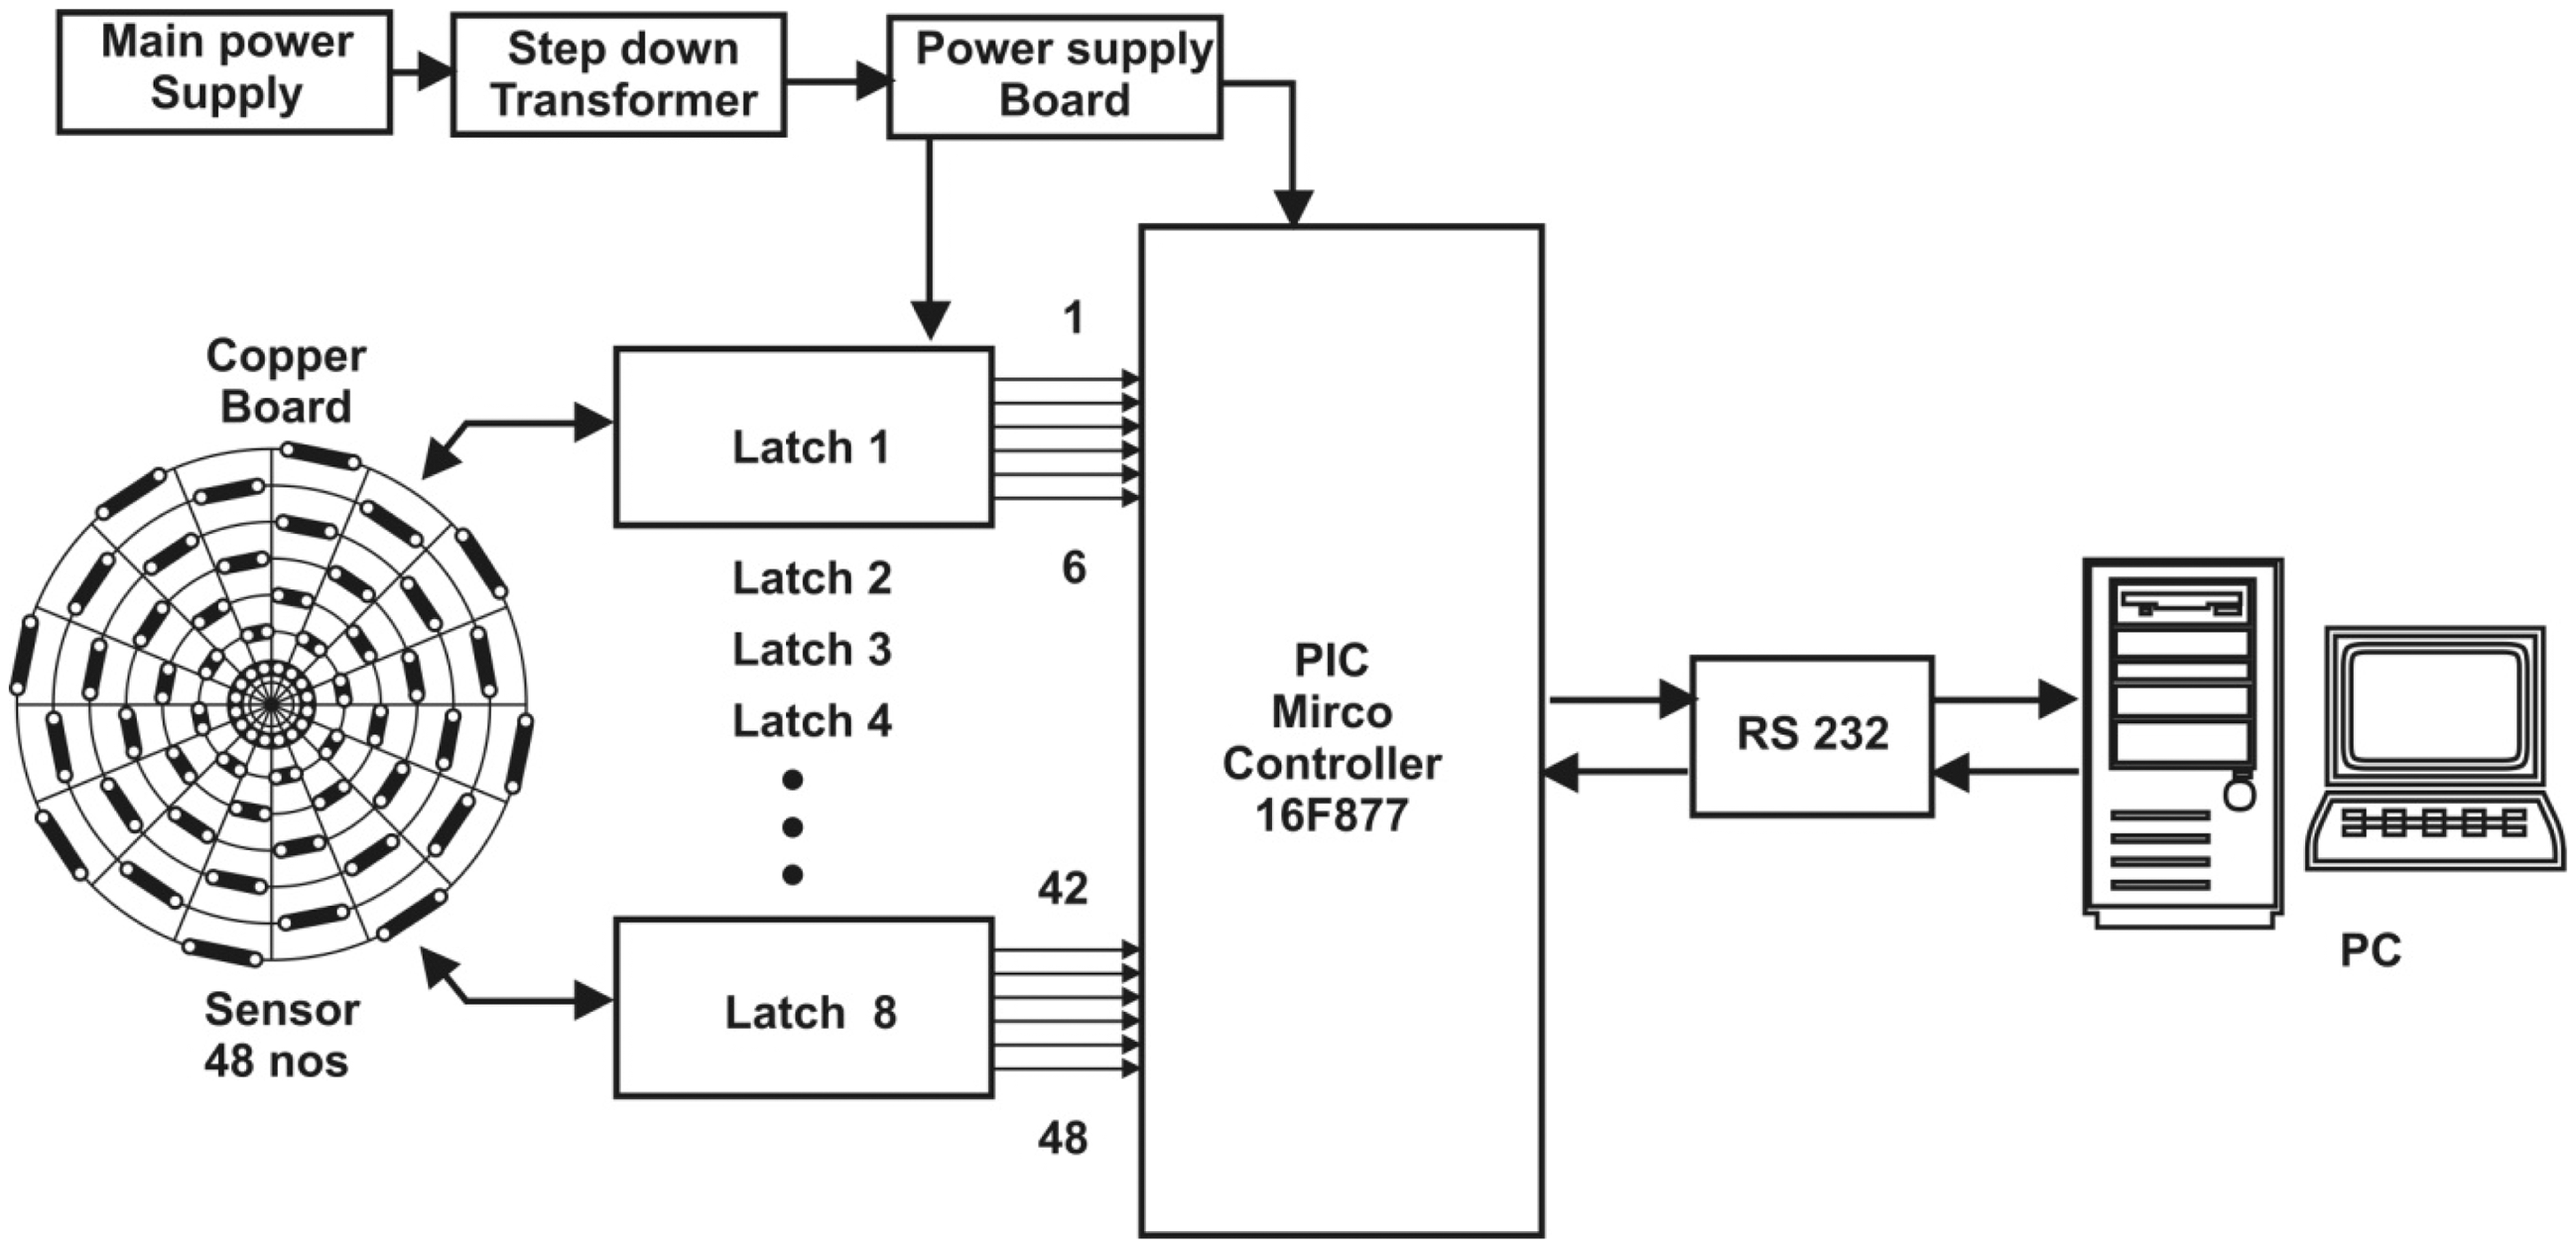
A 48 high-sensitive sensor (copper pin) is used to measure the sweat transfer rate (time per unit of area) in the fabric which is placed in the copper pin board. A step down transformer is used to convert 230 V AC to 5 V AC for the power supply board, consisting of four diode bridge rectifiers to convert AC to DC, as well as 1000 and 10 μF capacitors for filtering purposes.
The power supply board supplies 5 V DC to a PIC16F877 microcontroller and latch board. Microcontroller is a general purpose device, which integrates a number of the components of a microprocessor system on to a single chip. The sensor (copper pin) is interfaced with the microcontroller through latch circuit. In each latch circuit, six sensors are connected, and totally eight latch circuits are used. The microcontroller monitors the voltage of the entire respective sensor (copper pins) and it receives the signal from each sensor, once the sensor deducts the sweat. Microcontroller sends this voltage change information to a computer through serial communication protocol RS232. The data values stored in the computer are converted into sweat transfer rate and displayed in a graphical format using dedicated Lab VIEW-based Dynamic sweat transfer measurement software (Figure 2).
Sweat transfer tester.
Description of copper board
In a sweat transfer tester, the copper board is designed for placing 48 sensors in 16 different directions each with a variation of 22.5° angle, and three copper pins are placed in each direction at 10 mm interval to find the transfer rate of sweat through fabric. The maximum measurement area size is 70 mm diameter. The number of sensors in each circle is eight, and the area covered by each sensor is shown in Figure 3.
Description of copper board.
The developed sweat transfer tester will give reliable results for multi-weave structure fabrics. At the same time, the distance between the copper pins and its located angle in the circuit will influence the test results.
Calculation of area covered by first sensor
The first sensor fixed in the second circle as shown in Figure 3. Diameter of the second circle is 20 mm, and total area covered in mm2 is 314 mm2 (πr2 = 3.14 × 10 × 10). Also, area covered by 10 mm diameter first circle is 78.5 mm2 (this point is the start point of sweat measurement). Actual area of second circle is (314−78.5) = 235.5 mm2. Also, second circle is divided in 16 equal parts. Then, area covered by first sensor is 235.5/16 = 15 mm2. In a similar way, all the sensor areas have been calculated.
Experimental part
In Figure 4, the power supply of 5 V is given to each copper pin through latch circuit and microcontroller unit. The microcontroller continuously monitors the 5 V power at each copper pin. The pins that are connected to the ground are situated 3 mm from the center of the board or fabric. The initiating copper pins are situated at 5 mm from the center of the board or fabric. In the initial stage (i.e. without introducing sweat), there is no change in the supply voltage (5 V) of the measuring copper pin.
Sweat transfer measurement.
When the sweat is introduced in the center of fabric (copper board) through a syringe, then the sweat absorbed by the fabric spreads in all directions. First, the sweat crosses the ground pin, the initiating copper pin, and finally, the measuring copper pin. The timer will start when the sweat reaches the initiating copper pins. After that the REACH TIME (time taken by the sweat to reach from initiating copper pin to measuring pin) of each measuring copper pin can be noted through PC and the Lab VIEW software with the help of the microcontroller. The measuring copper pin will get electrical conductivity signal (i.e. voltage change in the measuring copper pin) through the ground supply pin, once the sweat reaches the measuring copper pin. Similarly, the REACH TIME of 48 different position sensors (copper pin) can be noted and stored through Lab VIEW software as shown in Figure 5. Once the sweat reaches all the sensors, in the fabric, the software starts to calculate the sweat traverse rate in mm2/10 s.
Lab VIEW software—front page.
Then, the sweat traverse rate of the sensors (copper pins) in each direction can be calculated by the following formula:

At first the traverse rate is taken in mm2/s to make the standard data and to enlarge the difference in traverse rate. The result is multiplied by 10, which will give the result as the sweat traverse rate in mm2/10 s.
Materials and methods
Fabric particulars.

The image of a single fabric containing different woven structure samples (sample no. 10, 11, 12, and 6) is shown as a, b, c, and d, respectively, in Figure 6.
Images of different fabrics produced with multiple weave structure.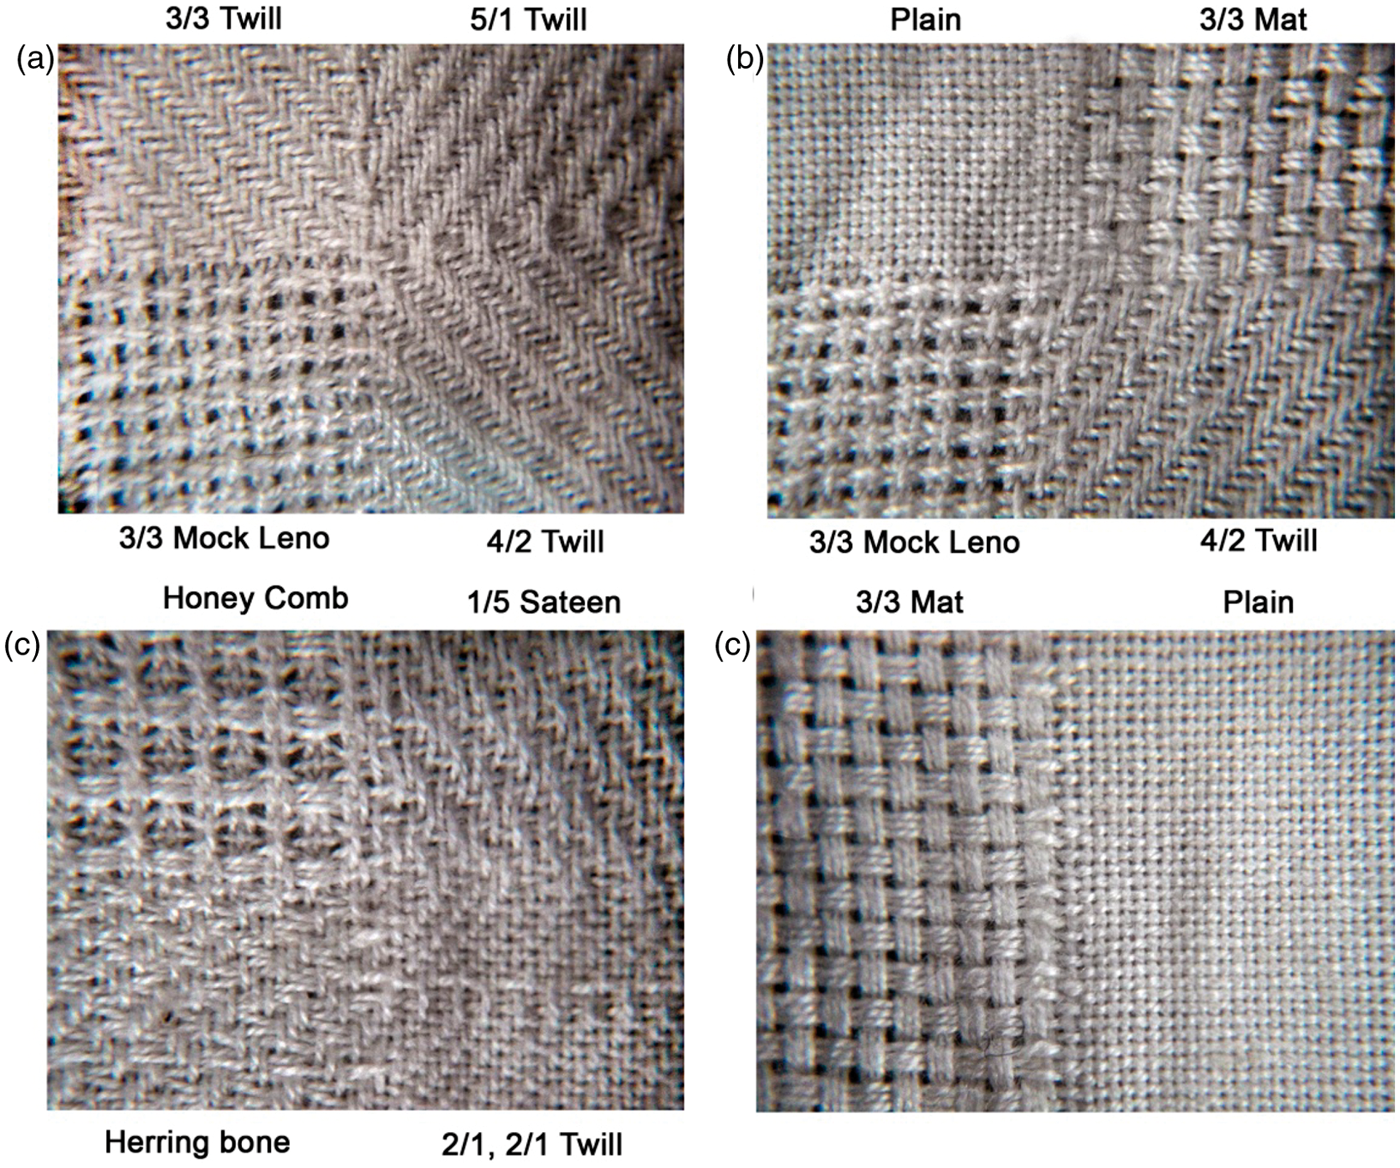
Test methods
Sweat transfer rate measurement using electrical conductivity method
A sample with a size of 15 × 15 cm was prepared and placed at the tip of a copper pin in the copper board. For effective contact between the surface of the fabric and copper pin, clips were used on all sides. Synthetic sweat was prepared (Ref. AATCC Test Method 125-2004) and stored in the reservoir. The sweat was introduced at the center of the fabric through a syringe from the sweat reservoir. The number of sweat drops per second that fell on the fabric was adjusted as 1 drop/s by controlling the flow rate using controller knob. When the fabric was wetted by the sweat, the sweat started spreading through the fabric. When the sweat reached the respective area of the copper pins, then the REACH TIME of that sensor (i.e. time required by the sweat to reach the unit area of the fabric (time/unit area)) was recorded using computer.
Measuring maximum wetting time
The fabric was divided into 16 different angles. Each direction had three sensors with 1 cm interval. The cumulative time required by the sweat to reach the last sensor in a direction was taken as the maximum wetting time.
Measuring sweat transfer rate in multi-weave structure in a single fabric at one step
The unique feature of this instrument is that it measures sweat transfer rate of different woven structures in a single fabric (as shown in Figure 7(a) and (b)). The method of measurement is described below.
Way of grouping sensors for testing different woven structures in a single fabric.
While testing such a fabric, grouping of sensors has to be done, that is, for two different woven structures in warp direction, sensors present in half a circle (angle 112.5–270°) of the board are grouped as one section and the other half circle (angle 292.5–90°) sensors are grouped as another section. It has been programmed in the Lab VIEW software. Similarly, for four multi-weave structure fabrics, sensors present in each quarter are grouped for measuring sweat rate in mm2/10 s. The selection of the fabric type has to be fed to the software manually.
Sweat transfer rate measurement using manual video analysis test method
Sample size of 15 × 15 cm was taken and marked (in 48 different positions) through pen similar to the design of the copper board. The fabric was fixed on an embroidery ring. The sweat was introduced at the center of the fabric through syringe from the sweat reservoir. The number of sweat drops per second that fell on the fabric was adjusted as 1 drop/s through a flow rate controller. Using a high-quality camera, the sweat spreading process till the sweat reach the last marking position in the maximum area of 3846.5 mm2 (70 mm diameter) was recorded and analyzed by opening the video in the computer. The timer was used to note the time taken for the sweat to spread from the initial position to each marking in the fabric in all directions. From the noted time and area of each marking, the sweat transfer rate in mm2/s can be calculated.
Result and discussion
Measuring sweat transverse rate in electrical conductivity method using 48 sensors through the Lab VIEW software
Sweat transfer rate of each sensors.

Finding maximum wetting time
Maximum wetting time and sweat transfer rate in each direction of different angle.

Sweat transfer rate measured in electrical conductivity method.

Sweat transfer rate measured in manual video analysis method
Sweat transfer rate measured in manual video analysis method.
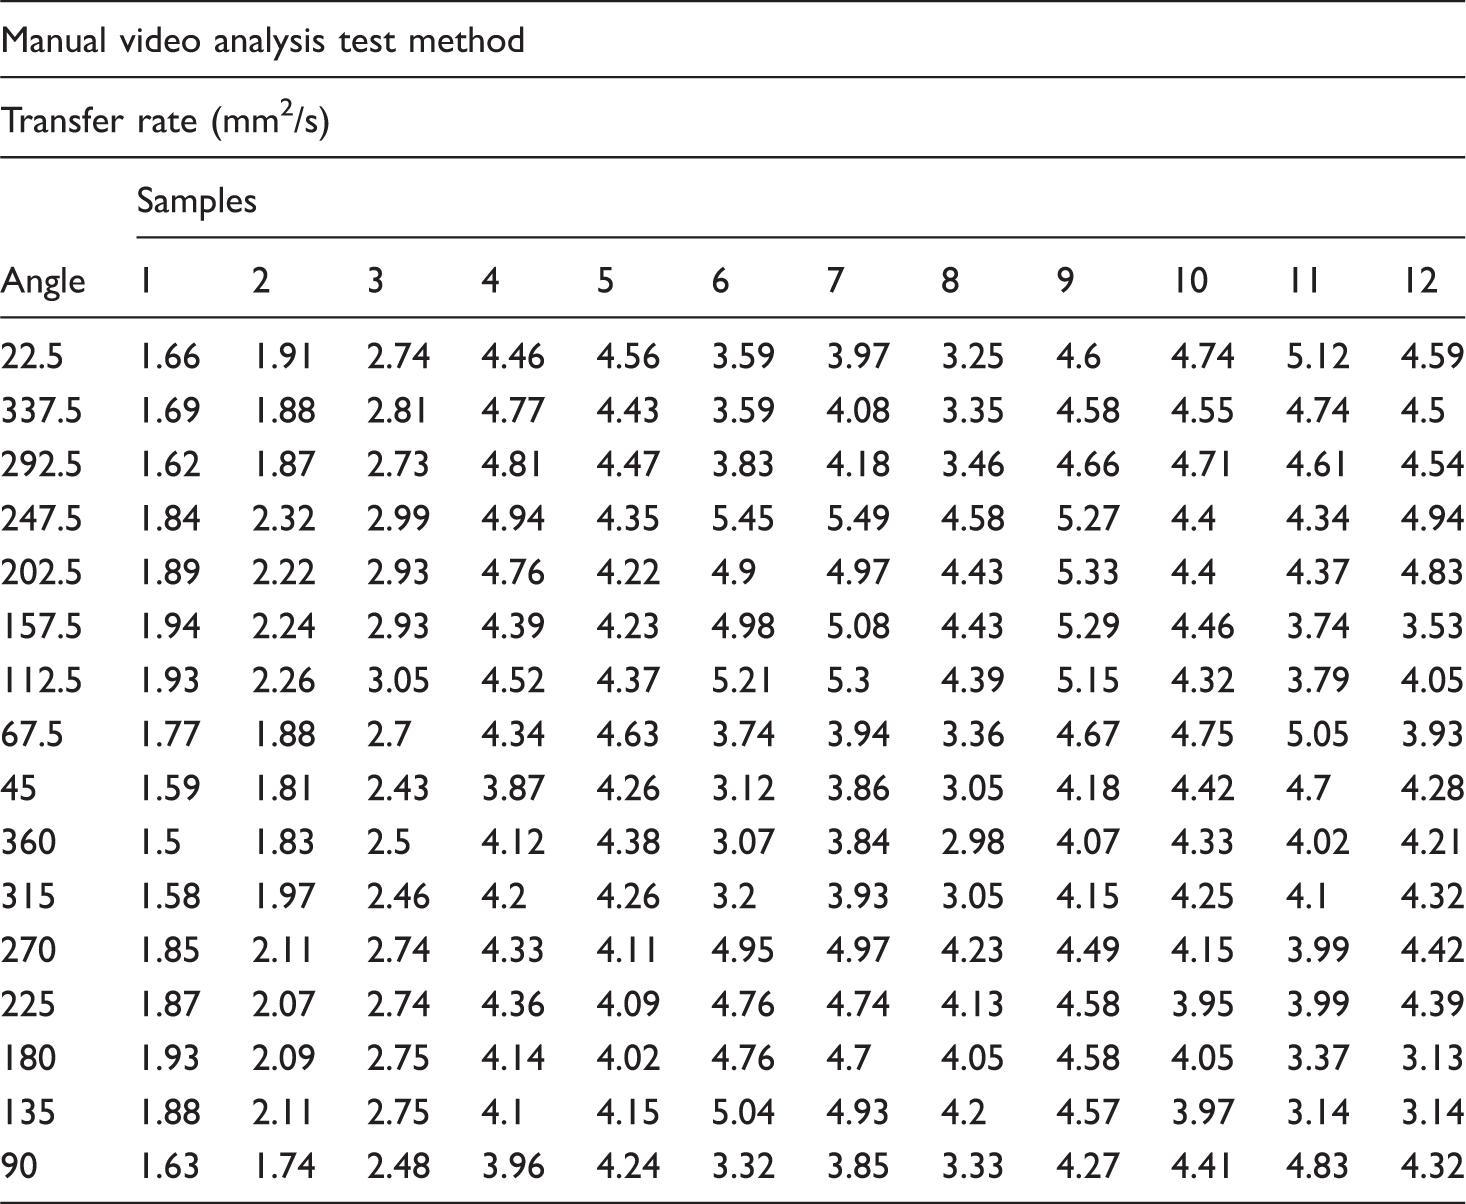
For evaluating the reliability of electrical conductivity test method, correlation coefficient R2 between manual and electrical conductivity methods has been done.
The Pearson correlation coefficient r2 is 0.925. Thus, the dynamic sweat transfer measurement done by electrical conductivity method is in parallel with the manual sweat transfer measurement.
Measuring two or more different weaves in a single fabric sweat transfer behavior at one step
In addition to measuring sweat transfer rate of different fabrics, it is possible to find spreading behavior of multi-weave structure fabrics (i.e. single fabric contains multiple weaves).
Sweat transfer behavior of two weave fabrics
Individual weave structure sweat transfer rate.

The liquid spreading rates are primarily affected by the manner and rate at which liquid migrates from yarn to yarn. According to Figure 8 it can be stated that, the sweat transfer rate of Mat structure is higher than that of plain weave. The main reason for higher sweat transfer rate of Mat structure is that it contains higher floats than plain weave (all other properties are same for both fabric, i.e. count of warp and weft, ends per centimeter, and picks per centimeter) which creates more air space, resulting in maximum absorption rate, spreading speed, and higher sweat transfer rate than plain weave.
Sweat transfer behavior of four weave fabrics
Individual weave structure sweat transfer rate by grouping the sensors.

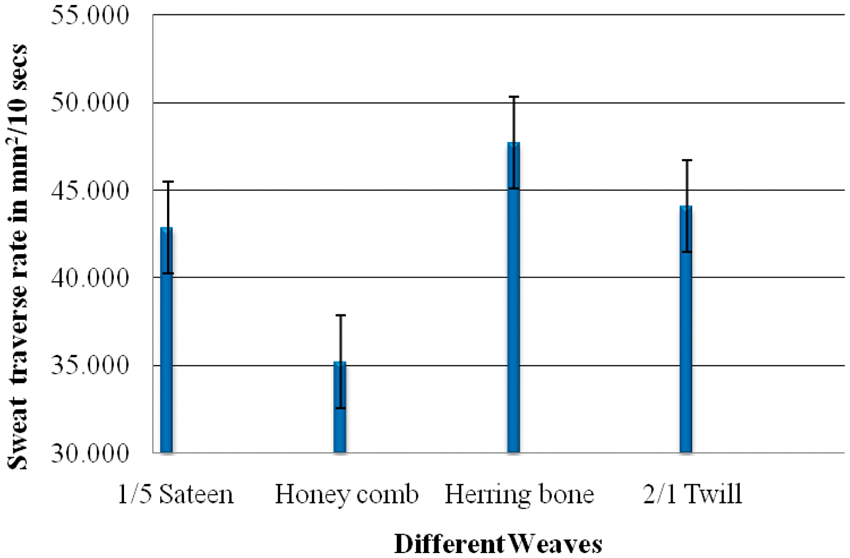
Sweat transfer behavior illustrated in Figures 9 to 11 for samples 10, 11, and 12 indicates that the weaves which have more floats show higher sweat transfer behavior. The reason for different level of floats in the fabric is due to changing the order of interlacement (different weaves) between warp and weft threads. All the other parameters were kept constant, that is, count, ends per centimeter, and picks per centimeter. Figure 9 shows the sweat transfer behavior of four different weaves (5/1 Twill, 3/3 Twill, 3/3 Mock leno, and 4/2 Twill). It is apparent that the 5/1 Twill sweat transfer rate is higher in these fabrics in comparison with other three weaves because of more floats in the fabrics. Floats create more air space in the fabric resulting in maximum absorption rate, spreading speed, and higher sweat transfer rate. A similar trend was observed by Ramesh Babu et al. [26]. The absorption and spreading of water on any material increase when the resistances to water flow are low. Another reason for higher sweat transfer rate in 5/1 Twill weave fabric is its thickness compared with other three weaves. The fabric that has less thickness exhibits more spreading speed than that of thicker fabric. Similarly in Figures 10 and 11, the weaves 3/3 Mat and Herring bone show a higher sweat transfer rate than their individual weaves in the group. The reason for higher sweat transfer behavior is same as mentioned earlier (i.e. more floats in the structure). On the other hand, sweat transfer is less in weaves having lower floats in the individual weaves in the group (3/3 Twill, Plain, and Honeycomb). Fabric thickness also plays an important role. Thus, the sweat transfer instrument results are well correlated with existing results and manual video analysis test results.
Sweat transfer behavior of Mat and Plain weaves. The left half (direction 9–16) of Figure 8 shows the transfer rate of Mat weave, whereas the right half (direction 1–8) shows for Plain weave. Sweat transfer rate in mm2/10 s is depicted in red color (Color figure available online). Sweat transfer behavior of sample 10. Sweat transfer behavior of sample 11. Sweat transfer behavior of sample 12.


Conclusion
The objective of this work was to develop a new test method, which can be used to measure sweat transfer rate of multi-weave structure fabrics. With this new tester, we can measure dynamic sweat (perspiration) transfer behavior of different woven structures in a single fabric (i.e. weaves with different spreading behavior) at one step. Twelve different woven fabrics were tested with the developed instrument, and the results were found to be well correlated (R2 more than 0.925) with the manual video analysis method of measurement. The new tester will help to evaluate the transverse wicking behavior of woven fabric with multi‐weave structure fabrics.
Footnotes
Funding
This research received no specific grant from any funding agency in the public, commercial, or not-for-profit sectors.