
Abstract
Objective:
To develop and validate a deep learning-based segmentation method for accurate identification of fenestration markers and graft body contours in intraoperative fluoroscopic images during fenestrated endovascular aortic repair (FEVAR).
Methods:
A total of 500 intraoperative fluoroscopic images from 31 FEVAR procedures were manually annotated for fenestration markers and graft body contours. Using nnU-Net, a self-configuring deep learning framework, we developed SIGMA (
Results:
In the test data set, SIGMA achieved a median Euclidean distance of 0.16 mm for fenestration marker localization, with sensitivity and specificity of 91.0% and 90.2%, respectively. The mean DSC was 79.5% for fenestration markers and 96.6% for graft body contours. Overall, the model demonstrated robust performance across data sets for both localization and segmentation tasks.
Conclusion:
This study demonstrates the feasibility of deep learning-based segmentation for real-time intraoperative analysis during FEVAR. Accurate identification of fenestration markers and graft body contours provides a foundation for advanced tools that can calculate fenestration angles and graft orientation from 2D fluoroscopy, offering practical, cost-effective intraoperative guidance.
Clinical Impact
The SIGMA deep learning segmentation model enables accurate identification of fenestration markers and graft body contours in intraoperative fluoroscopic images during FEVAR. This technology lays the foundation for real-time calculation of graft orientation and fenestration angles. By leveraging standard 2D fluoroscopy, SIGMA supports the development of intelligent overlay tools that enhance intraoperative precision, reduce cognitive workload, and improve procedural efficiency. With further refinement and integration, these tools may standardize outcomes across operators and institutions, offering a practical, scalable solution for improving accuracy in complex aortic interventions.
Keywords
Introduction
Fenestrated endovascular aortic repair (FEVAR) is a complex intervention used to treat aortic aneurysms involving the visceral and renal arteries.1,2 Unlike standard endovascular aneurysm repair (EVAR), FEVAR requires precise alignment of graft fenestrations with target branch vessels to maintain perfusion, resulting in significantly higher procedural demands. Its success relies heavily on intraoperative fluoroscopic imaging to guide graft positioning and deployment. However, the intricacy of FEVAR often leads to longer operative times, increased radiation and contrast exposure, and difficulty achieving accurate alignment—especially in patients with anatomical variability.3,4
Although hybrid operating rooms are equipped with advanced imaging systems, current intraoperative workflows depend largely on manual interpretation of fluoroscopic images. 5 The operator must identify fenestration markers and graft contours by eye and align them with branch vessels, a process that is both labor-intensive and susceptible to human error.4,5 In addition, the large volume of fluoroscopic data generated during these procedures is rarely leveraged to its full potential, representing a missed opportunity to improve intraoperative decision-making and procedural efficiency.
Artificial intelligence (AI) has emerged as a powerful tool in medical imaging, with the ability to automate complex analysis tasks and produce consistent, reproducible outputs. 6 Deep learning methods are particularly well-suited to this domain, as they can detect intricate patterns within large data sets—making them ideal candidates for use in FEVAR.7,8 Integrating AI into intraoperative workflows may reduce the cognitive burden on clinicians, enhance precision, and limit radiation exposure for both patients and their health care team.
In the present study, we sought to develop and validate a deep learning-based segmentation method capable of identifying 2 critical features in intraoperative fluoroscopic images during FEVAR: fenestration markers and graft body contours. Accurate identification of these structures is essential for enabling downstream computational tools that aim to extract quantitative information—such as fenestration angles and graft orientation—from otherwise qualitative imaging data. Fluoroscopic images generated during FEVAR are often visually complex, with overlapping devices, patient-specific anatomical variability, and contrast limitations that obscure key features. As such, any automated approach must be able to reliably detect small, high-value targets against a noisy background. By focusing on segmentation of both the graft outline and fenestration markers, this work aims to establish a foundational step toward future systems that use standard 2-dimensional (2D) fluoroscopy to deliver intraoperative decision support, procedural guidance, and real-time geometric analysis in complex endovascular interventions. Ultimately, such tools have the potential to streamline workflows and make advanced image-based guidance more widely accessible across varied surgical settings. 9
Methods
Data Set Collection and Annotation
We collected 500 intraoperative fluoroscopic images from 31 patients who underwent FEVAR between November 2015 and November 2016. For each case, fluoroscopy was captured throughout the procedure, and frames were sampled across multiple procedural stages (including device introduction, intermediate deployment steps, and final balloon molding). This sampling strategy was chosen to capture a broad range of graft configurations, projections, and intraoperative imaging conditions rather than a single standardized phase. One medical student (P.P.A.), trained in fluoroscopic image interpretation and analysis, manually contoured the 2 segmentation targets—fenestration markers and graft body contours—for each image (Figure 1). All the contours were subsequently reviewed and confirmed by a senior vascular surgery resident (A.P.J.). Fenestration markers were labeled as class 1 and graft body contours as class 2. Of the annotated data set, 295 images from 18 procedures were used for training, while 205 images from 13 procedures were reserved for held-out testing, with a patient-wise split. All images from a given procedure were contained entirely within either the training or test set to prevent data leakage across splits. Across cases, devices contained between 2 and 5 fenestrations (most commonly 4: bilateral renal arteries, superior mesenteric artery (SMA), and celiac artery), reflecting typical real-world FEVAR configurations.
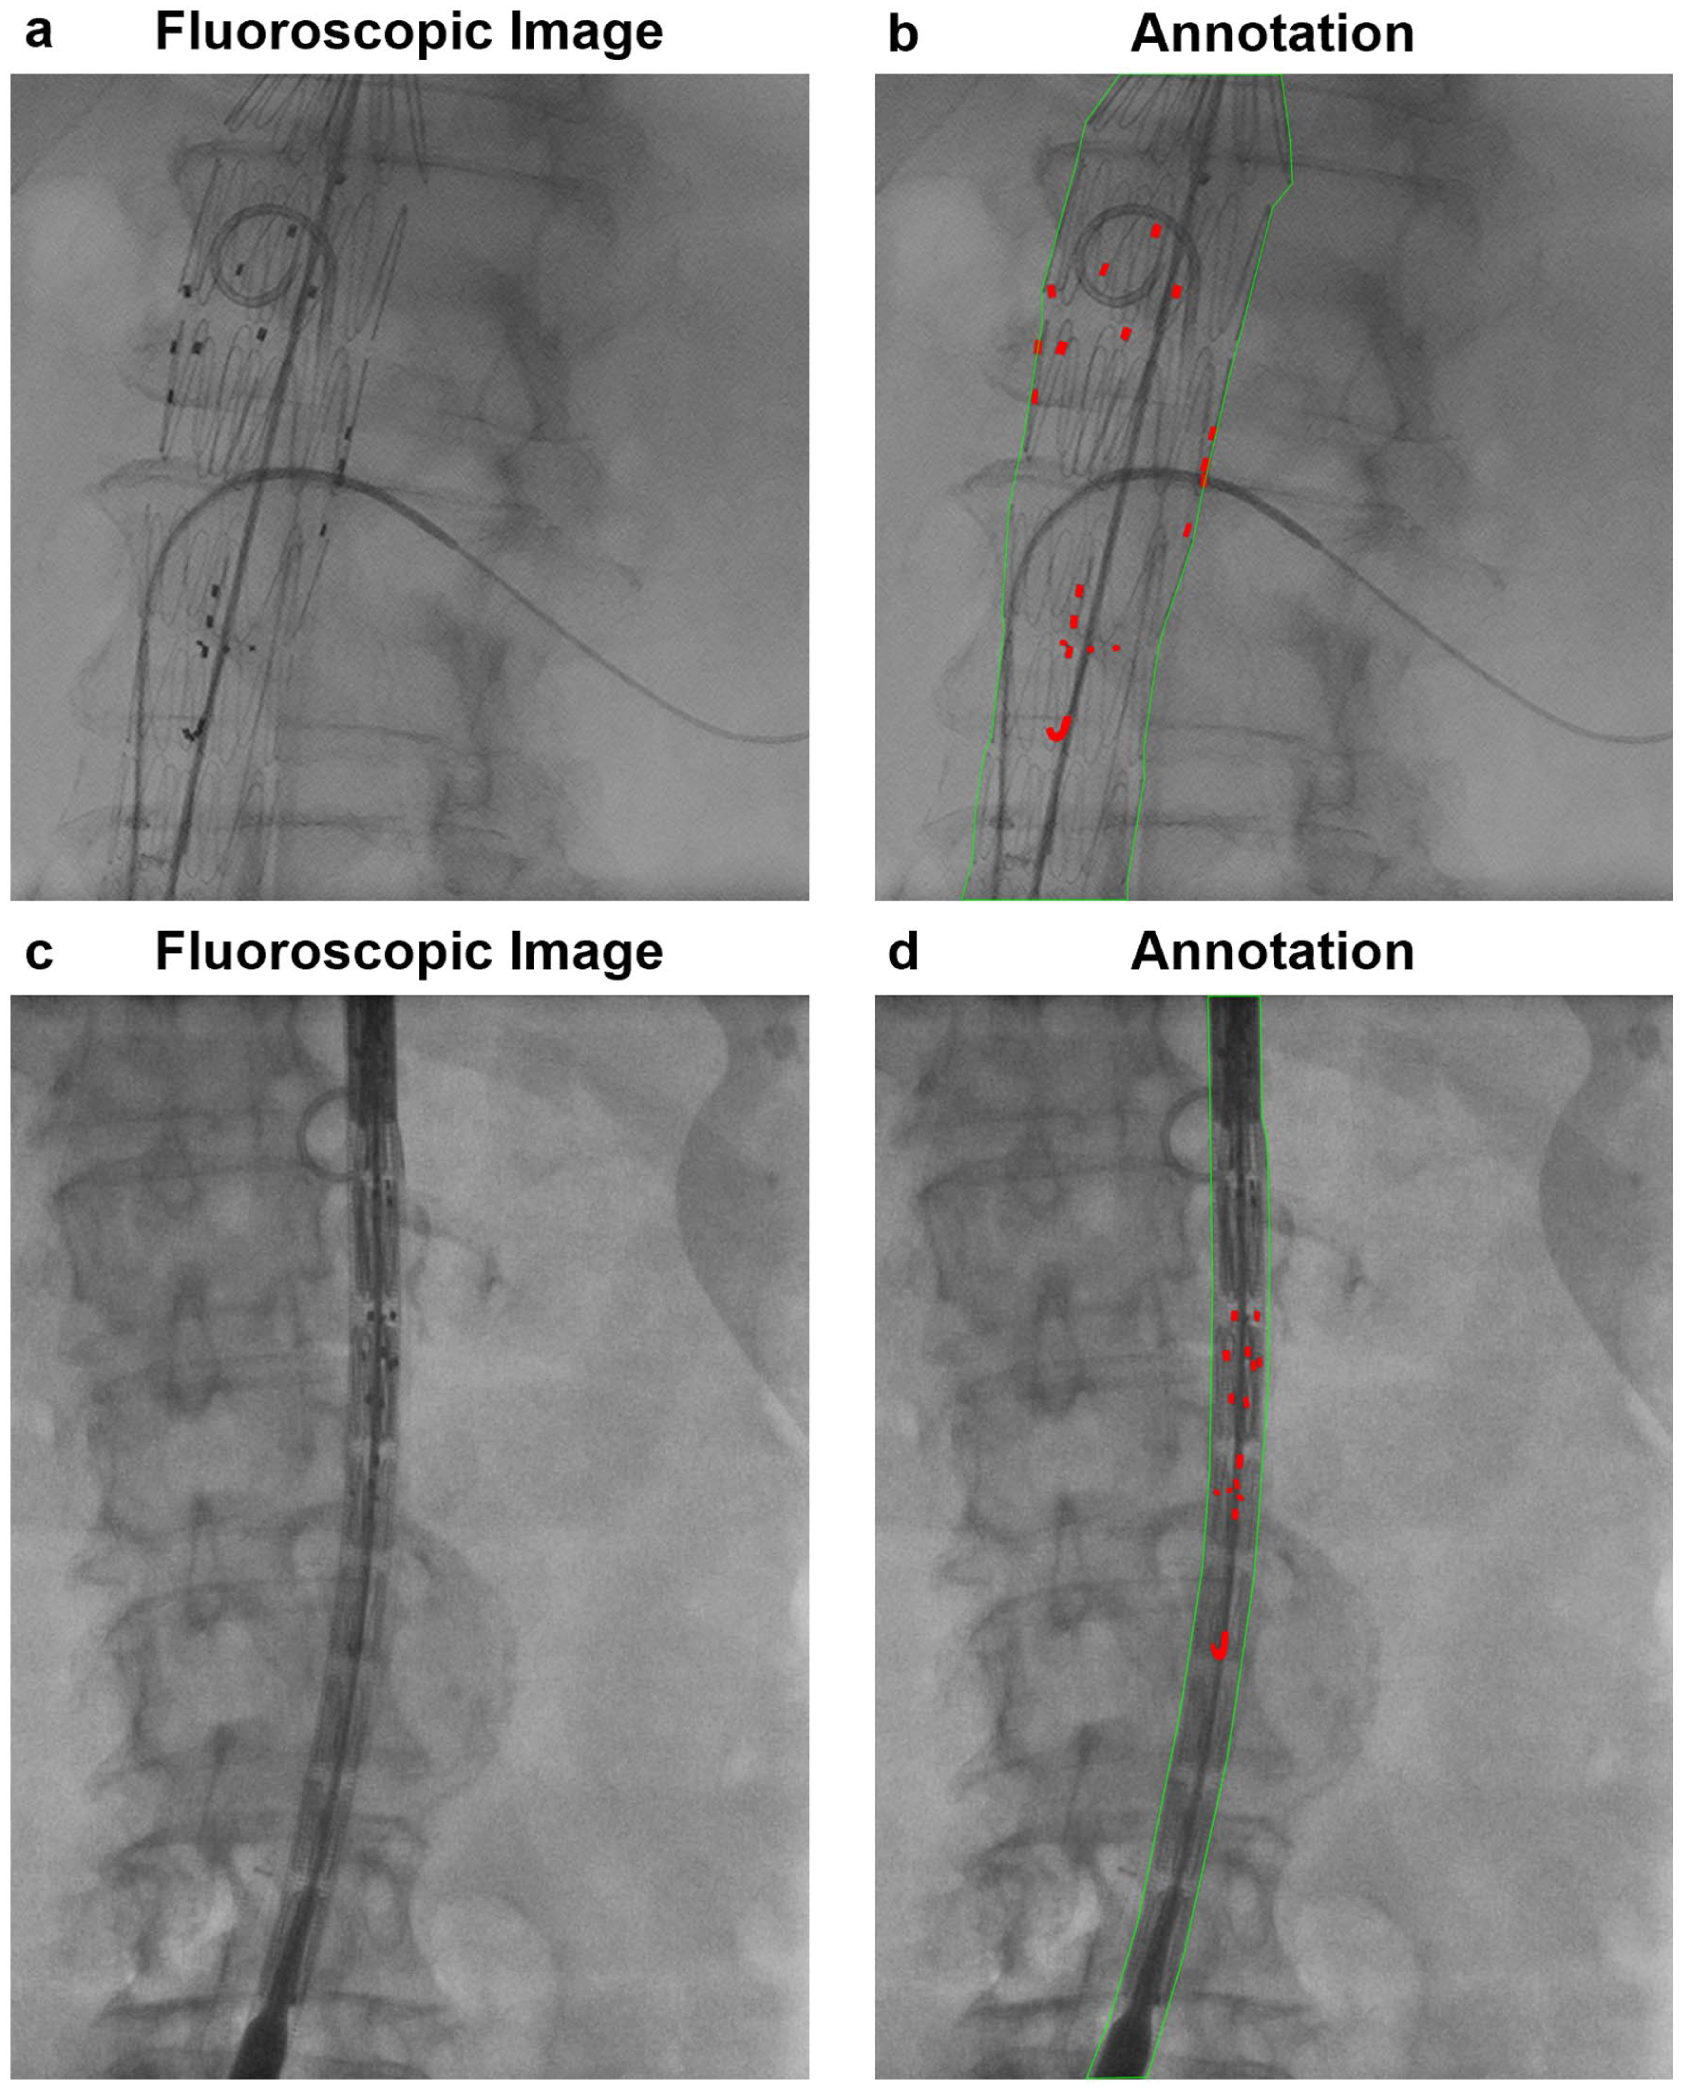
Representative intraoperative fluoroscopic images from FEVAR procedures illustrating manual reference annotations. (A, B) Graft device in the open position with manually annotated fenestration markers (red) and graft body contours (green). (C, D) Graft device in the closed position with the same annotation scheme. These examples define the visual targets (fenestration markers and graft body contours) used for subsequent localization.
Model Development
Deep learning-based automatic segmentation methods are increasingly applied in medical imaging. In this study, we developed a segmentation model for identifying fenestration markers and graft body contours in intraoperative fluoroscopic images during FEVAR. Thus, we propose SIGMA (
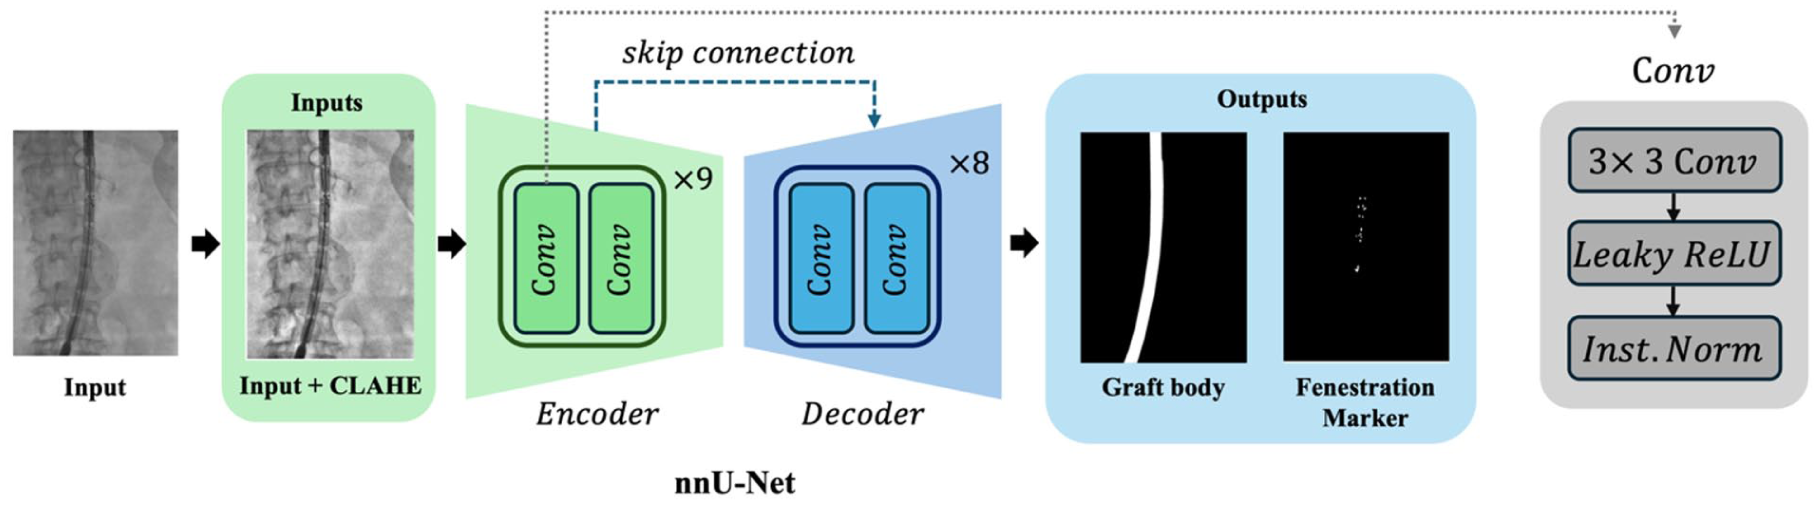
Overview of the SIGMA model architecture for automated segmentation of fluoroscopic images. SIGMA uses an encoder-decoder framework to segment fenestration markers and graft body contours. The encoder extracts hierarchical features through 9 convolutional stages, each comprising 2 convolution layers, using down-sampling operations. The decoder reconstructs the segmentation mask via 8 convolutional stages with up-sampling and skip connections from corresponding encoder layers. Each block includes a convolution operation (kernel size = 3), followed by Leaky ReLU and instance normalization (Inst. Norm). This architecture enables robust feature extraction and accurate segmentation of small and complex graft components.
Model Architecture and Implementation Details
SIGMA is built on a convolutional neural network (CNN) using a standard U-Net architecture, which consists of 2 main components: an encoder that compresses image information and a decoder that reconstructs it into a pixel-wise segmentation map. Its core operation is the convolution, a type of adaptive sliding filter that learns to highlight features relevant to the task—such as rectangular fenestration markers or linear graft boundaries. In the encoder, the model analyzes local pixel neighborhoods to capture basic visual features, and the decoder then reverses this process by progressively reconstructing the image to its original resolution.
The collected images had a median resolution of 1456 × 1008 pixels. During training, we extracted overlapping patches using sliding windows of size 1536 × 1024 pixels from the original images. Each patch was processed independently by the model, and the resulting segmentations were stitched together to reconstruct the final output for the full image. This patch-based strategy enabled efficient processing of large images while maintaining uniform input dimensions across training samples. All the images were preprocessed using Z-score normalization and center cropping. To enhance contrast and improve visibility of anatomical structures, we also applied Contrast Limited Adaptive Histogram Equalization (CLAHE) to the fluoroscopic images.
To improve model robustness and generalizability, we implemented a 5-fold cross-validation strategy during training. The training data set was divided into 5 equal subsets; in each fold, the model was trained on 4 subsets and validated on the remaining one. This process was repeated 5 times, allowing each subset to serve as the validation set once. Cross-validation was performed within the training cohort only; the held-out test cohort remained untouched until final evaluation.
A combined cross-entropy and Dice Similarity Coefficient (DSC) loss was optimized using stochastic gradient descent (SGD) optimizer with a polynomial learning rate scheduler (learning rate = 0.01, weight decay = 3 × 10⁻⁵). After training all the 5 models, we performed an ensemble of their predictions for inference. Specifically, the probabilities from all 5 models were averaged to obtain the final segmentation probabilities. The averaged probabilities were then converted to segmentation labels, and the final output was generated by combining the results from all the models. This ensemble approach helps mitigate potential overfitting and improves the accuracy and reliability of the model’s predictions by leveraging the complementary strengths of each model trained on different data splits.
Model Evaluation
To evaluate model performance, we first assessed marker localization performance (MLP) to assess the accuracy of fenestration marker localization. Marker localization performance included sensitivity, specificity, and Euclidean distance (ED), calculated between the centroids of predicted and ground-truth marker regions for each marker. Metrics were computed at the individual marker level across all the images rather than at the case level, with all the marker instances pooled across the data set. Sensitivity was defined as the proportion of ground-truth markers correctly detected by the model, while specificity reflected the proportion of predicted markers corresponding to true ground-truth markers; in this context, these metrics are analogous to recall and precision, respectively, in object detection terminology. Because each fenestration contains multiple radiopaque markers and cases may include multiple fenestrations, all the markers present in each image were treated as independent detection targets for evaluation. ED values were initially calculated in pixel units and subsequently converted to approximate physical distances (millimeters) using a spatial calibration factor of 0.1615 mm/pixel derived from the fluoroscopy system detector resolution. This conversion enabled estimation of localization accuracy in real-world dimensions while maintaining consistency across images acquired within the same imaging system.
We assessed segmentation performance using DSC, a widely used measure of how well 2 segmentations overlap. The DSC compares the model’s output with the ground-truth (manual) annotations by calculating the shared overlap area and dividing it by the average size of the 2 segmentations. The result ranges from 0 to 1 (or 0%–100%), where values closer to 100% indicate excellent agreement. Lower DSC values typically reflect reduced overlap along structure boundaries, where segmentation is most challenging.
Results
To comprehensively assess model performance, we evaluated both marker localization accuracy and segmentation overlap using standard metrics. Marker localization performance was quantified using sensitivity, specificity, and ED between predicted and ground-truth centroids of fenestration markers. Segmentation accuracy was assessed using the DSC, which measures spatial overlap between predicted and manually annotated segmentations. These evaluations were conducted independently for the training and test data sets to assess generalizability.
SIGMA Localization Performance
In the training data set, SIGMA achieved a mean sensitivity of 87.8±32.8% and a mean specificity of 97.0±17.3%. In the test data set, sensitivity and specificity were 91.0±28.7% and 90.2±29.7%, respectively. In the training data set, the median ED was 0.16 mm (interquartile range [IQR], 0.00–0.27 mm), with 90th and 95th percentile values of 0.41 and 0.60 mm, respectively. In the test data set, the median ED was 0.16 mm (IQR, 0.00–0.33 mm), with 90th and 95th percentile values of 0.49 and 0.79 mm, respectively. A small number of large-distance outliers were observed, resulting in higher mean ED values and wide ranges in both data sets. These findings indicate accurate localization performance across the majority of markers (Figure 3, Table 1).
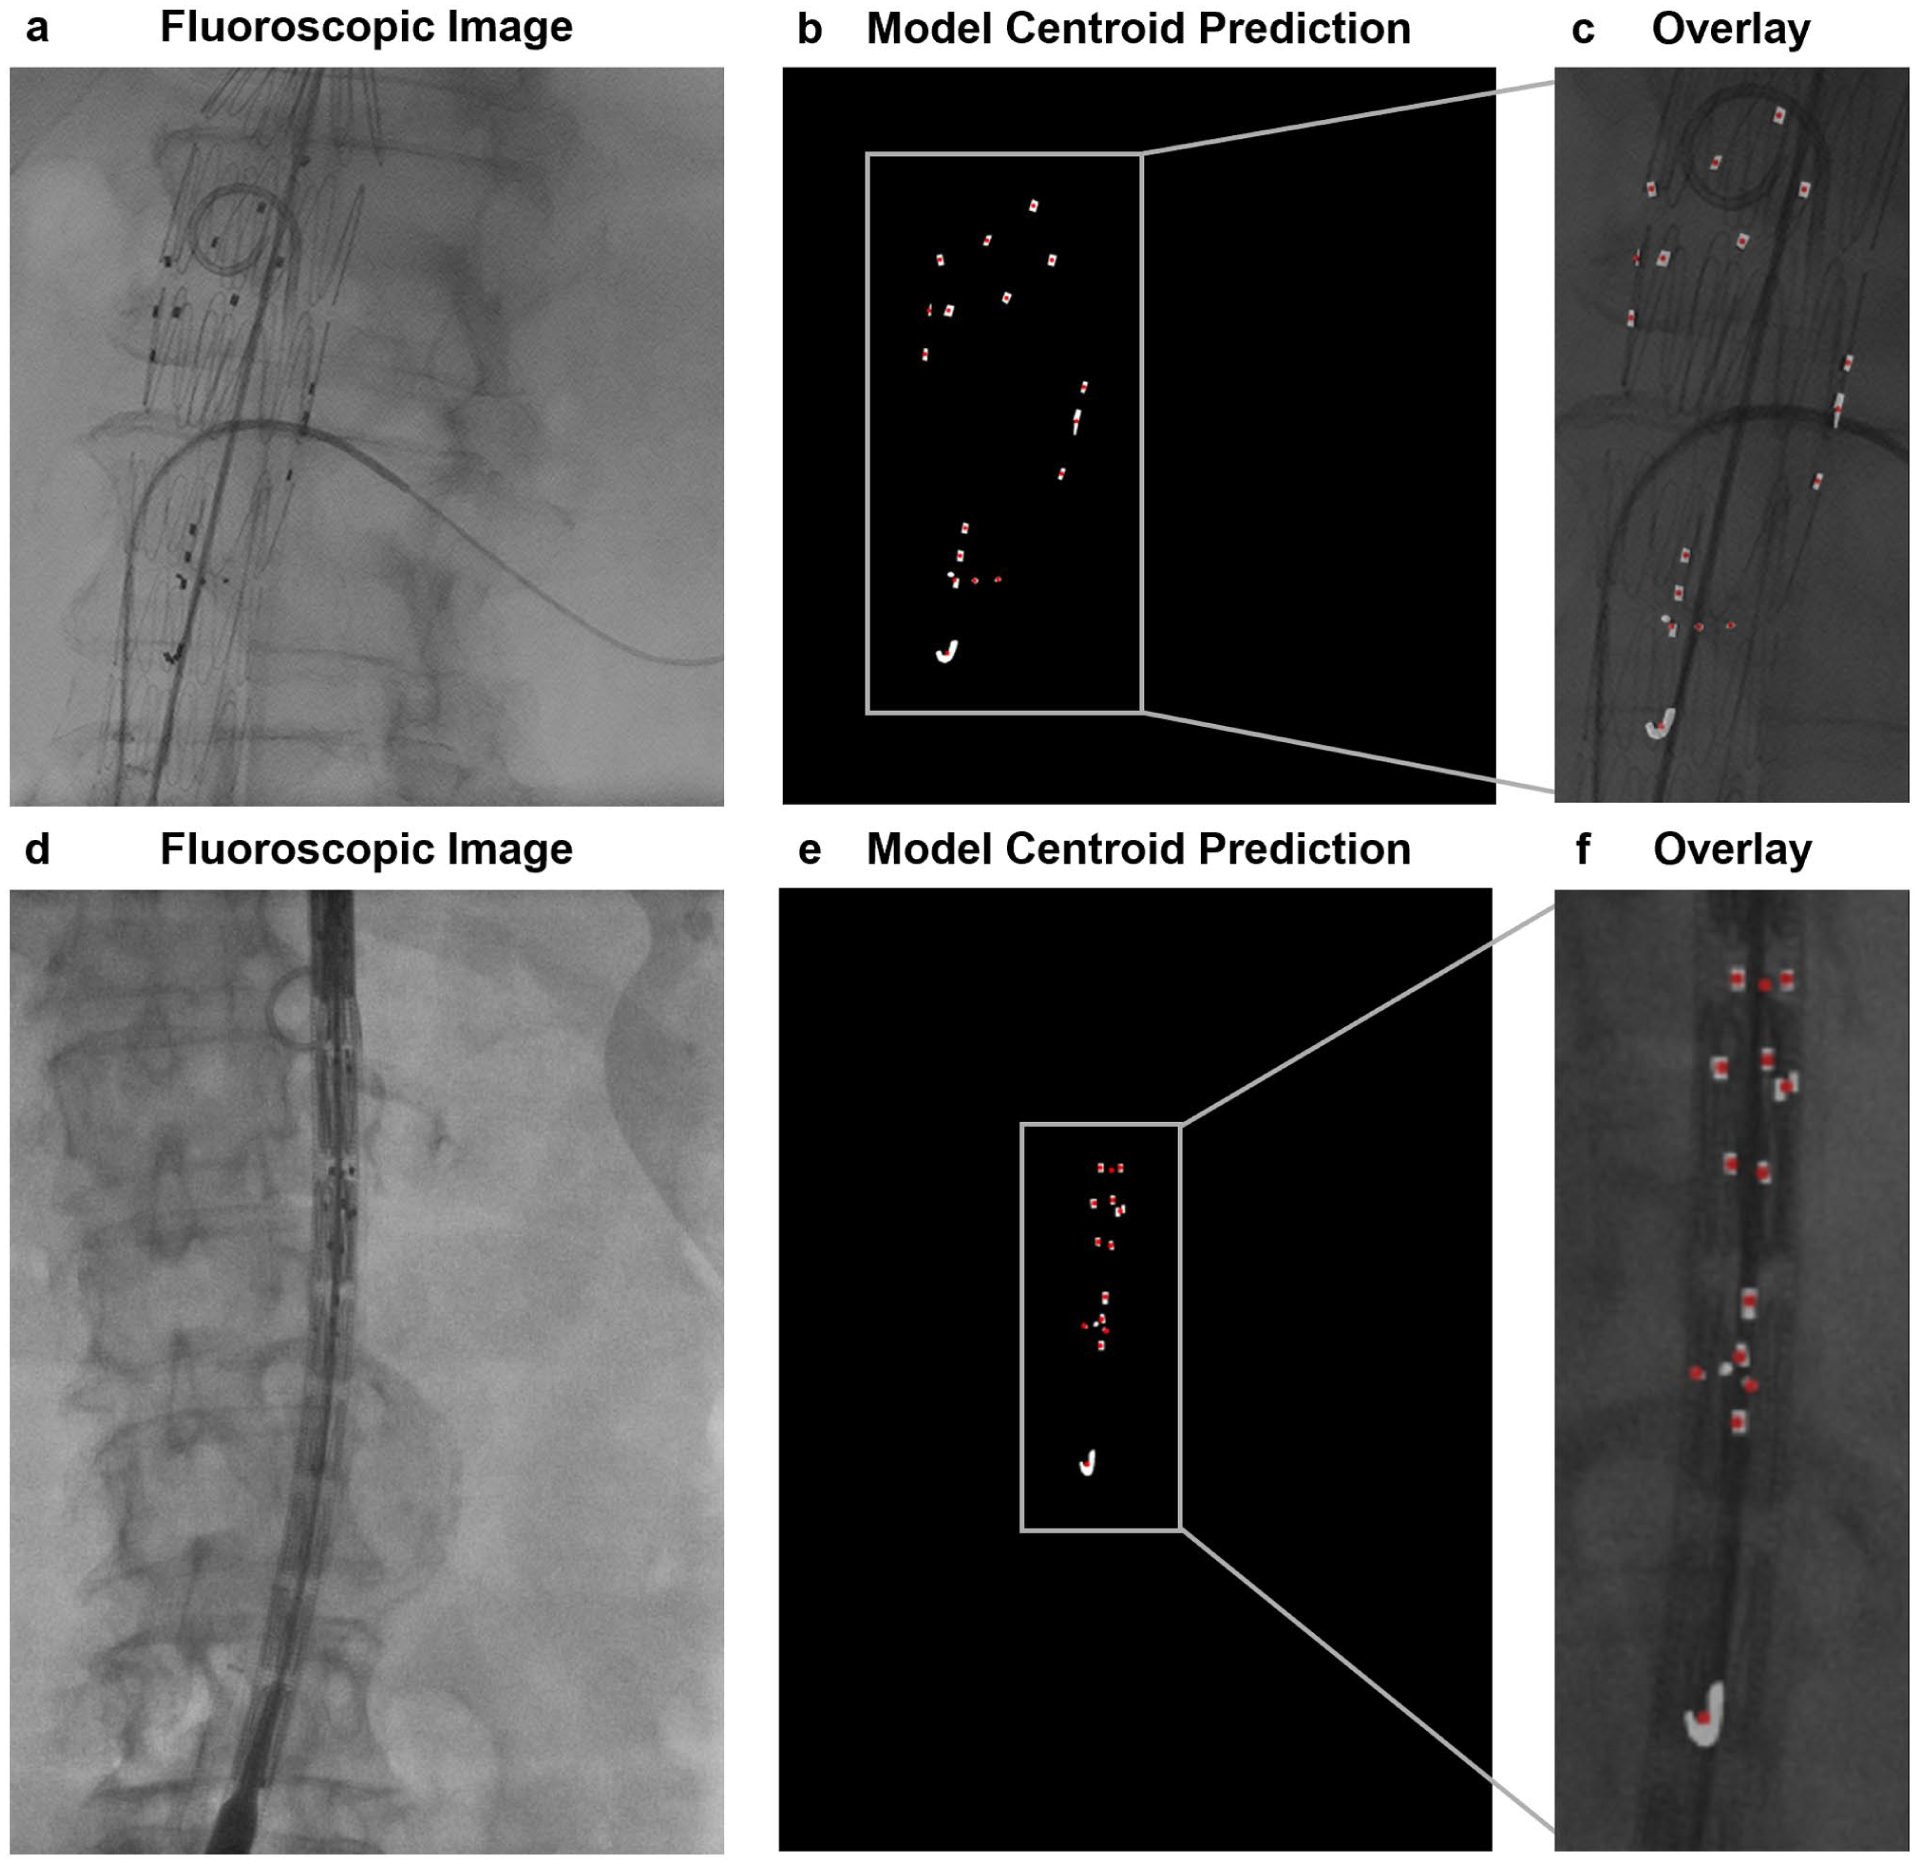
Evaluation of marker localization performance (MLP) for fenestration markers. MLP evaluates localization accuracy based on sensitivity, specificity, and Euclidean distance between predicted and ground-truth centroids, offering a complementary metric to Dice similarity coefficient (DSC) for small anatomical targets. Representative examples demonstrate fenestration marker localization using MLP metrics. (A, D) Intraoperative fluoroscopic images from FEVAR procedures. (B, E) Model-predicted marker centroid locations (red), visualized on ground-truth fenestration markers (white). (C, F) Overlay of model-predicted marker centroid locations on intraoperative fluoroscopic images.
Marker Localization Performance Metrics for Fenestration Marker Segmentation.
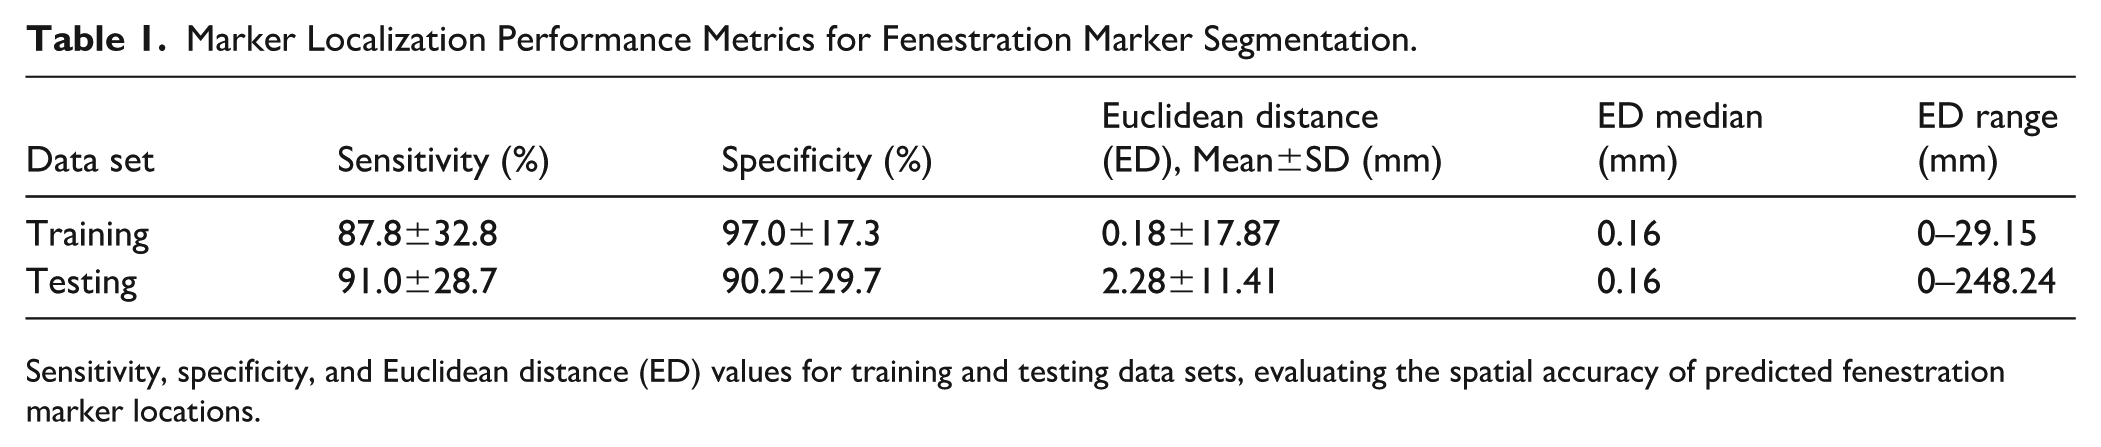
Sensitivity, specificity, and Euclidean distance (ED) values for training and testing data sets, evaluating the spatial accuracy of predicted fenestration marker locations.
SIGMA Segmentation Performance
In terms of spatial overlap, SIGMA achieved a mean DSC of 90.5±3.4% for fenestration markers and 99.3±0.3% for graft body contours in the training data set, with median (IQR) values of 91.1% (89.4%–92.5%) and 99.4% (99.2%–99.5%), respectively. In the test data set, the mean DSC for fenestration markers was 79.5±6.9%, with a median (IQR) of 80.1% (75.8%–84.3%), while graft body contours achieved a mean DSC of 96.6±12.0% with a median (IQR) of 98.8% (98.2%–99.2%). A small number of lower-performing cases were observed, primarily involving fenestration markers, reflecting increased segmentation difficulty in images with reduced marker visibility or more complex fluoroscopic backgrounds. These results demonstrate strong generalization for both segmentation targets, particularly for the larger and more homogeneous graft body contours, and highlight the model’s robustness in identifying small, variable features such as fenestration markers (Figure 4, Table 2).
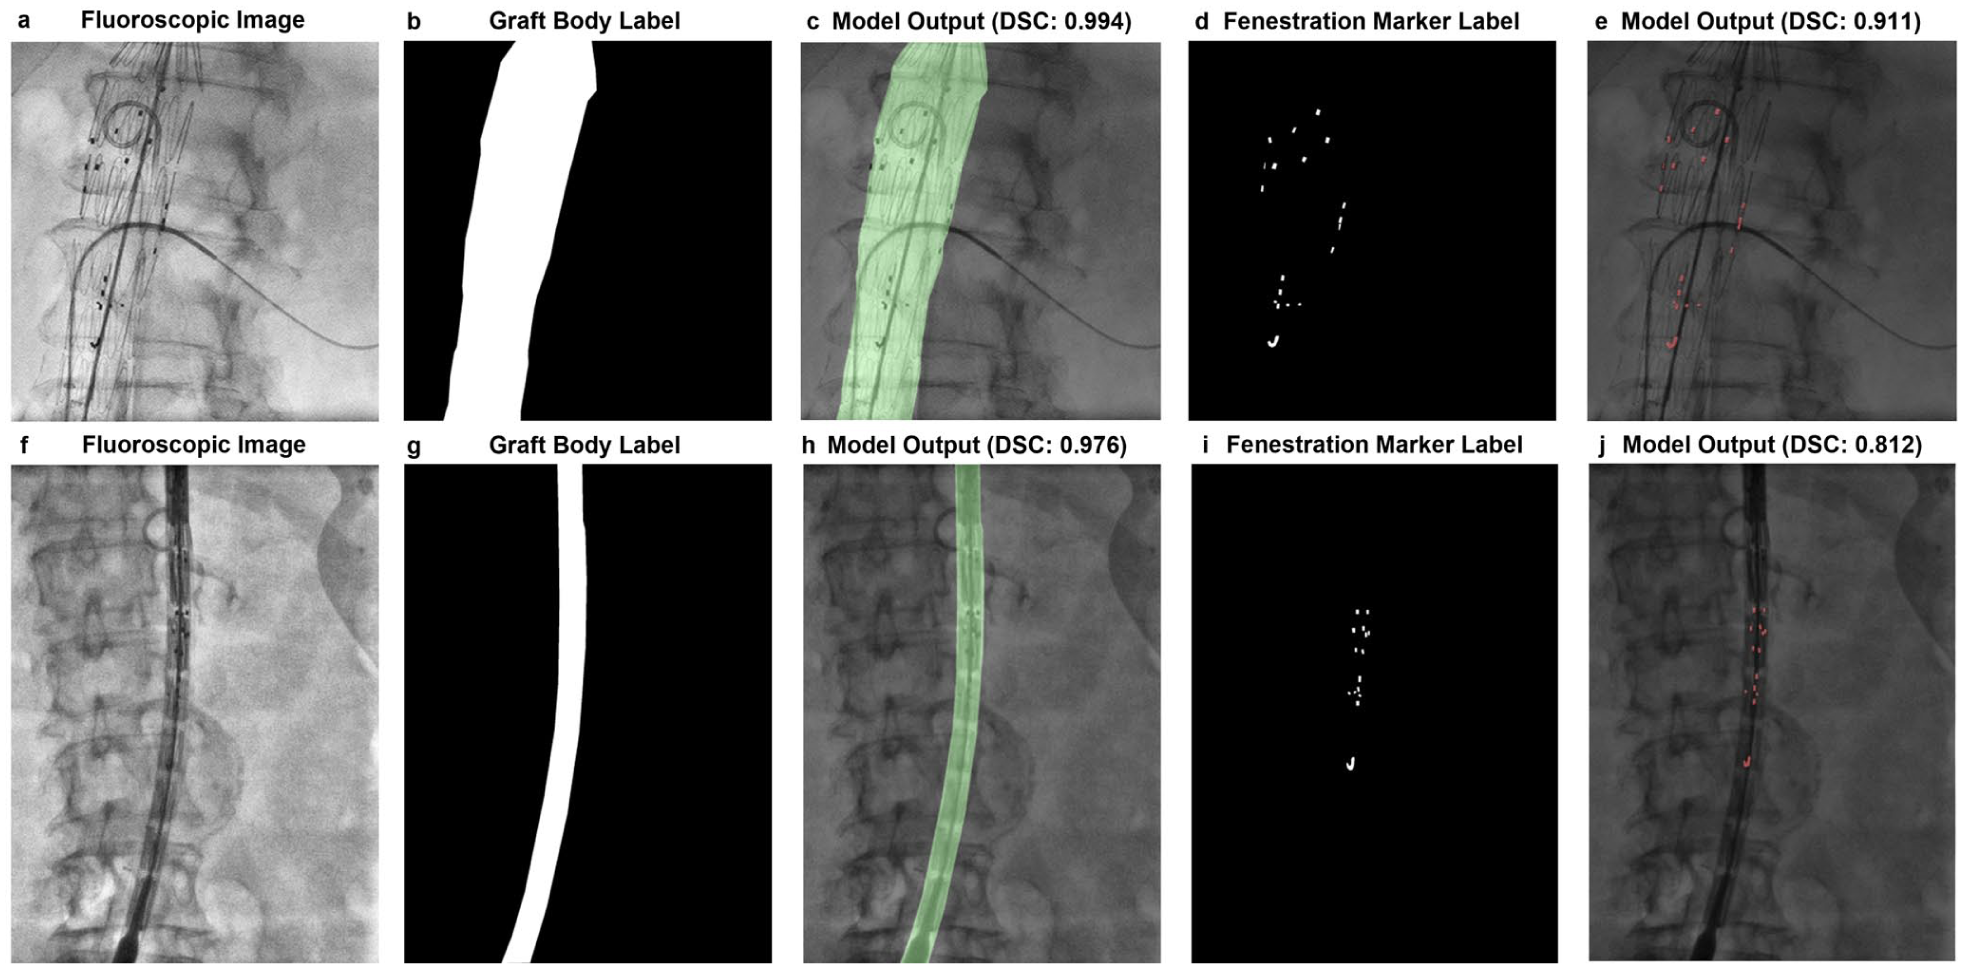
Representative segmentation results for graft body contours and fenestration markers. (A, F) Intraoperative fluoroscopic images from FEVAR procedures. (B, G) Manual annotations of graft body contours. (C, H) Overlay of model-predicted contours with corresponding Dice similarity coefficients (DSC). (D, I) Manual annotations of fenestration markers. (E, J) Overlay of model-predicted markers with corresponding DSC values. The top row (A–E) and bottom row (F–J) show 2 distinct examples from the data set. SIGMA demonstrated high accuracy in segmenting both fenestration markers and graft body contours across varying imaging conditions.
Segmentation Performance Metrics and Data Set Composition.
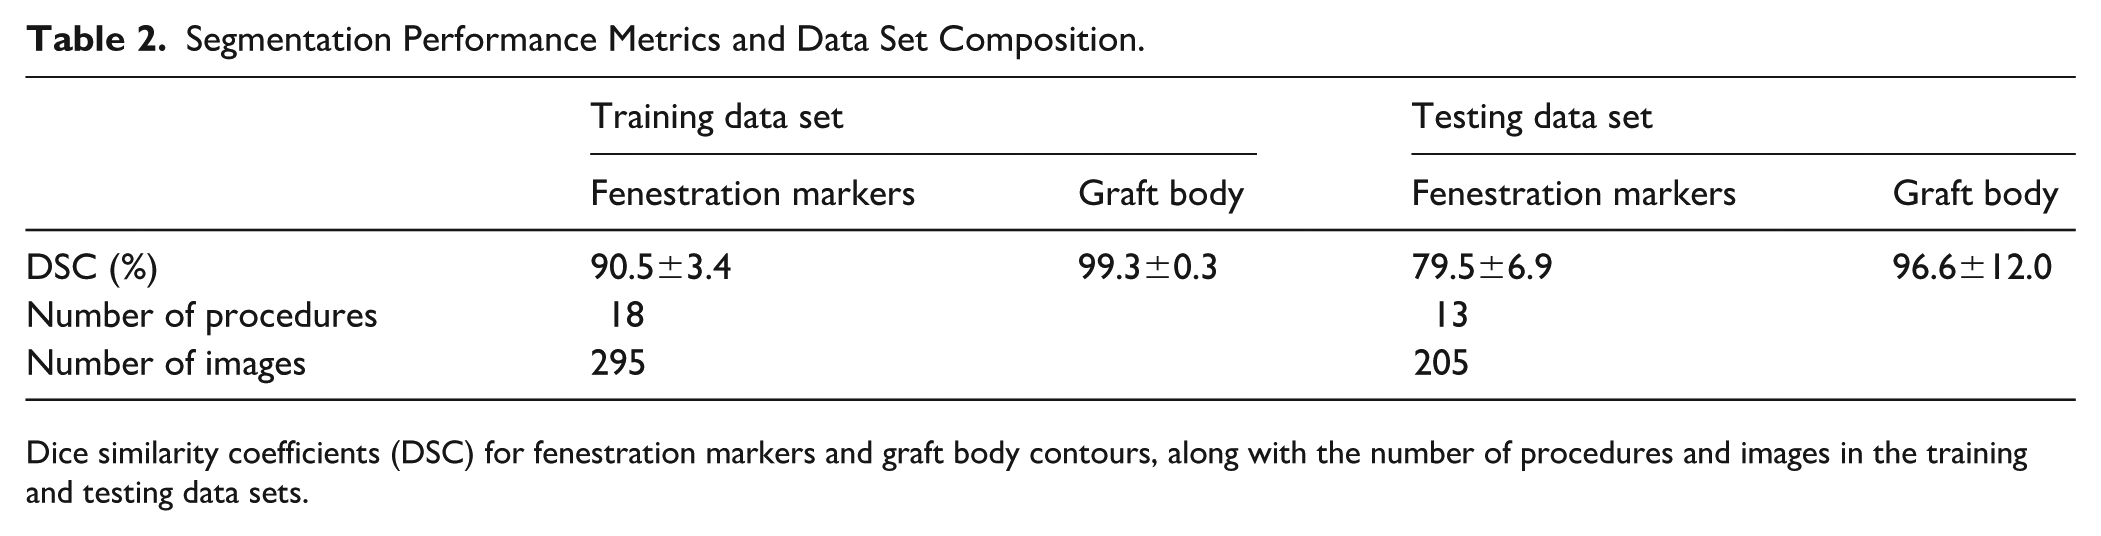
Dice similarity coefficients (DSC) for fenestration markers and graft body contours, along with the number of procedures and images in the training and testing data sets.
Discussion
In this study, we developed and validated SIGMA, a deep learning-based segmentation model capable of identifying fenestration markers and graft body contours in intraoperative fluoroscopic images during FEVAR. To assess model performance, we first evaluated MLP, which quantifies the accuracy of detecting small, discrete objects based on centroid location. In the test data set, SIGMA achieved an MLP sensitivity of 90.9% and specificity of 90.2%, with a median ED of 0.16 mm (Table 1). However, performance variability was higher in the test set, with several large outliers in ED. This variability may reflect inherent challenges in segmenting small, low-contrast targets in fluoroscopic FEVAR images, including variations in marker appearance, image quality, or anatomical complexity. Potential contributors also include limited data set diversity or model overfitting to specific imaging patterns. To complement MLP, we also evaluated segmentation overlap using DSC, which remains a standard metric in image segmentation tasks. Segmentation of fluoroscopic Images for Graft and Marker Analysis achieved mean DSCs of 96.6% for graft body contours and 79.5% for fenestration markers in the test data set (Table 2). The drop-off in marker DSC from training (90.5%) to testing (79.5%) indicates sensitivity to variations in marker visibility, anatomical presentation, and imaging conditions commonly encountered across FEVAR data sets. Together, these results demonstrate SIGMA’s ability to both segment and localize key features within intraoperative fluoroscopic images with high precision.
The segmentation outputs produced by SIGMA provide a technical foundation for developing tools that go beyond static image labeling. Specifically, accurate segmentation and localization of fenestration markers and graft contours may enable future methods to calculate fenestration angles and graft orientation using only 2D fluoroscopic images. This opens possibilities for intelligent overlay systems capable of providing real-time image-derived feedback during graft deployment. Although 2D to 3D and 3D to 3D image fusion techniques have been proposed for similar purposes, they often rely on proprietary software, additional preoperative imaging, and complex registration protocols that are not universally accessible.11,12 By contrast, SIGMA leverages standard 2D fluoroscopy and deep learning-based segmentation to achieve high-precision localization, potentially enabling more accessible, cost-effective solutions. This functionality could support procedural consistency and reduce reliance on manual image interpretation.
A notable strength of this study is the use of the nnU-Net framework, a self-configuring deep learning pipeline designed for medical image segmentation. 10 Developing segmentation models for small targets such as fenestration markers remains challenging due to the subtle appearance of markers, limited contrast, and the need for large, diverse training data sets. Unlike conventional models that require manual tuning, nnU-Net dynamically adapts preprocessing steps, network configuration, and training protocols based on the input data set, improving generalizability and ease of deployment. Additionally, CLAHE was used to enhance local contrast and improve visualization of low-contrast features. While CLAHE improves feature visibility, it does not generate true depth information but may help accentuate structures that appear flat or indistinct in the original fluoroscopic images. These combined strategies contributed to SIGMA’s ability to identify both well-defined graft structures and smaller, more variable marker elements.
Despite these strengths, certain limitations remain. Fenestration marker detection is inherently more challenging due to the small size of the targets, variable contrast, and dependence on fluoroscopic image quality. Even minor differences in contrast, patient positioning, or image noise can significantly affect marker visibility and centroid alignment. To ensure broader robustness, future validation across diverse imaging systems and procedural settings will be important. Architectural enhancements—such as multi-scale modules or attention-based mechanisms—may further improve sensitivity for small, low-contrast structures. In addition, incorporating explainability tools and confidence metrics could improve model interpretability and support clinical integration. Another key limitation relates to data set size and setting. Although this study includes 31 complete FEVAR procedures and 500 intraoperative fluoroscopic images sampled across multiple procedural stages, the data set remains modest by deep learning standards and reflects a single institutional workflow and imaging environment. In addition, the data were acquired between 2015 and 2016, and performance may vary when applied to images from different institutions, fluoroscopy systems, or acquisition protocols. Annotation of fenestration markers may also be subject to inter-annotator variability, which could influence both the measured model performance and the clinical acceptability of the generated outputs. Future work will therefore include multi-reader annotations and consensus strategies to better quantify and mitigate this source of uncertainty. While patient-wise separation between training and test cohorts reduces the risk of data leakage and provides a more realistic estimate of generalization than frame-level splitting, broader external validation is still required. Future studies should incorporate multi-institutional data across different fluoroscopy systems, acquisition protocols, and operator techniques to better define robustness and generalizability. Furthermore, practical imaging factors, including patient adiposity and radiation dose, play a significant role in fluoroscopic image quality and, by extension, model performance. Increased adiposity can reduce image clarity due to greater noise and attenuation, while higher radiation doses typically yield sharper, more easily segmentable images. This presents a promising strategy: if models like SIGMA can achieve accurate segmentation from a single high-quality image, it may be possible to reduce the overall number of image acquisitions during a procedure. By selectively increasing radiation for a small number of critical frames, segmentation fidelity could be enhanced while minimizing cumulative radiation exposure. With continued refinement, this approach—combined with future models capable of extrapolating fenestration angles from segmented targets—may support safer, more streamlined workflows in FEVAR and other complex endovascular interventions.
Conclusions
In conclusion, this study presents SIGMA, a deep learning-based segmentation model that accurately identifies fenestration markers and graft body contours in intraoperative fluoroscopic images during FEVAR. By achieving robust performance across both localization and segmentation tasks, SIGMA establishes a technical foundation for the next generation of intelligent intraoperative tools. Unlike more complex proposed methods that rely on costly 3D reconstructions and complex registration workflows, SIGMA operates directly on standard 2D fluoroscopy—making it highly adaptable to diverse surgical environments. Its ability to localize fenestration markers with sub-millimeter precision opens the door to automated angle estimation, rotational alignment feedback, and real-time overlay systems that could assist operators in navigating the most technically demanding phases of FEVAR. For vascular surgeons, this represents more than a segmentation advance—it is a step toward practical, AI-powered guidance that can reduce cognitive load, improve alignment accuracy, and ultimately standardize outcomes across institutions. As hybrid ORs increasingly integrate imaging and computational tools, models like SIGMA will play a pivotal role in bridging the gap between raw intraoperative imaging and actionable decision support. With broader validation and integration, SIGMA could accelerate the development of scalable solutions for intraoperative image augmentation, not only in FEVAR but also across a wide spectrum of complex endovascular procedures.
Supplemental Material
sj-docx-1-jet-10.1177_15266028261437610 – Supplemental material for Development and Validation of a Deep Learning-Based Segmentation Method for Fenestration Marker and Graft Body Identification in Fenestrated Endovascular Aortic Repair
Supplemental material, sj-docx-1-jet-10.1177_15266028261437610 for Development and Validation of a Deep Learning-Based Segmentation Method for Fenestration Marker and Graft Body Identification in Fenestrated Endovascular Aortic Repair by Polycronis P. Akouris, Sangwook Kim, Arshia P. Javidan, Chris McIntosh and Sean A. Crawford in Journal of Endovascular Therapy
Footnotes
Funding
The authors received no financial support for the research, authorship, and/or publication of this article.
Declaration of Conflicting Interests
The authors declared the following potential conflicts of interest with respect to the research, authorship, and/or publication of this article: S.A.C. is a speaker for Cook Medical and has previously spoken for Bentley. The remaining authors declared no potential conflicts of interest with respect to the research, authorship, or publication of this article.
Supplemental Material
Supplemental material for this article is available online.
References
Supplementary Material
Please find the following supplemental material available below.
For Open Access articles published under a Creative Commons License, all supplemental material carries the same license as the article it is associated with.
For non-Open Access articles published, all supplemental material carries a non-exclusive license, and permission requests for re-use of supplemental material or any part of supplemental material shall be sent directly to the copyright owner as specified in the copyright notice associated with the article.