
Abstract
Background
Modern zoos seek to support their audiences in taking conservation action. To increase participation and maximize environmental impact, zoos should consider their community members’ perspectives from the outset -- i.e., in the selection of the action -- including understanding perceived barriers, benefits, current participation, and ease of taking the action.
Focus of the Article
This article focuses on a zoo’s process to integrate community perspectives when selecting conservation actions for messaging. We collected data from four audiences and applied community-based social marketing (CBSM) and other decision-making models to identify conservation actions in which efforts by the zoo could increase community engagement and behavior change.
Research Question
How can a zoo incorporate community perspectives into the process of selecting conservation actions for messaging?.
Importance to Social Marketing Field
Using the CBSM decision-making equation and a novel decision-making equation inspired by research with zoo visitors (the NERO model), the Queens Zoo balanced environmental impacts, community perspectives, and its’ expertise in developing and implementing conservation campaigns. Other institutions, like schools, museums, and universities looking to engage their communities in actions should apply this strategy to maximize the impact of their campaigns, especially when an action does not need to be done at home.
Methods
We used a two-phase mixed-methods design to answer our research question. Phase 1 included a content analysis, a survey of 42 zoo educators, interviews with 28 Queens Zoo visitors, and focus groups with 24 community members to identify eight conservation actions that were local priorities. We explored these actions more deeply in Phase 2, fielding an online survey to 400 residents of the New York City metro area. We used survey and environmental impact data to assign numeric values to the variables in two decision-making equations: CBSM and the NERO model, which is based on research with zoo visitors. Using the scores, we ranked the eight actions relative to each other and used these results to inform discussions with zoo leadership to strategically identify actions where the zoo’s expertise can support broad and sustainable behavior change.
Results
Conservation actions prioritized during Phase 1 primarily included protecting the environment in general and protecting wildlife and habitats. Phase 2 survey data and application of the decision-making equations highlighted four actions nested within those themes -- enrolling with a clean energy provider, advocating for green space, reducing plastic use, and creating wildlife habitat -- as having high potential to engage many people and have meaningful environmental impact. Discussions with zoo leadership focused on how these actions align with zoo priorities and expertise and how the zoo could support communities in conservation action.
Recommendations for Research or Practice
Conservation organizations seeking to support people in the behavior change process should consider how decision-making equations and data from their communities can help them select actions for campaigns. Incorporating community perspectives throughout the design of a conservation action campaign will increase relevance and interest and maximize participation and environmental impact.
Introduction
Modern zoos and aquariums are conservation organizations that protect wildlife and inspire the public to take action on behalf of the environment (Falk & Reinhard, 2007; Fraser & Sickler, 2009). Zoos and aquariums (from here, “zoos”) have an education mission (Bevan et al., 2022; McCallie et al., 2009), and many go beyond simply teaching about issues to also connecting the public with opportunities to act themselves (Cannataro et al., 2022; Wildlife Conservation Society, 2025). With climate change and other environmental threats only increasing in scale and severity, large-scale and effective action is needed more urgently than ever.
Conservation actions vary widely and motivating people to act requires understanding the conservation issues that matter to them, the perceived benefits and barriers to acting, as well as the impact (real and perceived) of the actions (Heimlich & Ardoin, 2008; McKenzie-Mohr, 2011b; Smith et al., 2010a). This study explores conservation issues with four audiences with various degrees of connection to their local zoo, with results informing the implementation of the zoo’s conservation action strategy. While local in scope, the research demonstrates how zoos can leverage their community connections and wells of public trust to motivate people to adopt new and sustainable environmental behaviors. With an audience of over 180 million visitors annually (Zoo and Aquarium Statistics, 2024), zoos can be a force for much-needed broad and sweeping conservation action.
Background and Literature
Conservation Education at Zoos
People visit zoos to see and learn about animals that they do not encounter in their everyday lives. In the 1980’s, conservation became an integral part of zoos’ missions (Fraser & Switzer, 2021) and these institutions broadened their educational goals beyond sharing information about species’ natural history to include connections to habitats, ecosystems, threats, and efforts to protect the animals in the wild. The shift to conservation messaging (Fraser & Switzer, 2021) has led to zoos tackling a variety of complex conservation issues, such as human-wildlife conflict, plastic pollution, climate change, and poaching, in their exhibits and programs (Baechler et al., 2021; Merlino, 2006; O’Bryan, 2015; Stoinski et al., 2002).
Research has demonstrated, however, that simply sharing information is not enough to change attitudes and motivate action (i.e., the Knowledge-Attitudes-Behavior model; Hungerford & Peyton, 1994); rather, other mechanisms feed into behavior change (Abrash Walton et al., 2022; McKenzie-Mohr, 2011b). Confirming this finding, a review of studies about zoo conservation messaging between 2011 and 2020 found that messages mostly contributed to increased content knowledge about issues or emotional outcomes, as opposed to behavioral outcomes (Schilbert & Scheersoi, 2023). As a result, zoos have started integrating alternative approaches that focus specifically on motivating conservation action into their messaging strategy.
Conservation psychology research suggests that inspiring people to take action requires thoughtfully selected actions that feel relevant, doable, and impactful (Smith et al., 2010a; Smith, Weiler et al. 2012a). Conservation actions highlighted at zoos are highly varied and the factors influencing their selection are complex. They range from messaging about the illegal wildlife trade and how to prevent it by asking questions about wildlife products (Rank et al., 2023), responsible consumer behaviors, such as purchasing products made with sustainable palm oil (Kelly & Skibins, 2020), and behavioral alternatives, such as blowing bubbles instead of releasing balloons at events (Mellish et al., 2019), among many others.
Despite the prevalence of conservation action messaging at zoos, there is little underlying research on how these specific actions encourage participation and ultimately, impact. One exception is a Zoos Victoria mobile phone recycling campaign that aimed to reduce gorilla habitat loss due to mining of minerals needed for electronics (Litchfield et al., 2018). This campaign provided free mailing envelopes to zoo guests and tracked the number of envelopes mailed, the number of phones recycled (115,369 total), and estimates of the recoverable elements saved (3,294 kg). More research that tracks participation, as well as public perceptions and conservation impact is needed to ensure that zoos are building not only an informed public, but one that is equipped and motivated to take action.
Theoretical Models of Behavior Change
Recently, the Transtheoretical Model of Behavior Change (TTM) has received positive attention for its potential to inform how zoos encourage environmental behavior with audiences (Abrash Walton et al., 2022; Nageotte et al., 2024). Much of the research on TTM comes from healthcare (Prochaska & Velicer, 1997), but the model is relevant for conservation because it accounts for individual’s readiness to participate in an action and weighs the benefits and drawbacks of the action (Abrash Walton et al., 2022). Abrash Walton et al. (2022) suggested that a simple survey of the target audience can reveal relationships with a set of behaviors (i.e., action readiness); Nageotte et al. (2024) actualized this process by asking survey participants to identify their readiness to do behaviors (e.g. never thought about it, not interested) to inform priority conservation behaviors for the Denver Zoo Conservation Alliance.
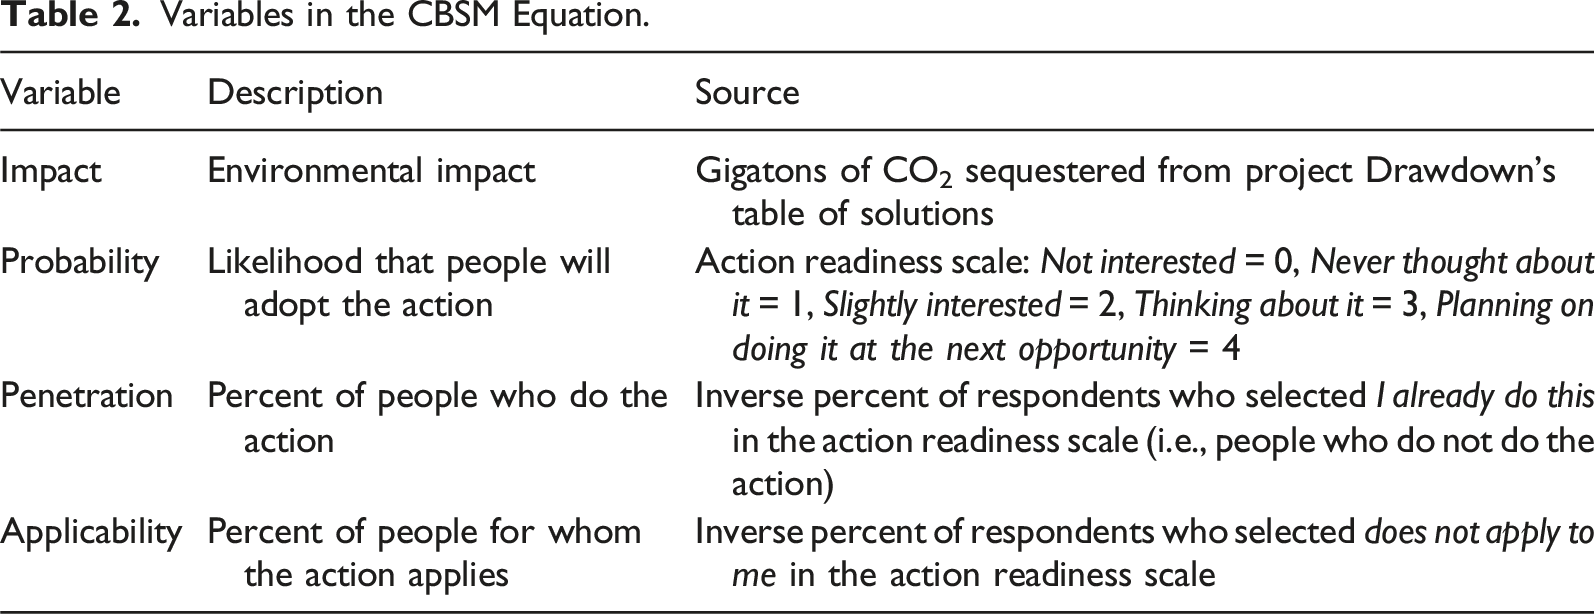
Community-Based Social Marketing (CBSM) is another model focused on achieving behavior change by reducing barriers, elevating benefits, acknowledging social context, and accounting for actual environmental impact (McKenzie-Mohr, 2011a; 2011b), however it has been used on a limited basis in conservation (Green et al., 2019; Robinson et al., 2018). The first step of CBSM encourages the use of an equation to assess the impact of an action within a particular context, accounting for environmental impact (Impact), the likelihood the behavior will be adopted (Probability), the number of people already doing the behavior (Penetration), and how many people could do the behavior (Applicability) (equation (1); McKenzie-Mohr, 2011b; McKenzie-Mohr & Schultz, 2014)

Identifying the action for a CBSM-informed behavior change campaign requires assigning values to these four variables, multiplying them, and ranking actions by their scores. Impact can be represented as the amount of CO2 sequestered or saved or as expert ratings. Probability, penetration, and applicability are determined by surveying the target audience to gain insight into their perspectives (Berg et al., 2010; Ibrahim et al., 2018). Probability is the likelihood of doing a specific behavior, from not at all likely (0) to extremely likely (4). Penetration and applicability are both percentage values that assess participation relative to the total population. Unlike the other three variables, impact has no theoretical maximum value and therefore has the most influence on the final score, with CBSM developers rationalizing that it is best to select behaviors with the largest possible environmental impact (McKenzie-Mohr et al., 2012).
Zoos Victoria used CBSM to inform a multi-part campaign to encourage using bubbles instead of balloons at celebrations (Mellish et al., 2019). Research found that balloons and their attachments were one of the most commonly identifiable items found in the chicks of a marine bird and a major source of mortality (Mellish et al., 2019). Zoos Victoria conducted interviews with zoo visitors to identify the barriers to and benefits of switching from balloons to bubbles, which they then applied to their campaign messaging (Mellish et al., 2019).
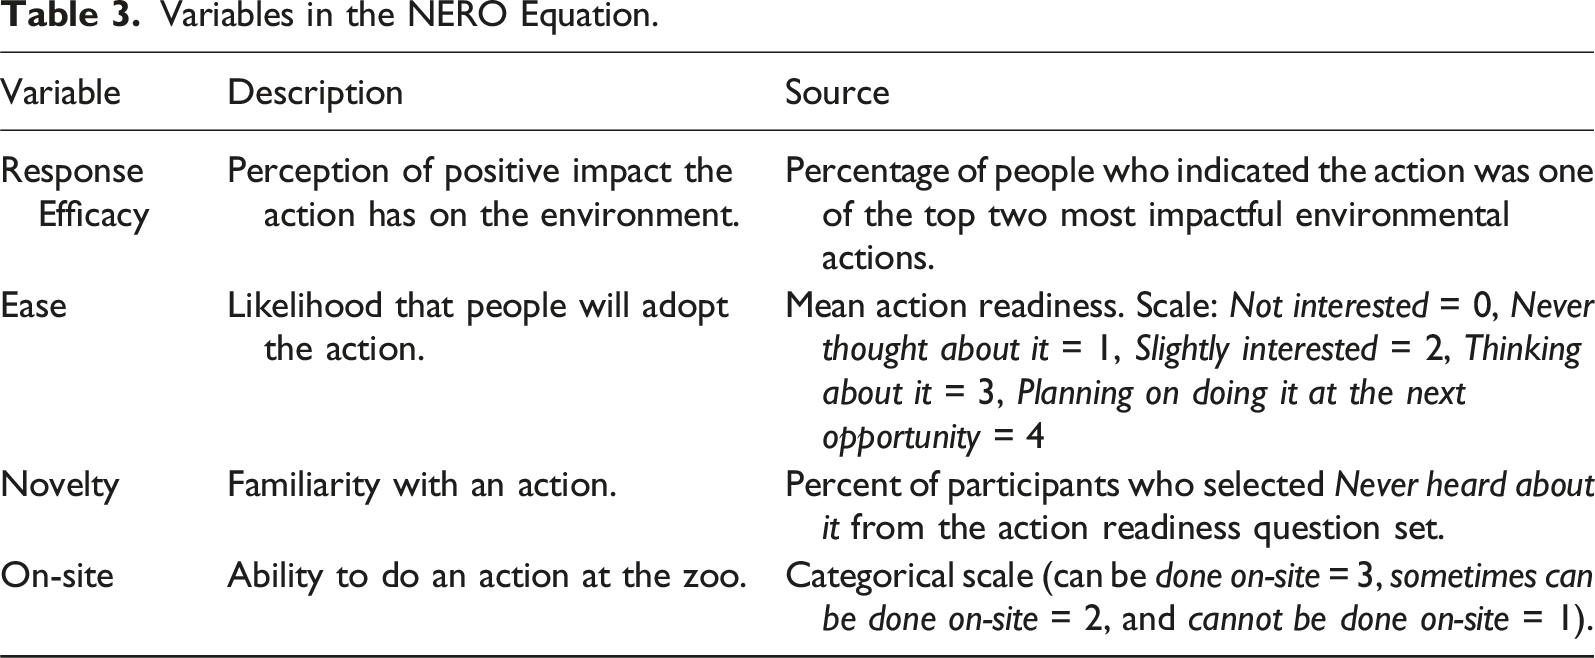
An alternative model, NERO, comes from research at Melbourne Zoo, which sought to identify the types of conservation actions visitors wanted to hear about (Kneebone et al., 2024; Smith et al., 2010a; Smith et al. 2012a). Visitors felt that the zoo should focus conservation messaging on behaviors that were new to them (Novel), easy to do (Easy), clearly linked to wildlife conservation (Response Efficacy), and could be done during their zoo visit (On-site) (2024; Smith et al., 2010a; Smith et al. 2012a). These studies inspired the strategies of several zoo conservation action campaigns. For example, in the mobile phone recycling campaign mentioned earlier, Zoos Victoria provided free mailers to zoo visitors, making the action easier (Litchfield et al., 2018). Melbourne Zoo received many more donations for fur seal conservation when the ask was incorporated into fur seal demonstrations than when the ask was just part of a static exhibit (Mellish et al., 2017). At the New York Aquarium, guests were encouraged to sign a petition to support the designation of the Hudson Canyon as a National Marine Sanctuary, highlighting a novel place that most guests were unaware of (Rank et al., 2024).
Modeling approaches like TTM, CBSM, and NERO have high potential to yield insight that will support conservation strategy. These three models are all based on the idea that the audience needs to be ready for the action for it to be successful: TTM explores the stages of readiness, CBSM incorporates likelihood to do an action, and NERO includes the ease of doing the action. This study explored how a zoo can use decision-making equations informed by their audiences, hypothesizing that feedback from visitors, community members, and employees will increase participation in the action and overall environmental impact.
Study Context
We conducted this study at the Queens Zoo, which is operated by the Wildlife Conservation Society (WCS) and welcomes over 250,000 visitors per year to its 18-acre facility in New York City. The majority of visitors are local to Queens (67%), Kings (9%), and Nassau (12%) counties (Rank & Roberts, 2022). Queens is celebrated as one of the most linguistically, racially, ethnically, culturally, and economically diverse counties in the world (Mcgovern & Frazier, 2015; Perlin et al., 2021). Queens, like much of NYC, faces many environmental challenges, such as flooding, excessive heat, litter, and poor air quality (City of New York, n.d.). Queens Zoo regularly emphasizes conservation action in its messaging at animal exhibits and in programs and aims to ensure that these messages are relevant, actionable, and lead to impact.
We used a two-phase mixed-methods design (Punch, 2014). Phase 1 took place in Summer and Fall (2023) and aimed to identify conservation actions that were most relevant to a range of audiences. We did a content analysis of conservation actions (May 2023), then conducted a survey of zoo educators (June 2023), interviews with Queens Zoo visitors (July 2023), and focus groups with community members (September 2023) to identify local conservation priorities. We explored these actions more deeply in Phase 2, fielding an online survey with residents of the NYC metro area in February 2024 to measure participation and perceived barriers and benefits of those eight conservation actions. We used results from this survey to assign numeric values for each action to the variables in decision-making equations, ranking the actions relative to each other to inform the zoo’s strategy. The WCS IRB (FWA #00016913) reviewed and approved all research materials and protocols.
Phase 1: Identifying Local Conservation Priorities
Methods
Content Analysis
We sourced a list of over 140 conservation actions identified by the Denver Zoo Conservation Alliance (Nageotte, 2023), consolidated similar conservation actions, removed actions not relevant for NYC residents (e.g., xeriscaping), and removed ubiquitous actions (e.g., recycling), to create a smaller list of 28 conservation actions. The actions reflected five overarching conservation themes recognized in zoo-based research, signifying that our reduced list was appropriately distributed among types of conservation actions (Maynard et al., 2020; Nageotte et al., 2024; Smith et al., 2012b). We used the 28-item list (Appendix A) in Phase 1 data collection and analysis.
Zoo Educator Survey
We invited educators from the Queens Zoo and WCS’s network of NYC wildlife parks to take a 7–10-min survey about the 28 conservation actions identified in the content analysis. Zoo educators have extensive experience interacting with NYC residents who are a large proportion of our visitors and program attendees (Rank & Roberts, 2022).
The survey asked respondents to select the top three actions that they felt NYC residents would consider to be: novel, easy to do, high conservation impact, and effectively messaged at the zoo. We selected these four characteristics to align with the NERO model research (Smith et al., 2010b; Smith et al., 2012a) that indicated zoo visitors’ preferences for conservation actions. The CBSM decision-making equation also accounts for ease of the action and which actions are relevant to audiences.
We posted an invitation and survey link on an internal message board accessed regularly by approximately 120 Education Department staff members. We kept the survey open for two weeks, posting a reminder on the same message board after one week. Forty-two staff members took the survey (35% response rate). To reduce survey length, we programmed the survey so that each respondent would see either items 1 to 14 or items 15 to 28, with the set viewed assigned randomly at survey launch. In our final sample, 18 respondents answered items 1 to 14; 24 respondents answered items 15 to 28. We summed the votes for each conservation action across all four characteristics, generating a ranked list from most to fewest number of votes.
Zoo Visitor Interviews
We developed a gameshow-inspired activity to prompt informal interviews with Queens Zoo visitors about environmental behaviors. The format of the game mimicked a typical zoo activity station with hands-on interaction facilitated by a trained interpreter who engaged in dialogue with visitors. Visitors spun a wheel to select one of seven questions about environmental behaviors, strategies, technologies, or issues. While children often spun the wheel, we only interviewed adults in the group. Three questions asked about their current practices taking care of the environment and four questions prompted visitors to think about eco-friendly cities, unique environmental products, getting rid of pollutants, and being an environmental superhero.
We styled the engagement similar to other live interpretation activities at zoos or aquariums, allowing guests to approach the station based on their interest. Anyone who approached was invited to participate in the game and asked follow-up questions as part of the activity, with consent waived given the format. The researcher posed the question, wrote down responses, and asked follow-up questions. Interactions took two to 4 minutes. We interviewed 28 adult visitors over approximately 4 hours. We coded the interviews using the 28 conservation actions from the content analysis (Appendix B).
Community Focus Groups
We conducted two focus groups with 24 Queens residents who were not regular zoo visitors to discuss conservation actions relevant to them. We recruited participants in partnership with a local community-based organization that provides workforce development and other support for residents. We conducted the focus groups at the partner location and provided food, beverages, and small thank you gifts for participating.
The focus group protocol included questions about what participants thought their neighborhoods did well with their environment, local environmental problems, possible solutions to those problems, and how the Queens Zoo can support these solutions. Participants reflected individually and discussed their answers with others before sharing with the full group.
Each focus group took 1 hour. Focus group 1 included 11 participants and was conducted in Spanish and English, with Spanish interpretation provided by the community-based organization partner. Focus group 2 included 13 participants and was conducted in English. One researcher facilitated the discussion, one researcher took notes, and we audio recorded both sessions for transcription. We coded the focus groups using the 28 conservation actions identified in the content analysis.
Selecting Actions
We generated a combined list of high-priority actions from the zoo educator survey, zoo visitor interviews, and community focus groups. We identified actions that generated similar and different responses across the three audiences.
Results
For the educator survey, we identified the top ten actions that were endorsed most frequently for novelty, ease, response efficiency, and ability to be done on-site (Appendix B). The action with the most endorsements was advocating for the environment, followed by learning about wildlife and conservation. Installing energy efficient appliances, responsible hunting and fishing, and increasing green practices in businesses were selected the least often, possibly because they are infrequent behaviors or not relevant for many New Yorkers.
Ten conservation actions emerged from interviews with zoo visitors. Energy-efficient appliances, waste management, and plastic reduction came up most frequently (see Appendix C).
Focus group participants spoke about seven conservation actions. They prioritized managing waste and advocating for urban green space, describing the need for more trees, better-quality green space, and less pollution. They felt that volunteering with a conservation organization and learning about wildlife and conservation was important. Participants also spoke about the importance of green business practices and government responsibility, which they connected to advocacy.
High-Priority Conservation Actions Across Three Study Audiences.
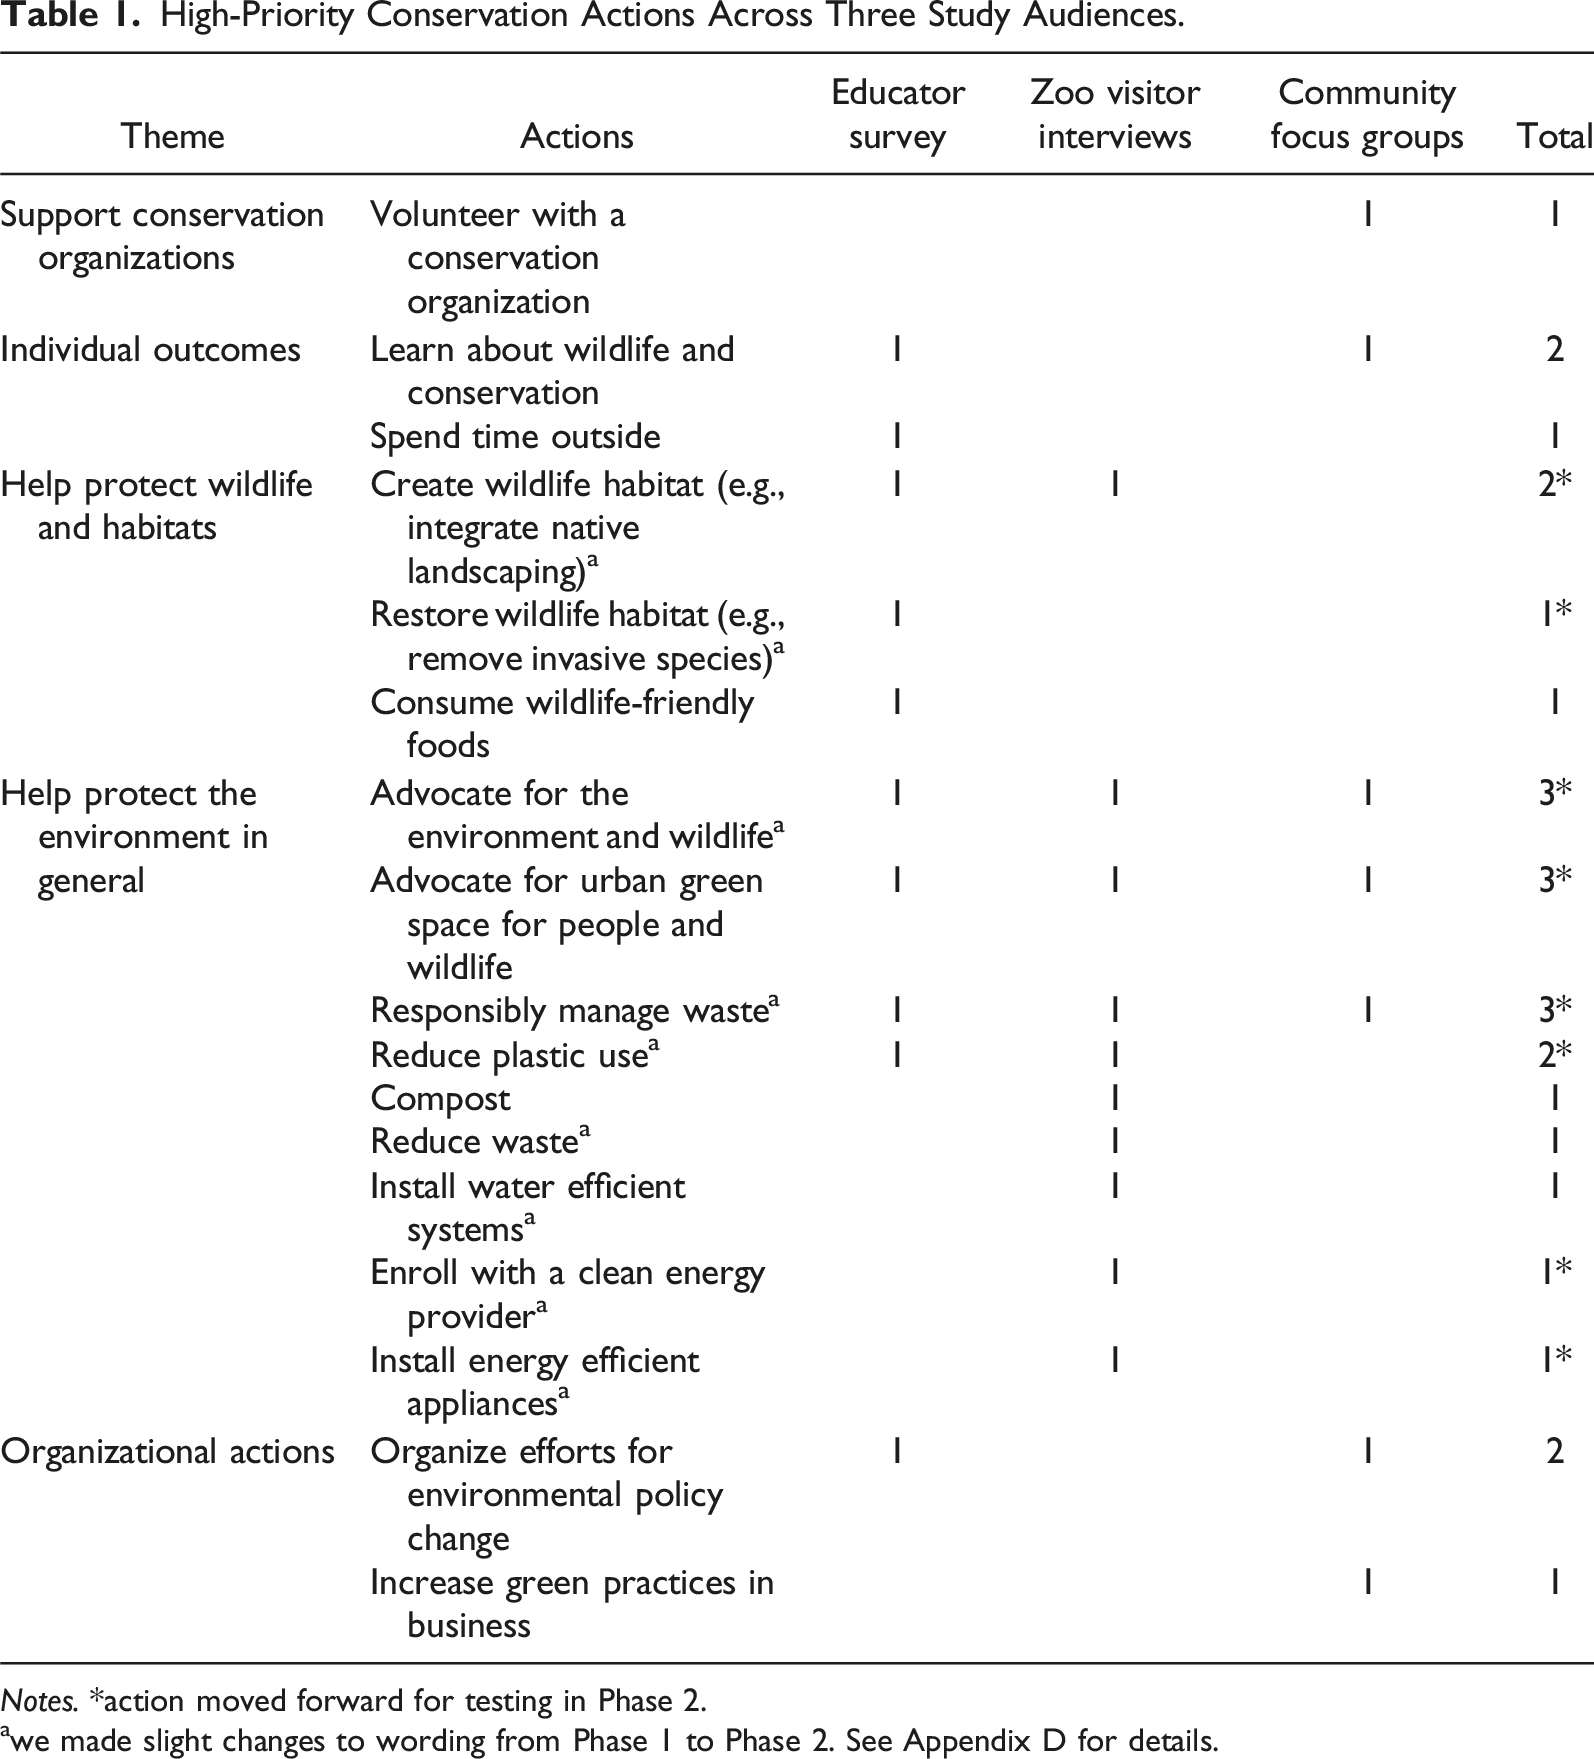
Notes. *action moved forward for testing in Phase 2.
awe made slight changes to wording from Phase 1 to Phase 2. See Appendix D for details.
We discussed the list with Queens Zoo leadership, focusing on how the themes and actions align with the zoo’s expertise and priorities. We aimed to select a subset of actions that Queens Zoo is well-positioned to support; these actions would be studied further in Phase 2.
Zoo leadership felt that the two advocacy actions – specifically for urban green space – reflected WCS’s expertise working with government officials to shape environmental policy. They also prioritized actions related to wildlife habitat; Queens Zoo is located in a city park, providing many opportunities to create and restore wildlife habitat for native plants and animals right outside the zoo gates. They prioritized two waste-reducing behaviors, recognizing that the public tends to focus on tangible and visible problems. They prioritized selecting a clean energy provider because natural gas powers almost half of NYC’s electricity and there have been a number of local programs to incentivize energy alternatives. A related action – selecting energy-efficient appliances – was also a priority, however, we modified this to “conduct an energy audit”; while an energy audit is not an environmental end-behavior, doing this action has the potential to lead to other environmental behaviors, (Burger, 1999) such as selecting more efficient appliances. These eight actions represented two of the five major themes and we advanced them to Phase 2 (Appendix D).
Phase 2: Creating and Applying Decision-Making Equations
Methods
We conducted an online survey of residents of the NYC metro area to understand current participation, readiness for, and interest in the conservation actions identified in Phase 1. We used the results of the survey to fill in the decision-making equations and rank conservation actions to inform Queens Zoo’s conservation action strategy.
Creation of Equation
CBSM uses equation (1) to identify conservation actions to focus on. We created a similar equation using NERO:
We used results from the public survey and other sources to assign values to each of the variables.
Data Sources
Survey Measures
Questions measured readiness to do an action and interest in actions. We included an attention check question in the survey to ensure data quality.
Screening Question
Participants shared the county where they live. Participants who lived in Brooklyn, Queens, and Nassau counties (the three counties where most Queens Zoo visitors live) were directed to continue the survey, all others were directed out of the survey.
Action Readiness Scale
Participants selected their current perceptions of or participation in each of the eight conservation actions using a seven-point Likert-scale with options extracted from the TTM (i.e. never thought about it, not interested, slightly interested, thinking about it, planning on doing it, already doing this) (Nageotte et al., 2024). We included a seventh option of does not apply to me (Nageotte et al., 2024).
Action Efficacy Scale
Participants selected two actions from the list of eight that they thought had the greatest positive impact on the environment. Knowing that an action is effective can help sway people to act (Smith et al., 2010a).
Demographics
Participants indicated age, number of children in household, annual household income, zip code, zoo membership status, and frequency of visiting the Queens Zoo. We asked about home ownership and type of residence (e.g., apartment, house) because these factors can be relevant for certain conservation actions.
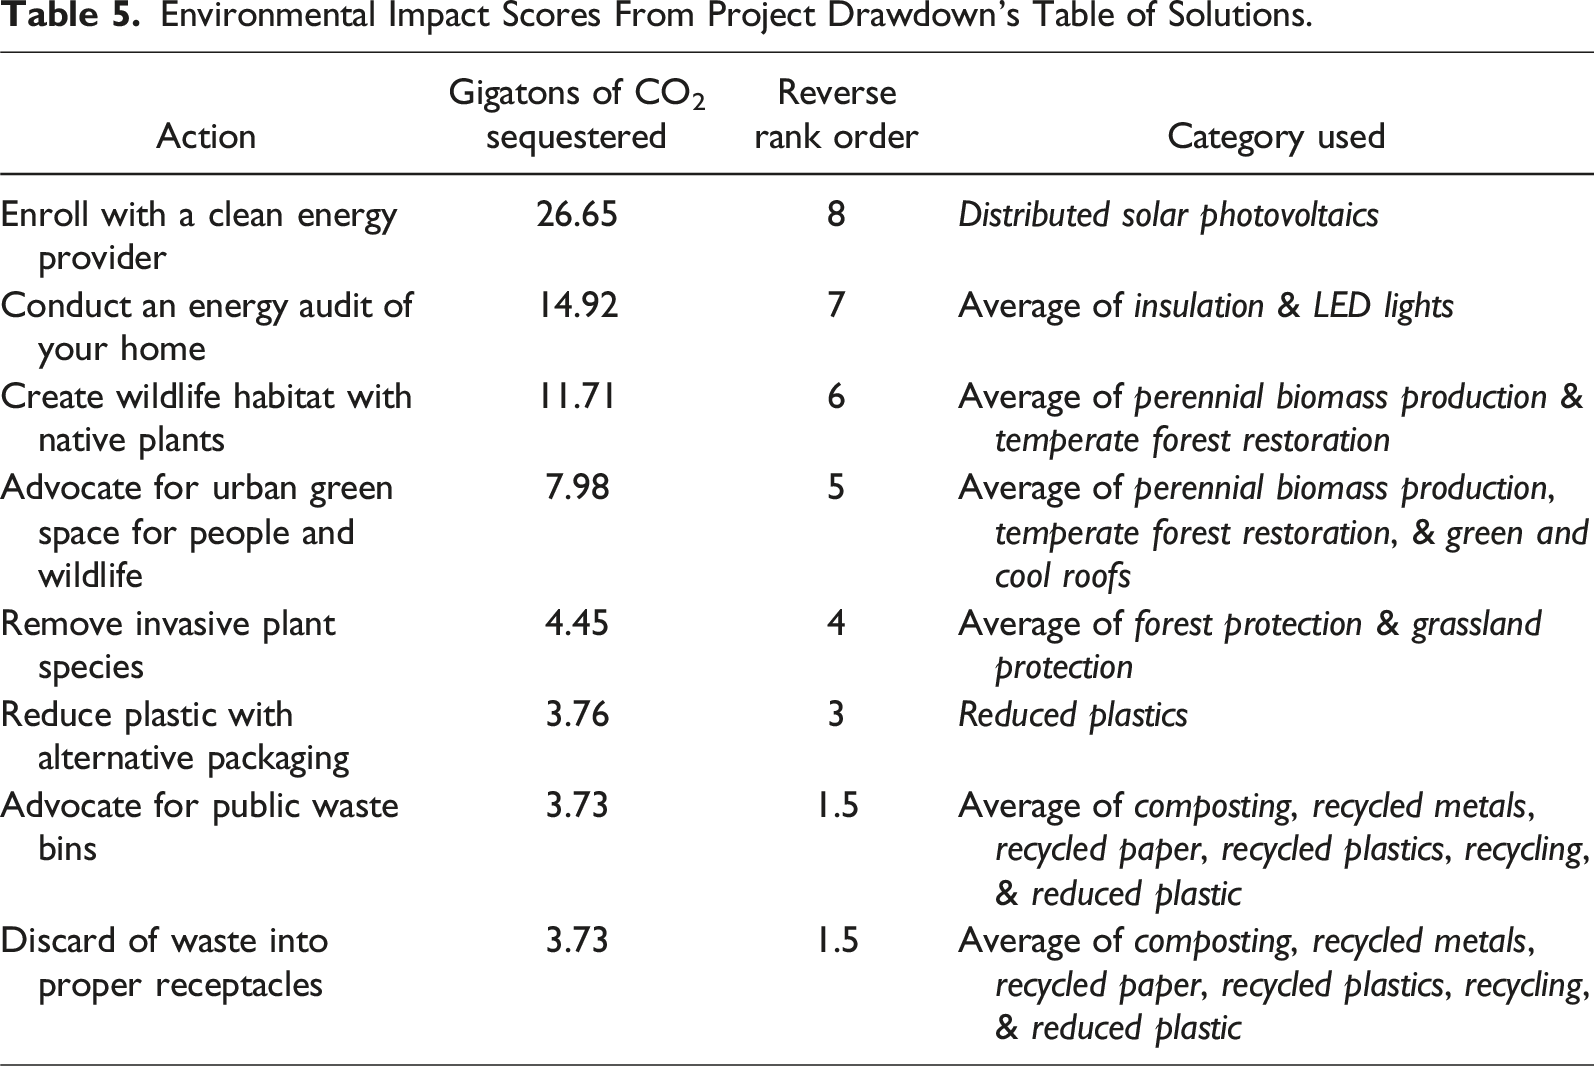
Environmental Impact
We calculated the value for impact using Project Drawdown (Table of Solutions, n.d.), a leading resource for climate solutions. The Table of Solutions includes estimates of the amount of carbon dioxide reduced or sequestered by a range of environmental actions. We used the value for the action most closely related to the action we tested (Appendix E).
Data Collection
We used Alchemer panel services to recruit 400 survey respondents from Queens, Brooklyn and Nassau counties, where most Queens Zoo visitors live. These counties have over six million residents and about 20% of them live with children under 18 in their household (US Census Bureau, 2023). This sample size allowed us to achieve a 95% confidence interval with a 5% margin of error (Maple Tech International, n.d.). We purposefully over-sampled for participants with children under 18 in their household because zoos attract audiences with children.
Survey Respondents
More participants were from Queens (40%), followed by Brooklyn (38%), and Nassau County (22%). Half the sample had children under 18 years of age living in their household; most (84%) of these participants had one or two children. A little more than half (57%) reported annual household incomes of less than $75,000 per year, which is less than the median household income for these three counties (US Census Bureau, 2023).
About half of the participants identified as white (44%) and 7% identified as Asian or Asian American; these race and ethnicities were unintentionally over- and under-sampled respectively. The remaining self-reported race and ethnicities reported were comparable to US Census data (US Census Bureau, 2023).
About half of participants lived in apartments (49%) and 35% in single-family homes; the remainder lived in multi-family homes, town homes, or another dwelling type. Almost half owned their primary residence (44%), similar to home ownership rates in these counties (US Census Bureau, 2023). Seventeen percent were members of WCS.
Data Analysis
Variables in the CBSM Equation.
Variables in the NERO Equation.
We calculated two scores for each of the eight conservation actions – one for CBSM and one for NERO – and then ranked the actions from highest to lowest for each decision-making equation.
Results
Values for Decision-Making Equations
Action Readiness
Respondents identified their relationship to the eight actions. Most felt that they were already discarding waste in proper receptacles and almost half felt like they were reducing plastic by purchasing items made from alternative materials (Figure 1). There were several behaviors where respondents were primarily in the contemplative and preparative stages (i.e., thinking about doing the behavior, but had not yet taken action), specifically advocating for more public waste bins and advocating for urban green space for people and wildlife, with around two-thirds of respondents indicating they were slightly interested, thinking about it, or planning on doing it. Removing invasive plant species was the least thought about action (14%) and almost as many participants (13%) felt this action did not apply to them, resulting in the lowest action readiness percentage. Action readiness responses. Note. Values less than 8% not shown.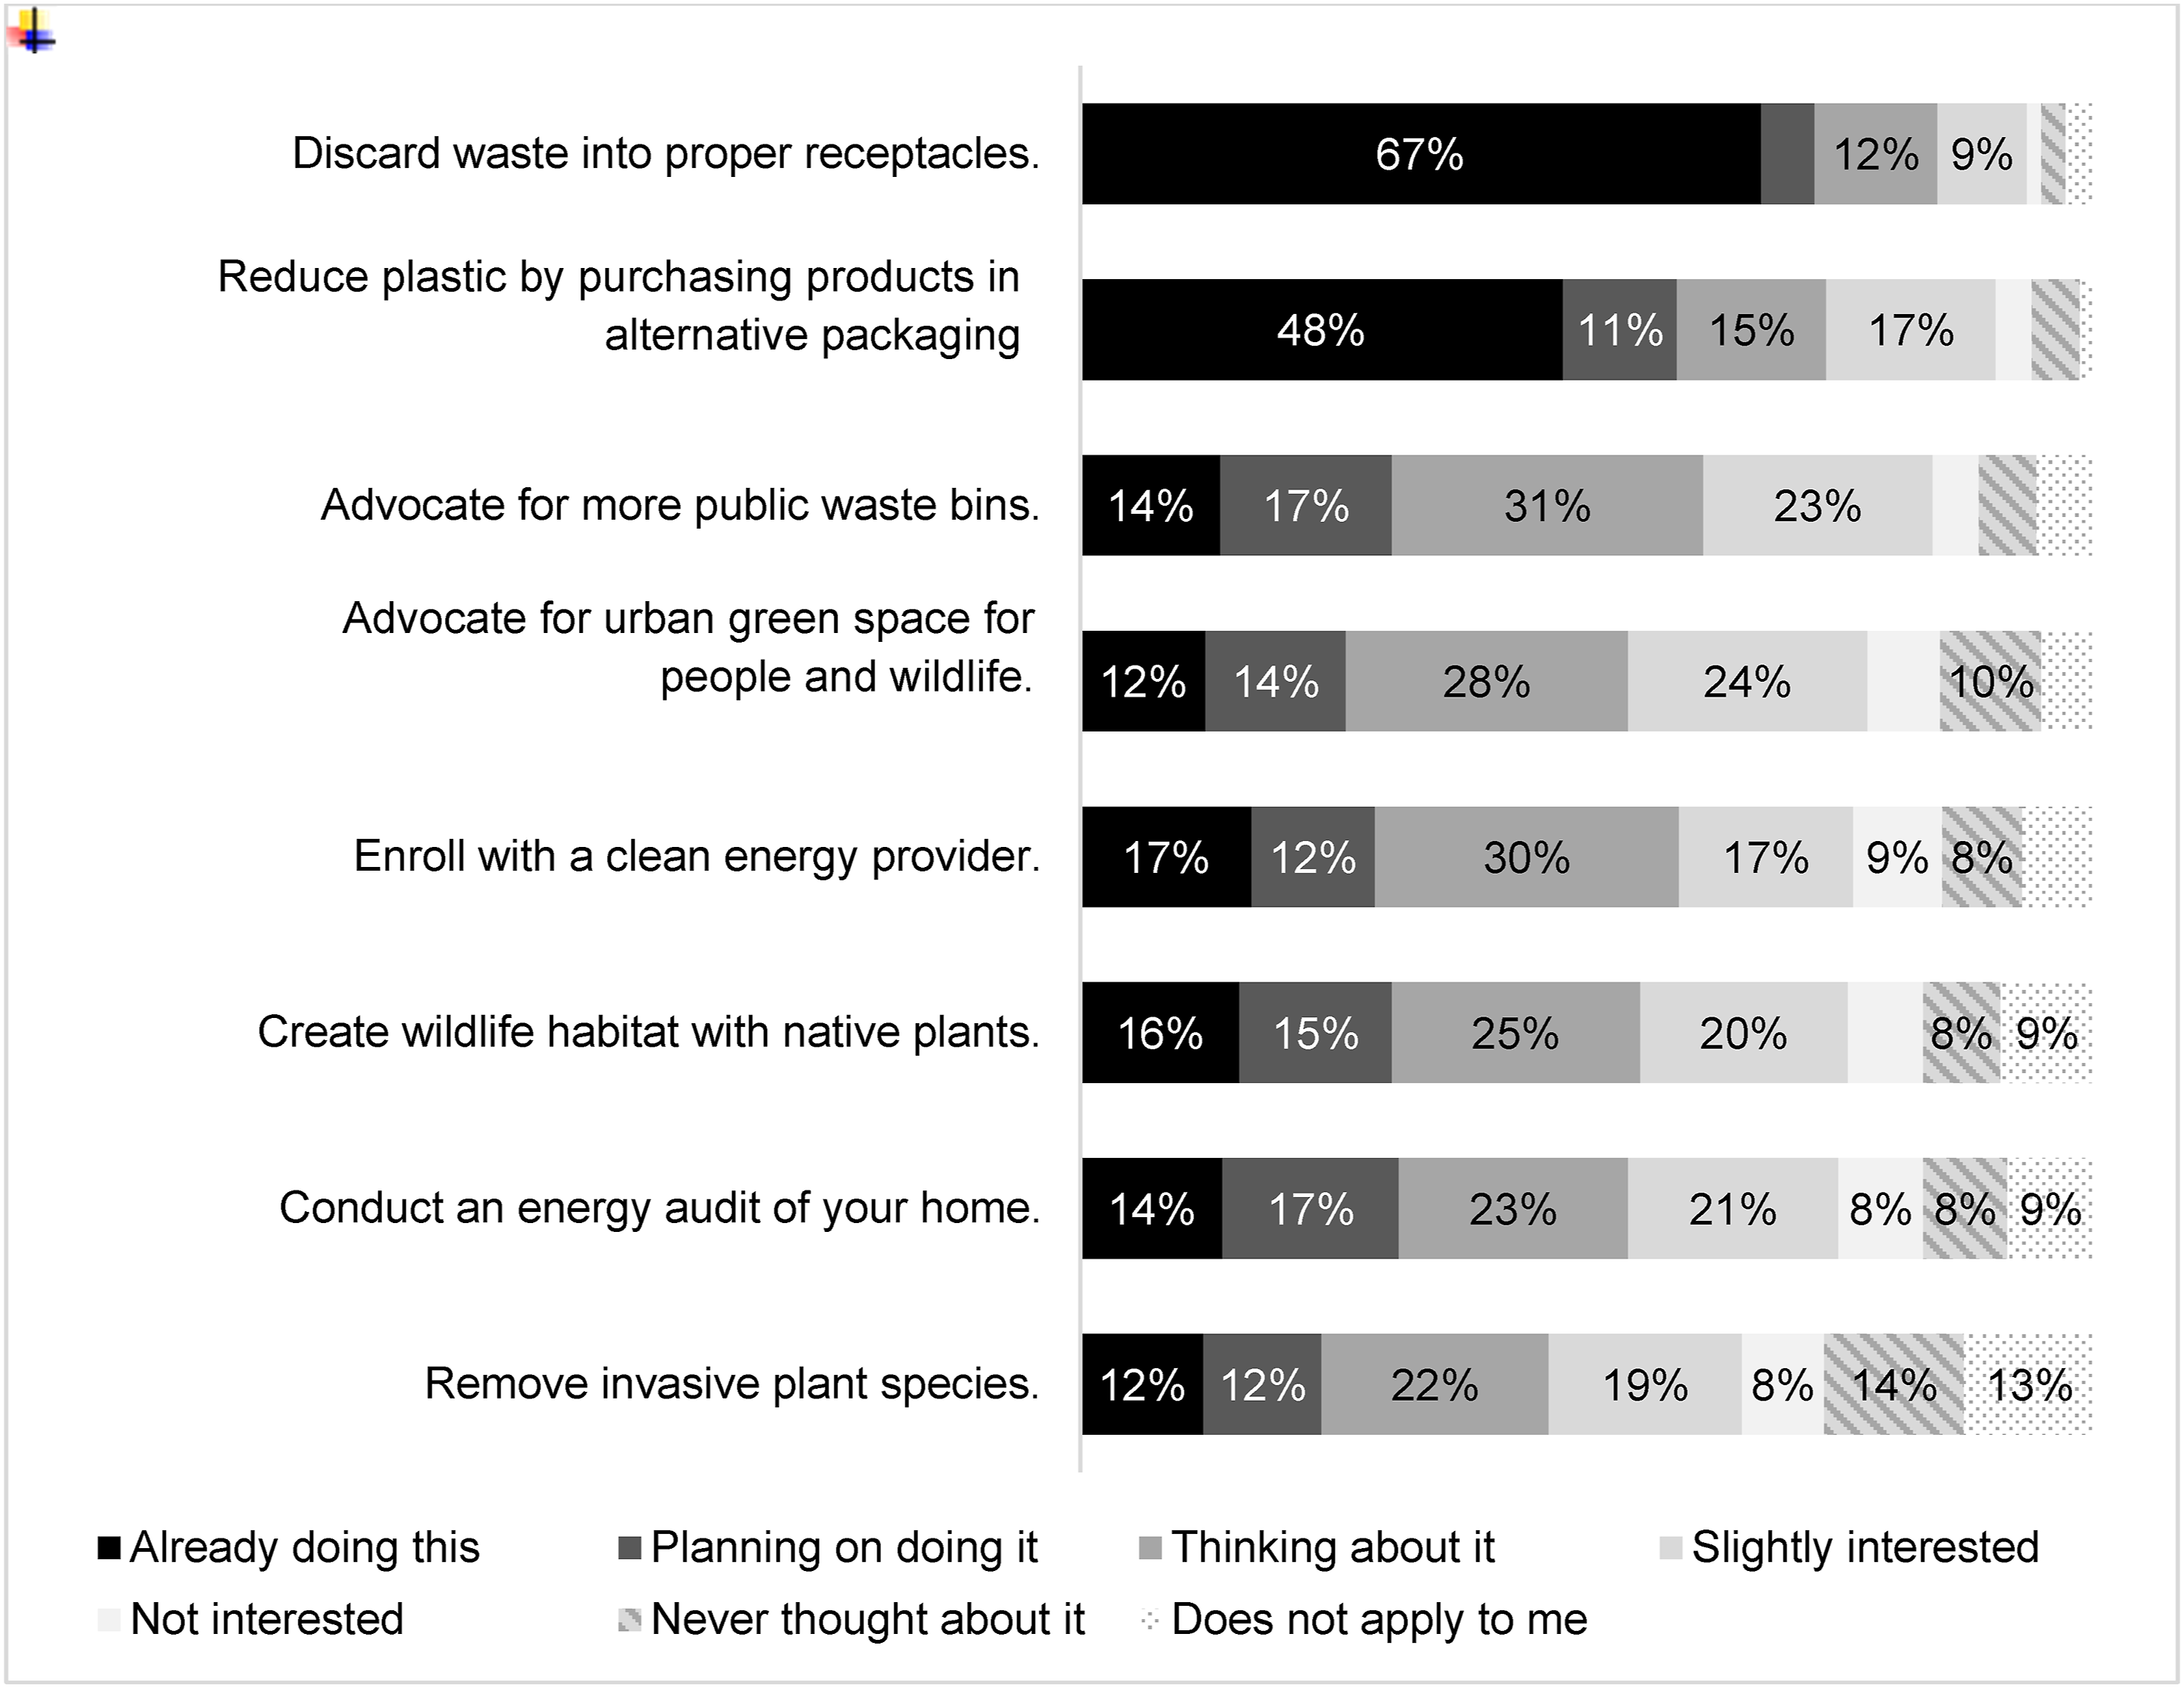
Action Efficacy
Values for Action Efficacy and On-Site Performance for Each Action.
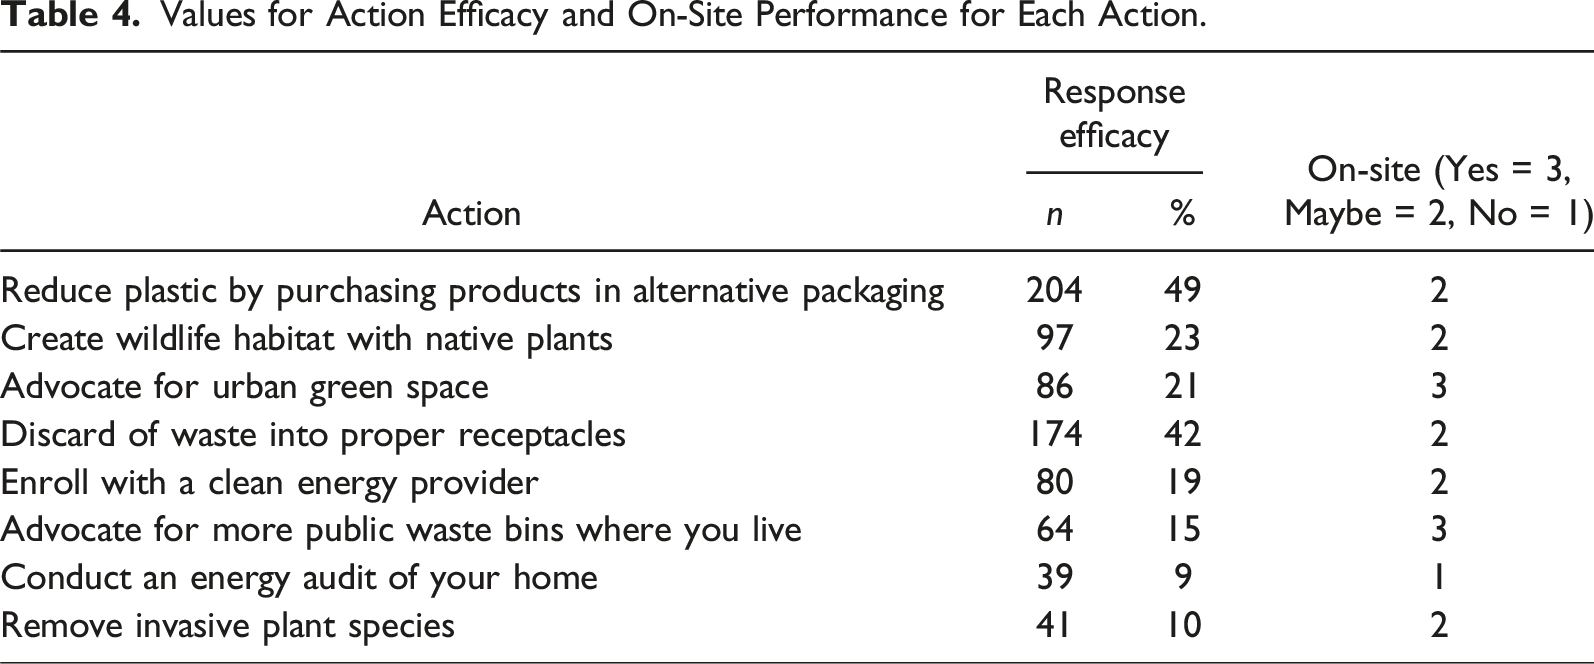
On-Site Performance
We determined that the two actions that involved advocacy could easily be done at a zoo by signing a petition (Table 4). Conducting an energy audit of one’s home can only be completed at one’s home. All other actions could be done on-site if the zoo provided the proper resources, such as purchasing items not packaged in plastic.
Estimated Environmental Impact
Environmental Impact Scores From Project Drawdown’s Table of Solutions.
Decision-Making Model Rankings
Overall Score and Ranks for Decision-Making Equations.
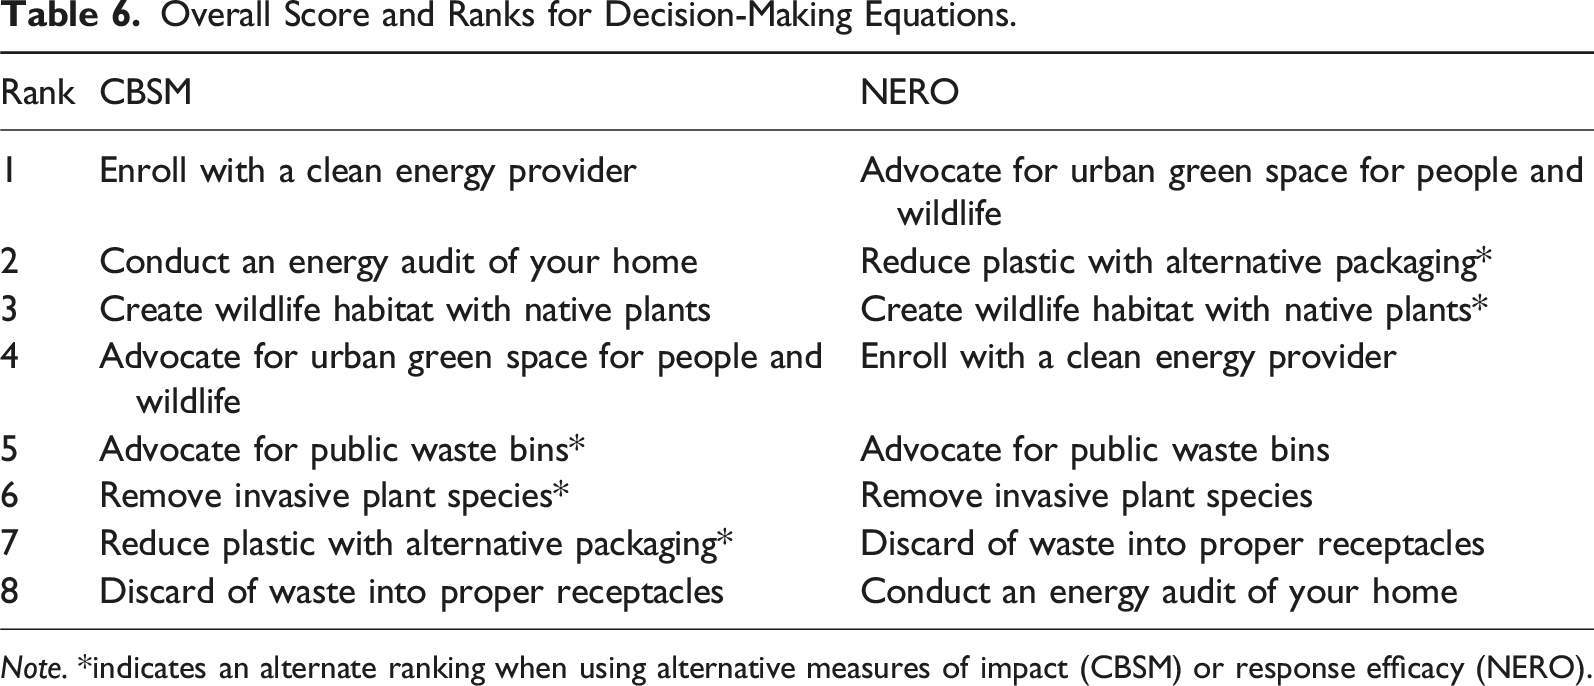
Note. *indicates an alternate ranking when using alternative measures of impact (CBSM) or response efficacy (NERO).
Aligning Actions with Zoo Priorities
We discussed the rankings with Queens Zoo leadership to consider how the zoo could support the community in taking these actions and their alignment with the goals and expertise of a wildlife conservation organization.
We identified creating wildlife habitat with native plants as an action where the zoo’s focused efforts could increase community participation and conservation impact. This action was ranked third by CBSM and second/third by NERO, making it one of the few that was highly-ranked by both models. The zoo is located in a 900-acre public park in Queens and a close relationship with the NYC Parks Department would provide many opportunities to support visitors in becoming more active stewards of the park, including both on and off zoo grounds.
We eliminated the other highly-ranked options based on lack of alignment with the zoo’s expertise. Although enrolling with a clean energy provider and conducting a home energy audit were the two highest-ranked actions using CBSM, the connection between these two energy reduction actions and wildlife conservation is not as direct as the other actions. While advocating for urban green space was ranked fourth using CBSM and first using NERO, we prioritized stewardship of the park where the zoo is located before identifying opportunities for new green space in the neighborhood. Reducing plastic with alternative packaging was ranked second using NERO but low using CBSM, likely because of the difference between measures of perceived impact (high) and actual impact (low); we decided not to focus on this action because we want to support not only participation, but actual impact. We identified creating wildlife habitat with native plants as the action that achieved this balance.
Discussion & Conclusions
Increasing participation in conservation actions relies on understanding the perspectives of potential participants. Soliciting feedback from a purposefully-sampled range of audiences is a common method to understand a particular phenomenon (Onwuegbuzie & Collins, 2007), in this case: what conservation actions are relevant to the Queens Zoo community? Hearing from zoo visitors, Queens community members, and a broader local audience helped ensure that their perspectives were integrated into the zoo’s strategy.
We used decision-making equations to weigh options against each other. The two equations, CBSM and the new NERO equation we tested, considered different factors when weighing conservation actions. CBSM includes true environmental impact (McKenzie-Mohr, 2011b), while NERO considered perceived environmental impact (response efficacy), a meaningful difference because the value that people attribute to their actions are not usually aligned with scientific consensus on environmental impact (Truelove & Parks, 2012; Wynes et al., 2020). In this study, the public focused on litter and plastic, however, according to Project Drawdown, clean energy is a better investment for the climate. We decided to prioritize creating wildlife habitat using native plants which is effective but people are not aware of its efficacy to support wildlife and benefit urban environments. Targeted messaging can help raise awareness about the actual efficacy of conservation actions to close the gap between the two.
Both equations allowed us to score conservation actions and rank them, which we were then able to compare and contrast while considering our organization’s strengths, assets, and resources. We believe that using both these decision-making equations will be useful for other organizations developing campaigns that consider their resources, their audiences, and potential impact. While collecting these data from audiences is time-intensive, these efforts can pay dividends by ensuring audience engagement while remaining true to mission and being realistic about resources.
One limitation of this study included using Project Drawdown’s values to measure CO2 sequestered for each action; while we used the best match based on the information available, the alignment was not always perfect. Additionally, the gigatons of carbon sequestered for each solution listed was calculated on a global scale and does not represent the scale of actions at a community level in a particular ecological, political, economic, and social context. However, when we used the inverse rank of the gigatons sequestered, the results did not change significantly, highlighting that smaller order values did not change the outcome of the rankings. An alternative method of calculating impact is to ask experts to weigh in and rate the impact of the actions.
Another limitation was the reliance on open-ended conversations with zoo visitors and Queens residents, which prioritizes issues that were top-of-mind for these audiences. These environmental issues did not always align with larger environmental issues (Truelove & Parks, 2012; Wynes et al., 2020). For example, although Queens has been subjected to several devastating floods in the last few years, causing significant damage and loss of human life, participants in the focus groups did not bring up the problem themselves. In other words, this issue was not top-of-mind. Generally, we saw discrepancies in how zoo visitors, Queens community members, and the larger public prioritized conservation actions compared with Project Drawdown’s measurements of solutions.
This research aimed to identify high-impact conservation actions for the Queens Zoo to integrate into messaging, campaigns, and programs. The first phase of the project identified actions that staff, zoo visitors, and Queens community members felt were the most relevant. To select conservation actions for the Queens Zoo to focus on with its community came down to discussing the results of the decision-making equations and what made sense for Queens Zoo given its history, assets, resources, and partnerships. Staff from the Queens Zoo agreed that the action that made the most sense to focus on over the next three to five years was creating wildlife habitat using native plants. We suggest that as zoos continue to engage communities around them they collect data to build decision-making equations and use both the CBSM and NERO models to identify actions to prioritize. Using decision-making equations to drive priorities ensures that zoos are acting in partnership with communities and in ways that leverage their expertise.
Footnotes
Author’s Notes
Laura Velázquez is now at the New York Hall of Science.
Acknowledgements
The authors thank Craig Piper and Karen Tingley of the Wildlife Conservation Society for their unwavering support for this research and in the power of zoos to foster a more sustainable planet.
Ethics Considerations
The Wildlife Conservation Society’s IRB (FWA #00016913) reviewed and approved all research materials and protocols finding that the research activity was exempt from IRB-review on May 31, 2023 (Ref #23-33).
Consent to Participate
Zoo Educator and Public Surveys: Participants were informed of the estimated completion time (7–10 minutes for the educator survey, 10–15 minutes for the public survey), that the survey was anonymous and minimal risk, and that they could skip any questions or stop participating at any time. They were informed that results will be shared in aggregate through reports, conference presentations, and journal articles. Consent was confirmed online with a clickable “I agree” option following consent. Zoo Visitor Interviews: Informed consent was waived because the questions were minimal risk to participants and the study could not practicably be carried without a waiver, given its format as a live interpretation activity. Community Focus Groups: Participants were informed of the time commitment (1 hour for focus groups), that what they shared would be anonymized, that questions were minimal risk, that they could skip any questions or stop participating at any time. They were informed that results will be shared in aggregate through reports, conference presentations, and journal articles. Focus group participants were also informed about compensation for their time. Consent was confirmed verbally.
Funding
The authors received no financial support for the research, authorship, and/or publication of this article.
Declaration of Conflicting Interests
The authors declared no potential conflicts of interest with respect to the research, authorship, and/or publication of this article.
Data Availability Statement
The datasets generated during and analyzed during the current study are available from the corresponding author on reasonable request.
Author Biographies
Appendix
Conservation actions used in the zoo educator survey and corresponding themes.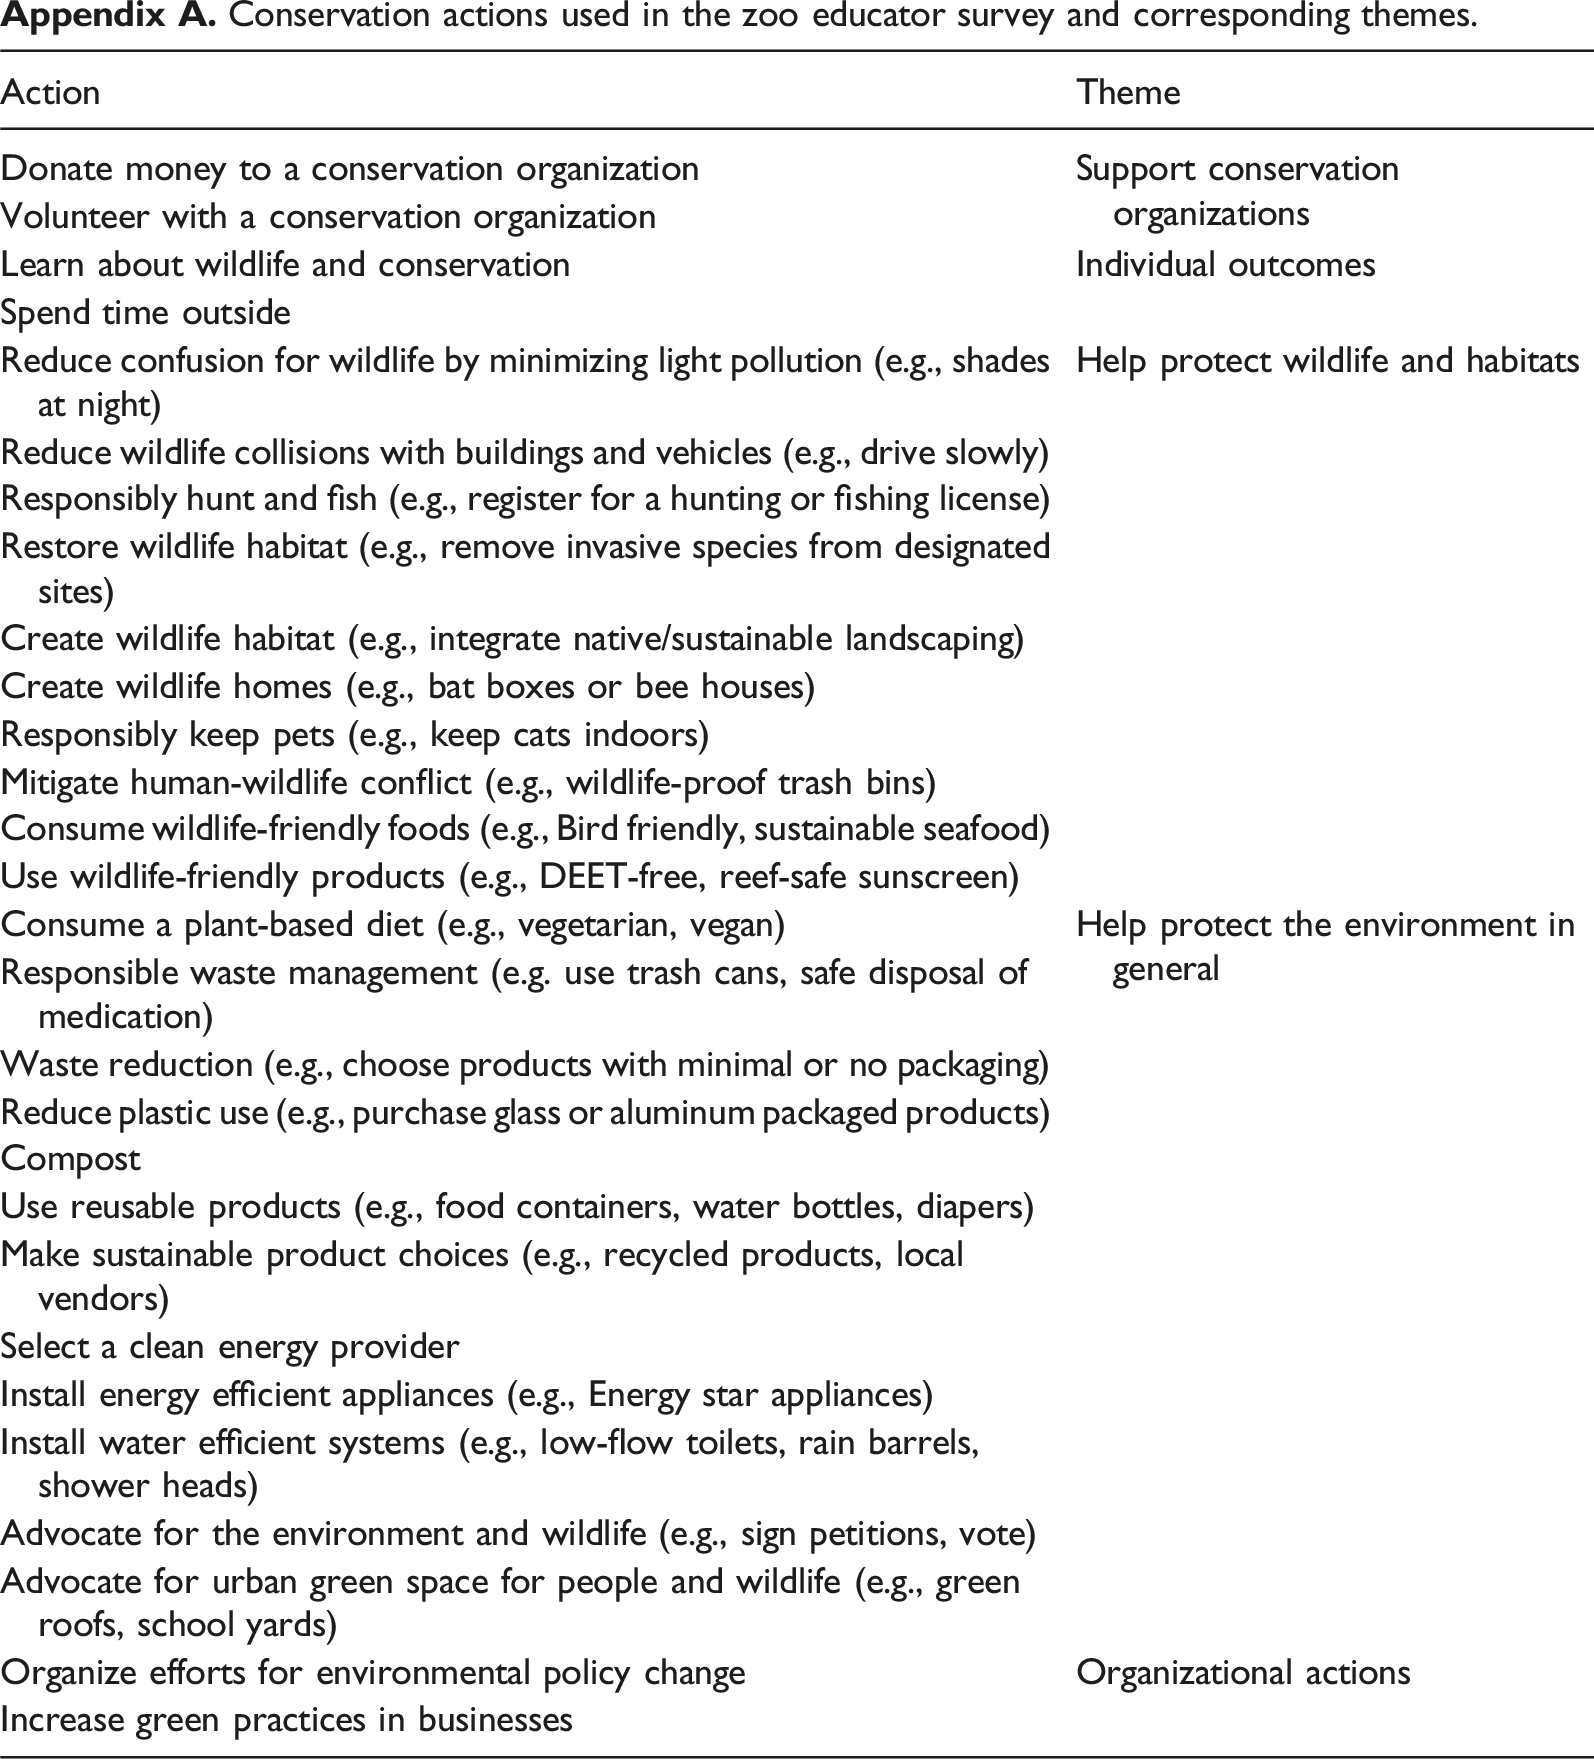
Action
Theme
Donate money to a conservation organization
Support conservation organizations
Volunteer with a conservation organization
Learn about wildlife and conservation
Individual outcomes
Spend time outside
Reduce confusion for wildlife by minimizing light pollution (e.g., shades at night)
Help protect wildlife and habitats
Reduce wildlife collisions with buildings and vehicles (e.g., drive slowly)
Responsibly hunt and fish (e.g., register for a hunting or fishing license)
Restore wildlife habitat (e.g., remove invasive species from designated sites)
Create wildlife habitat (e.g., integrate native/sustainable landscaping)
Create wildlife homes (e.g., bat boxes or bee houses)
Responsibly keep pets (e.g., keep cats indoors)
Mitigate human-wildlife conflict (e.g., wildlife-proof trash bins)
Consume wildlife-friendly foods (e.g., Bird friendly, sustainable seafood)
Use wildlife-friendly products (e.g., DEET-free, reef-safe sunscreen)
Consume a plant-based diet (e.g., vegetarian, vegan)
Help protect the environment in general
Responsible waste management (e.g. use trash cans, safe disposal of medication)
Waste reduction (e.g., choose products with minimal or no packaging)
Reduce plastic use (e.g., purchase glass or aluminum packaged products)
Compost
Use reusable products (e.g., food containers, water bottles, diapers)
Make sustainable product choices (e.g., recycled products, local vendors)
Select a clean energy provider
Install energy efficient appliances (e.g., Energy star appliances)
Install water efficient systems (e.g., low-flow toilets, rain barrels, shower heads)
Advocate for the environment and wildlife (e.g., sign petitions, vote)
Advocate for urban green space for people and wildlife (e.g., green roofs, school yards)
Organize efforts for environmental policy change
Organizational actions
Increase green practices in businesses
Most frequently endorsed conservation actions by zoo educators.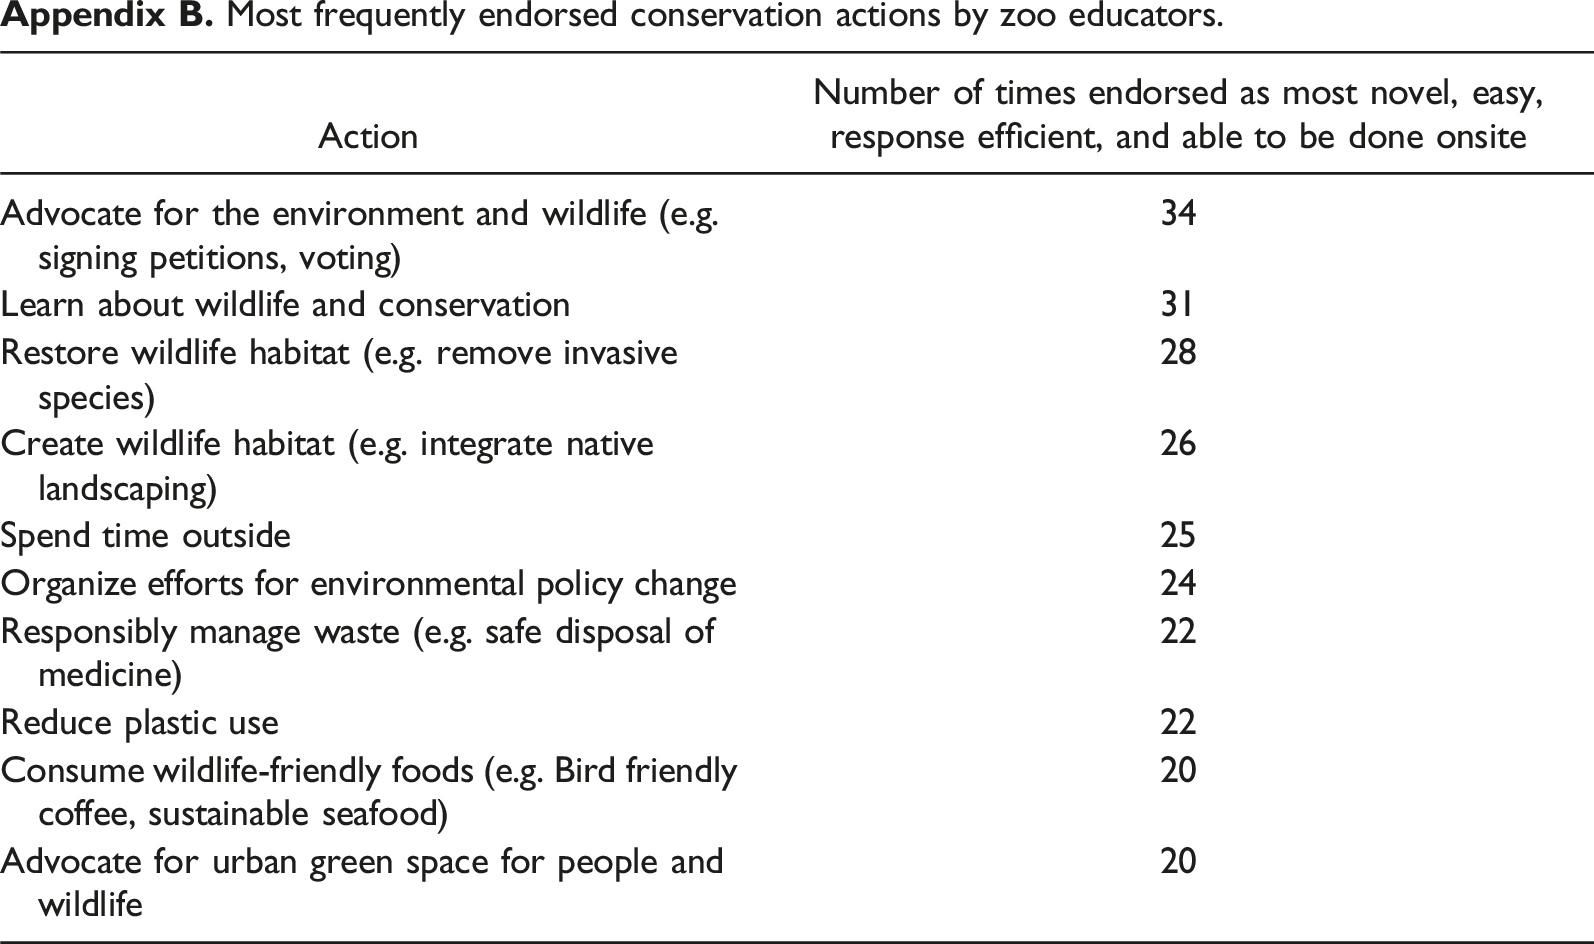
Action
Number of times endorsed as most novel, easy, response efficient, and able to be done onsite
Advocate for the environment and wildlife (e.g. signing petitions, voting)
34
Learn about wildlife and conservation
31
Restore wildlife habitat (e.g. remove invasive species)
28
Create wildlife habitat (e.g. integrate native landscaping)
26
Spend time outside
25
Organize efforts for environmental policy change
24
Responsibly manage waste (e.g. safe disposal of medicine)
22
Reduce plastic use
22
Consume wildlife-friendly foods (e.g. Bird friendly coffee, sustainable seafood)
20
Advocate for urban green space for people and wildlife
20
Zoo visitors’ top of mind conservation actions.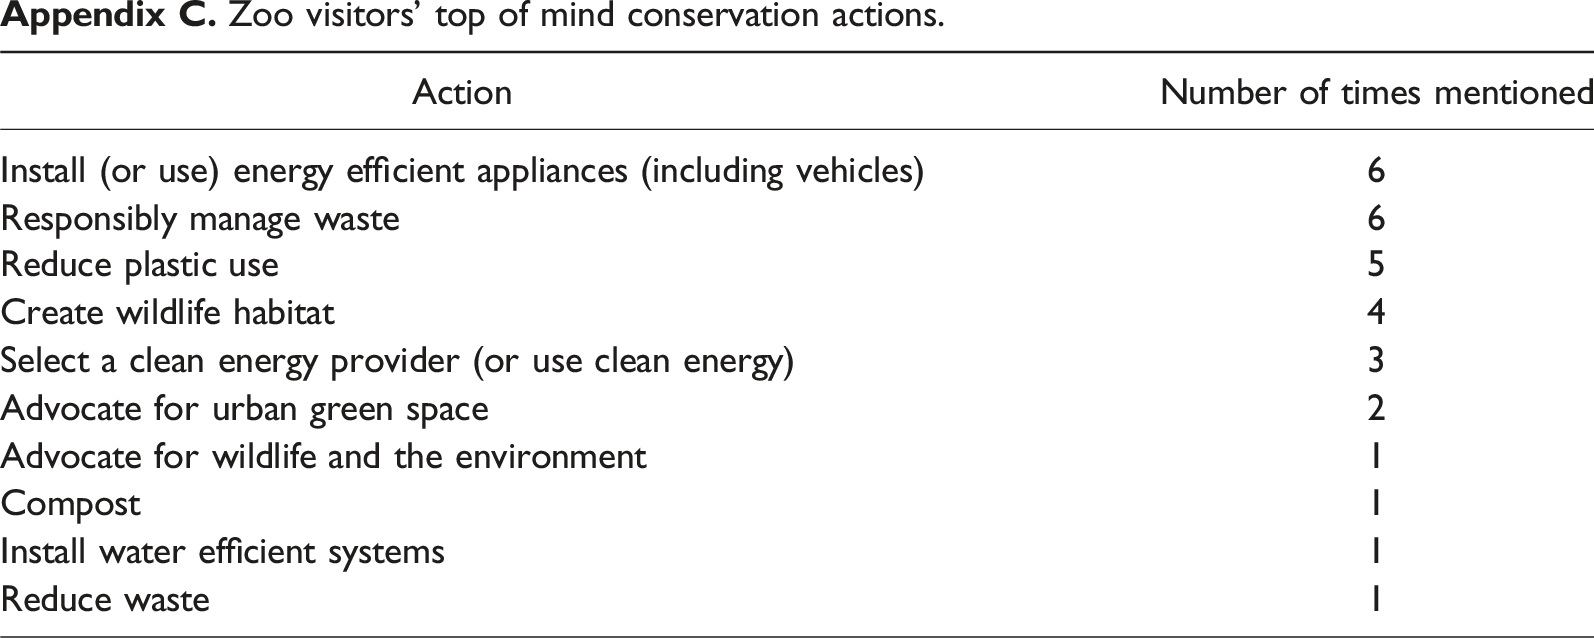
Action
Number of times mentioned
Install (or use) energy efficient appliances (including vehicles)
6
Responsibly manage waste
6
Reduce plastic use
5
Create wildlife habitat
4
Select a clean energy provider (or use clean energy)
3
Advocate for urban green space
2
Advocate for wildlife and the environment
1
Compost
1
Install water efficient systems
1
Reduce waste
1
Conservation actions used in Public Survey, original actions, and the rationale for updating the action and why we decided it would move forward.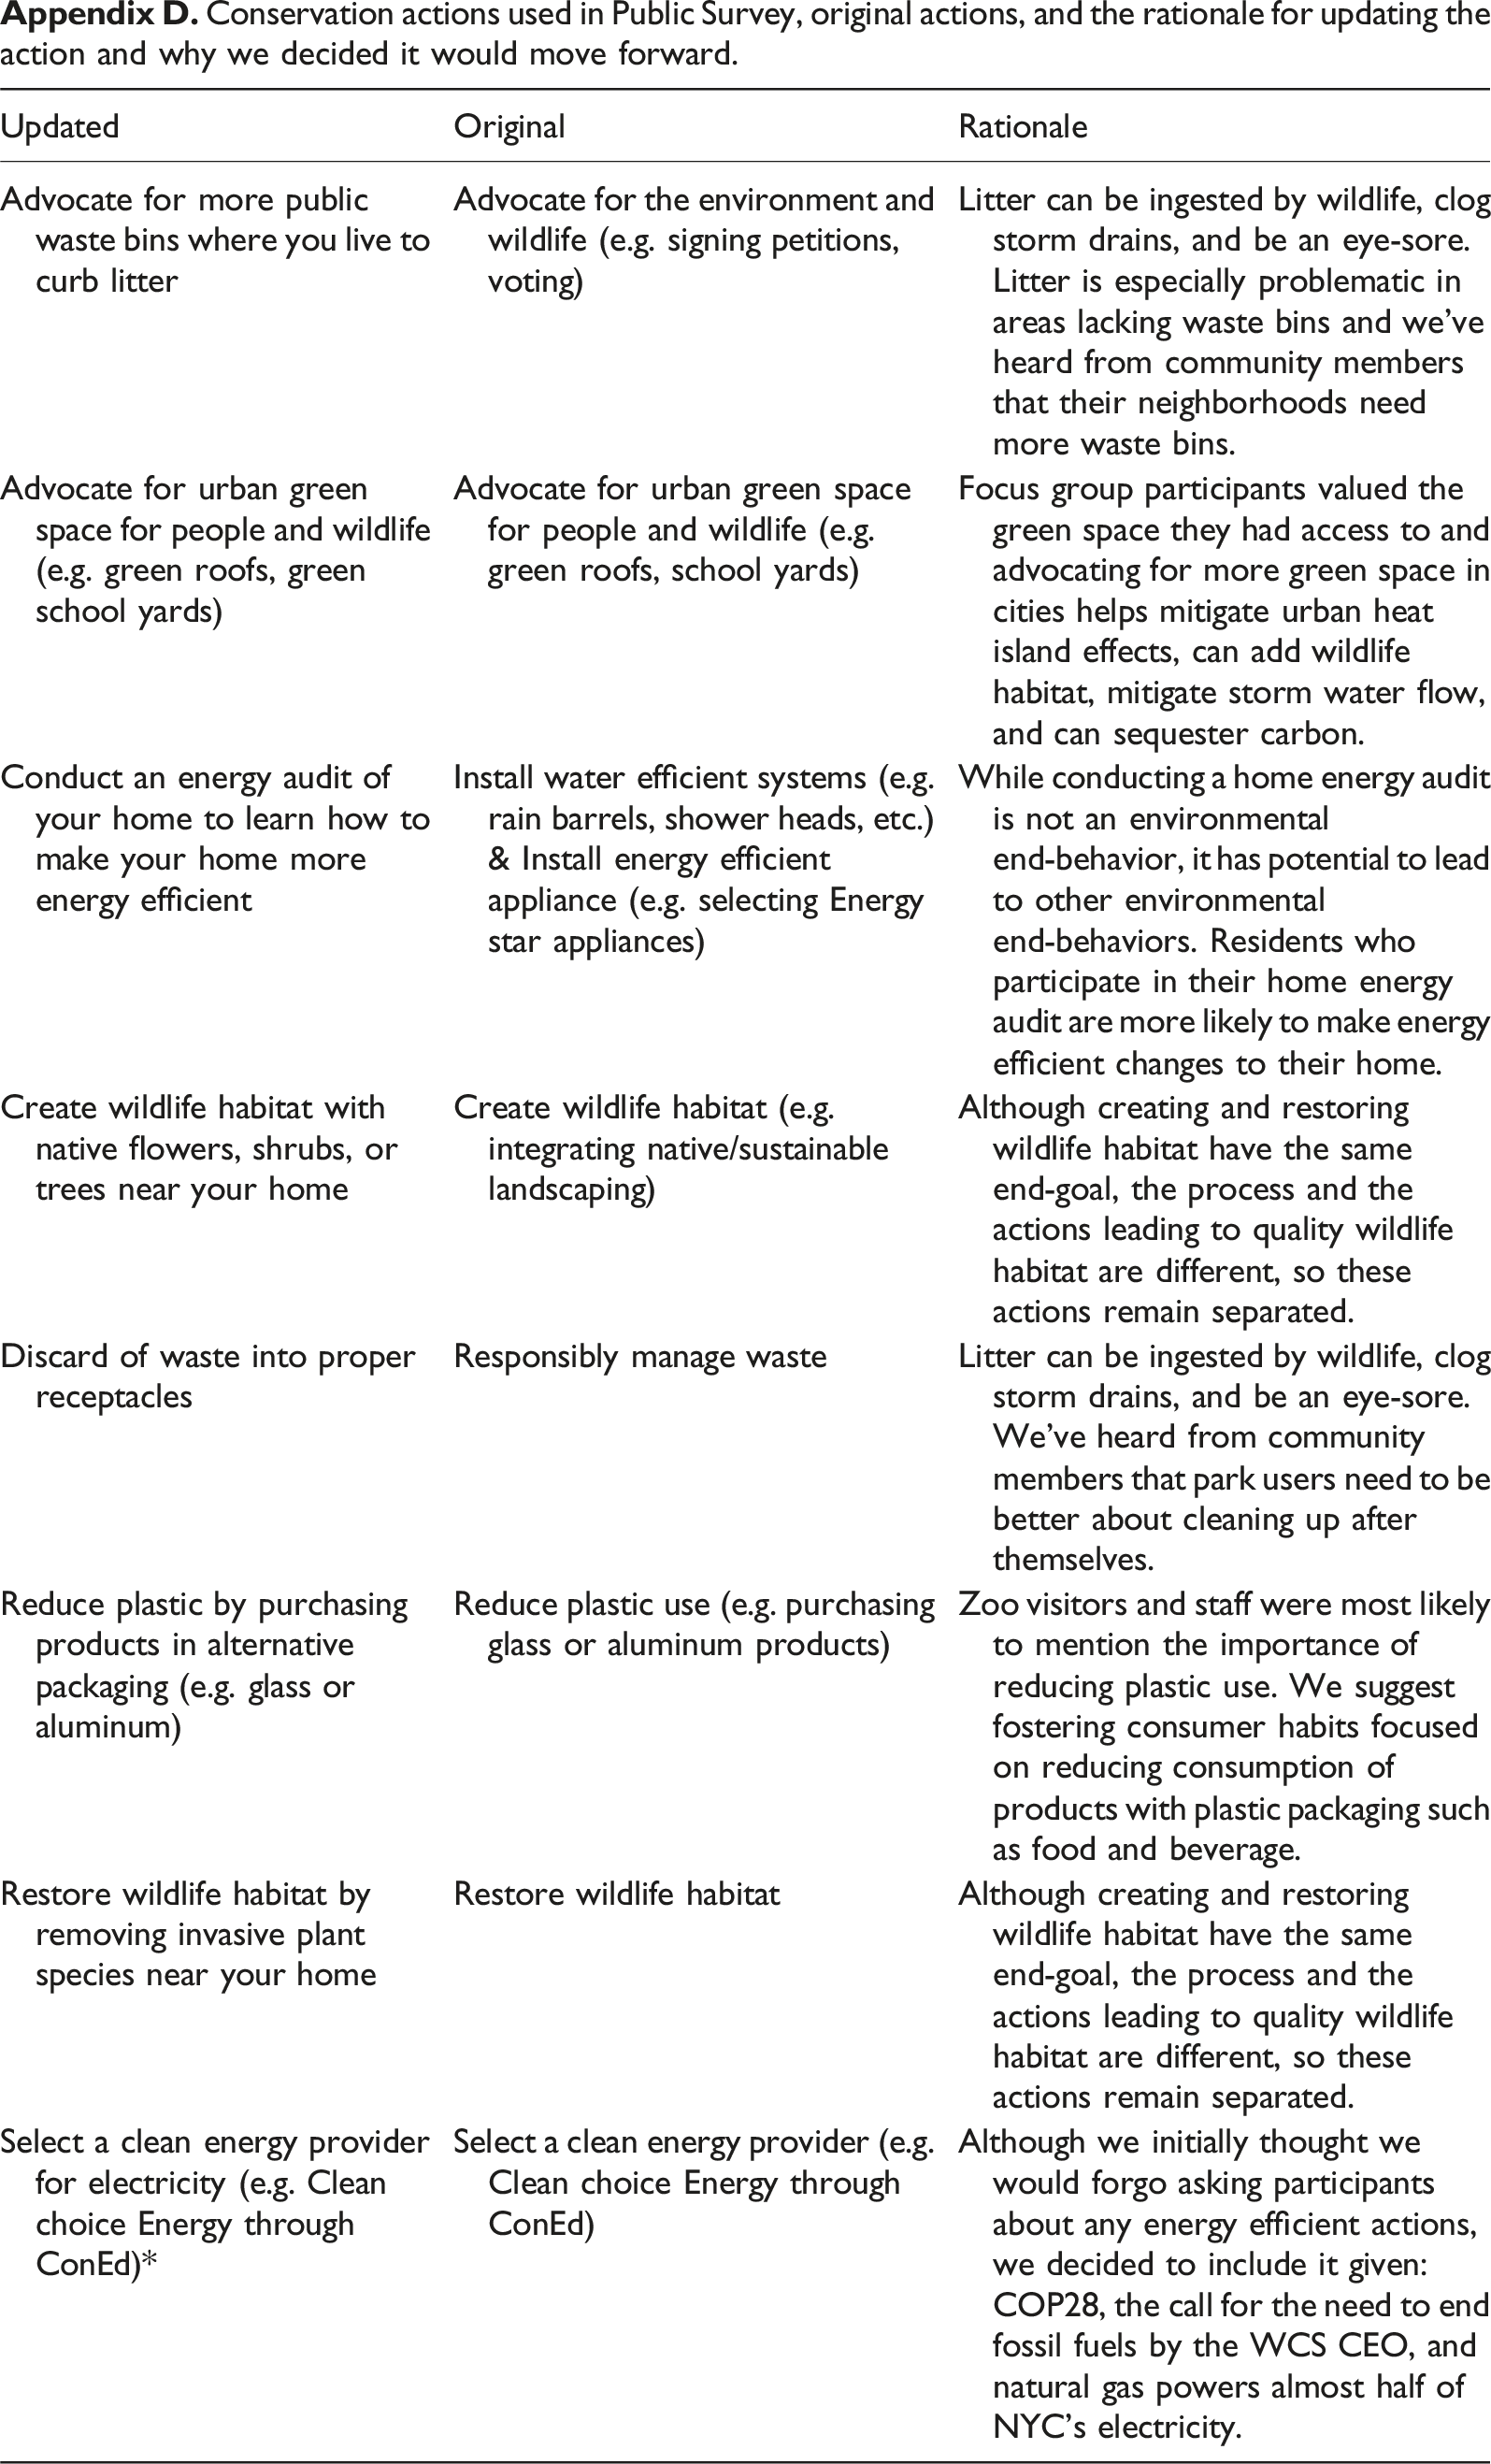
Updated
Original
Rationale
Advocate for more public waste bins where you live to curb litter
Advocate for the environment and wildlife (e.g. signing petitions, voting)
Litter can be ingested by wildlife, clog storm drains, and be an eye-sore. Litter is especially problematic in areas lacking waste bins and we’ve heard from community members that their neighborhoods need more waste bins.
Advocate for urban green space for people and wildlife (e.g. green roofs, green school yards)
Advocate for urban green space for people and wildlife (e.g. green roofs, school yards)
Focus group participants valued the green space they had access to and advocating for more green space in cities helps mitigate urban heat island effects, can add wildlife habitat, mitigate storm water flow, and can sequester carbon.
Conduct an energy audit of your home to learn how to make your home more energy efficient
Install water efficient systems (e.g. rain barrels, shower heads, etc.) & Install energy efficient appliance (e.g. selecting Energy star appliances)
While conducting a home energy audit is not an environmental end-behavior, it has potential to lead to other environmental end-behaviors. Residents who participate in their home energy audit are more likely to make energy efficient changes to their home.
Create wildlife habitat with native flowers, shrubs, or trees near your home
Create wildlife habitat (e.g. integrating native/sustainable landscaping)
Although creating and restoring wildlife habitat have the same end-goal, the process and the actions leading to quality wildlife habitat are different, so these actions remain separated.
Discard of waste into proper receptacles
Responsibly manage waste
Litter can be ingested by wildlife, clog storm drains, and be an eye-sore. We’ve heard from community members that park users need to be better about cleaning up after themselves.
Reduce plastic by purchasing products in alternative packaging (e.g. glass or aluminum)
Reduce plastic use (e.g. purchasing glass or aluminum products)
Zoo visitors and staff were most likely to mention the importance of reducing plastic use. We suggest fostering consumer habits focused on reducing consumption of products with plastic packaging such as food and beverage.
Restore wildlife habitat by removing invasive plant species near your home
Restore wildlife habitat
Although creating and restoring wildlife habitat have the same end-goal, the process and the actions leading to quality wildlife habitat are different, so these actions remain separated.
Select a clean energy provider for electricity (e.g. Clean choice Energy through ConEd)*
Select a clean energy provider (e.g. Clean choice Energy through ConEd)
Although we initially thought we would forgo asking participants about any energy efficient actions, we decided to include it given: COP28, the call for the need to end fossil fuels by the WCS CEO, and natural gas powers almost half of NYC’s electricity.
Actions, Project Drawdown category used, and rationale for selection.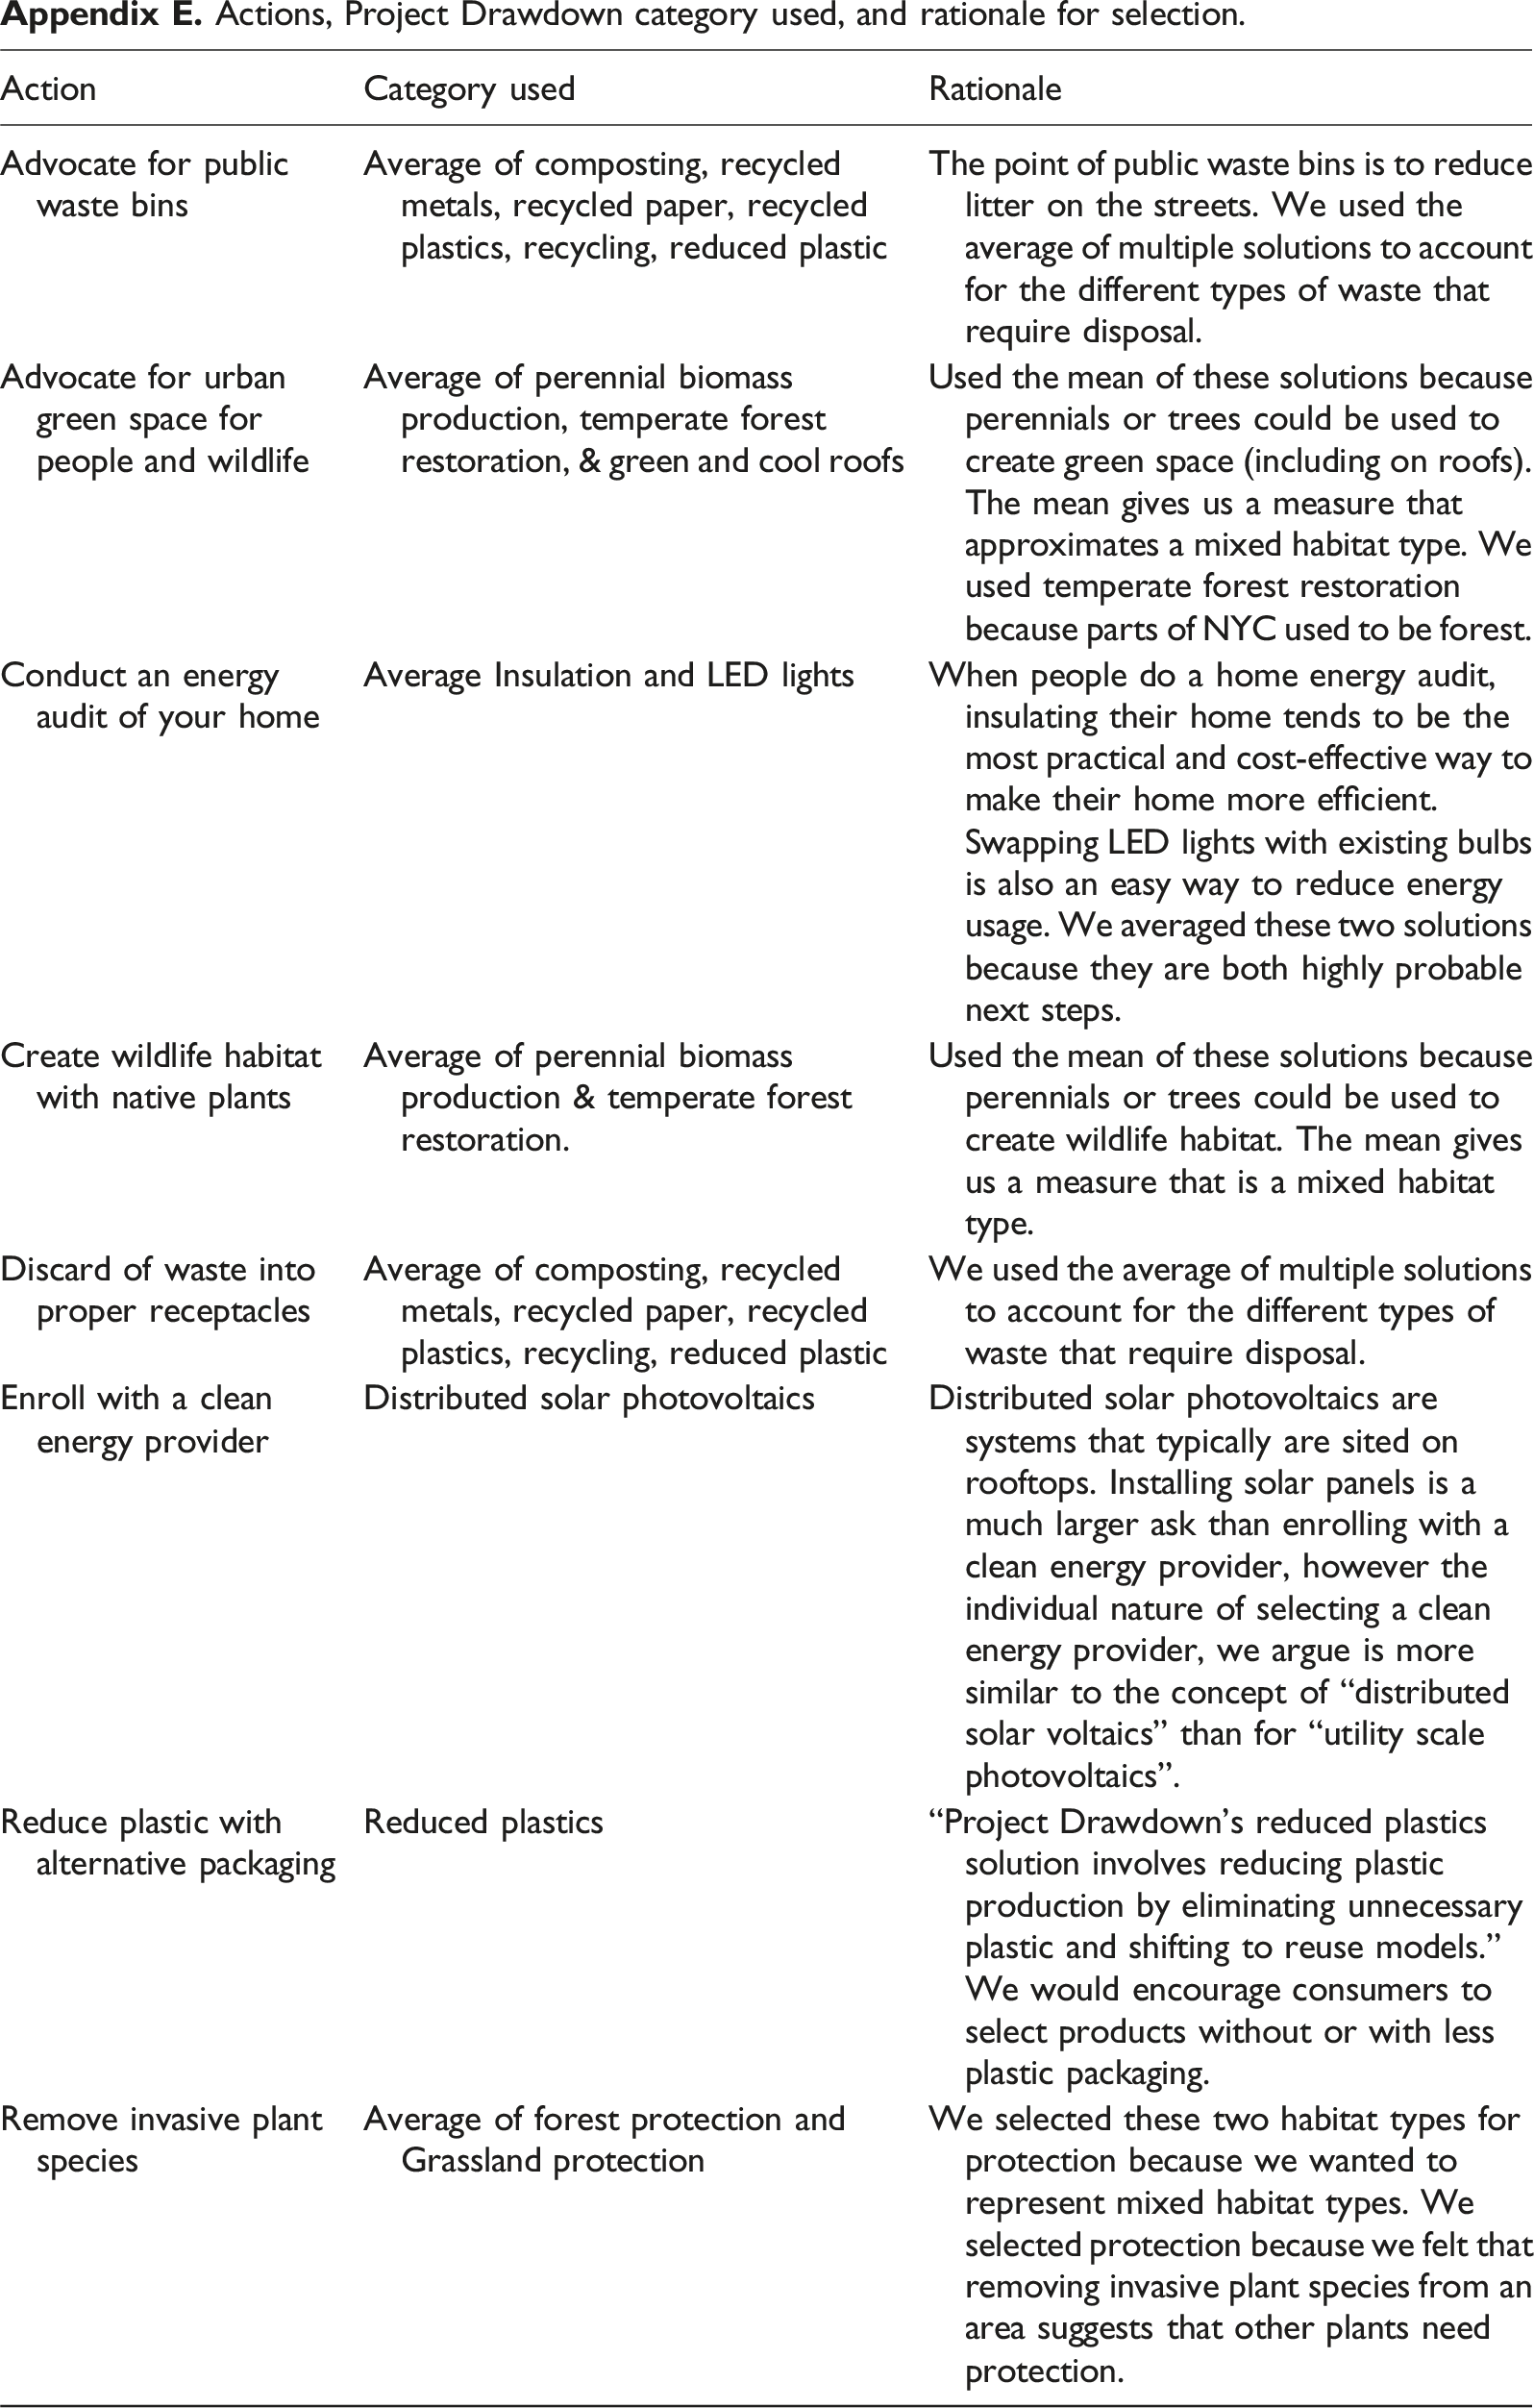
Action
Category used
Rationale
Advocate for public waste bins
Average of composting, recycled metals, recycled paper, recycled plastics, recycling, reduced plastic
The point of public waste bins is to reduce litter on the streets. We used the average of multiple solutions to account for the different types of waste that require disposal.
Advocate for urban green space for people and wildlife
Average of perennial biomass production, temperate forest restoration, & green and cool roofs
Used the mean of these solutions because perennials or trees could be used to create green space (including on roofs). The mean gives us a measure that approximates a mixed habitat type. We used temperate forest restoration because parts of NYC used to be forest.
Conduct an energy audit of your home
Average Insulation and LED lights
When people do a home energy audit, insulating their home tends to be the most practical and cost-effective way to make their home more efficient. Swapping LED lights with existing bulbs is also an easy way to reduce energy usage. We averaged these two solutions because they are both highly probable next steps.
Create wildlife habitat with native plants
Average of perennial biomass production & temperate forest restoration.
Used the mean of these solutions because perennials or trees could be used to create wildlife habitat. The mean gives us a measure that is a mixed habitat type.
Discard of waste into proper receptacles
Average of composting, recycled metals, recycled paper, recycled plastics, recycling, reduced plastic
We used the average of multiple solutions to account for the different types of waste that require disposal.
Enroll with a clean energy provider
Distributed solar photovoltaics
Distributed solar photovoltaics are systems that typically are sited on rooftops. Installing solar panels is a much larger ask than enrolling with a clean energy provider, however the individual nature of selecting a clean energy provider, we argue is more similar to the concept of “distributed solar voltaics” than for “utility scale photovoltaics”.
Reduce plastic with alternative packaging
Reduced plastics
“Project Drawdown’s reduced plastics solution involves reducing plastic production by eliminating unnecessary plastic and shifting to reuse models.” We would encourage consumers to select products without or with less plastic packaging.
Remove invasive plant species
Average of forest protection and Grassland protection
We selected these two habitat types for protection because we wanted to represent mixed habitat types. We selected protection because we felt that removing invasive plant species from an area suggests that other plants need protection.
CBSM decision-making equation using Project Drawdown data for environmental impact.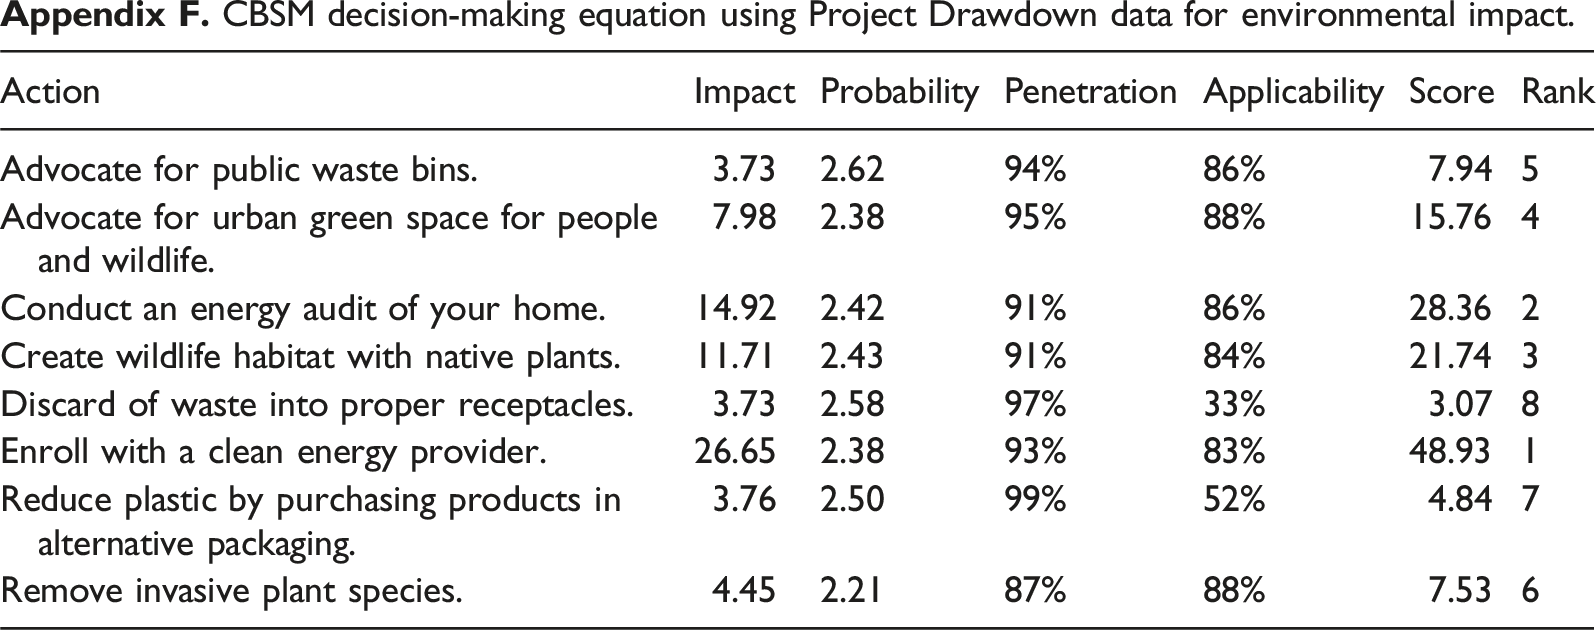
Action
Impact
Probability
Penetration
Applicability
Score
Rank
Advocate for public waste bins.
3.73
2.62
94%
86%
7.94
5
Advocate for urban green space for people and wildlife.
7.98
2.38
95%
88%
15.76
4
Conduct an energy audit of your home.
14.92
2.42
91%
86%
28.36
2
Create wildlife habitat with native plants.
11.71
2.43
91%
84%
21.74
3
Discard of waste into proper receptacles.
3.73
2.58
97%
33%
3.07
8
Enroll with a clean energy provider.
26.65
2.38
93%
83%
48.93
1
Reduce plastic by purchasing products in alternative packaging.
3.76
2.50
99%
52%
4.84
7
Remove invasive plant species.
4.45
2.21
87%
88%
7.53
6
NERO decision-making equation. Note. * Ranked according to third decimal place score: Enroll with a clean energy provider, scored 0.072 and advocate for public waste bins, scored 0.071.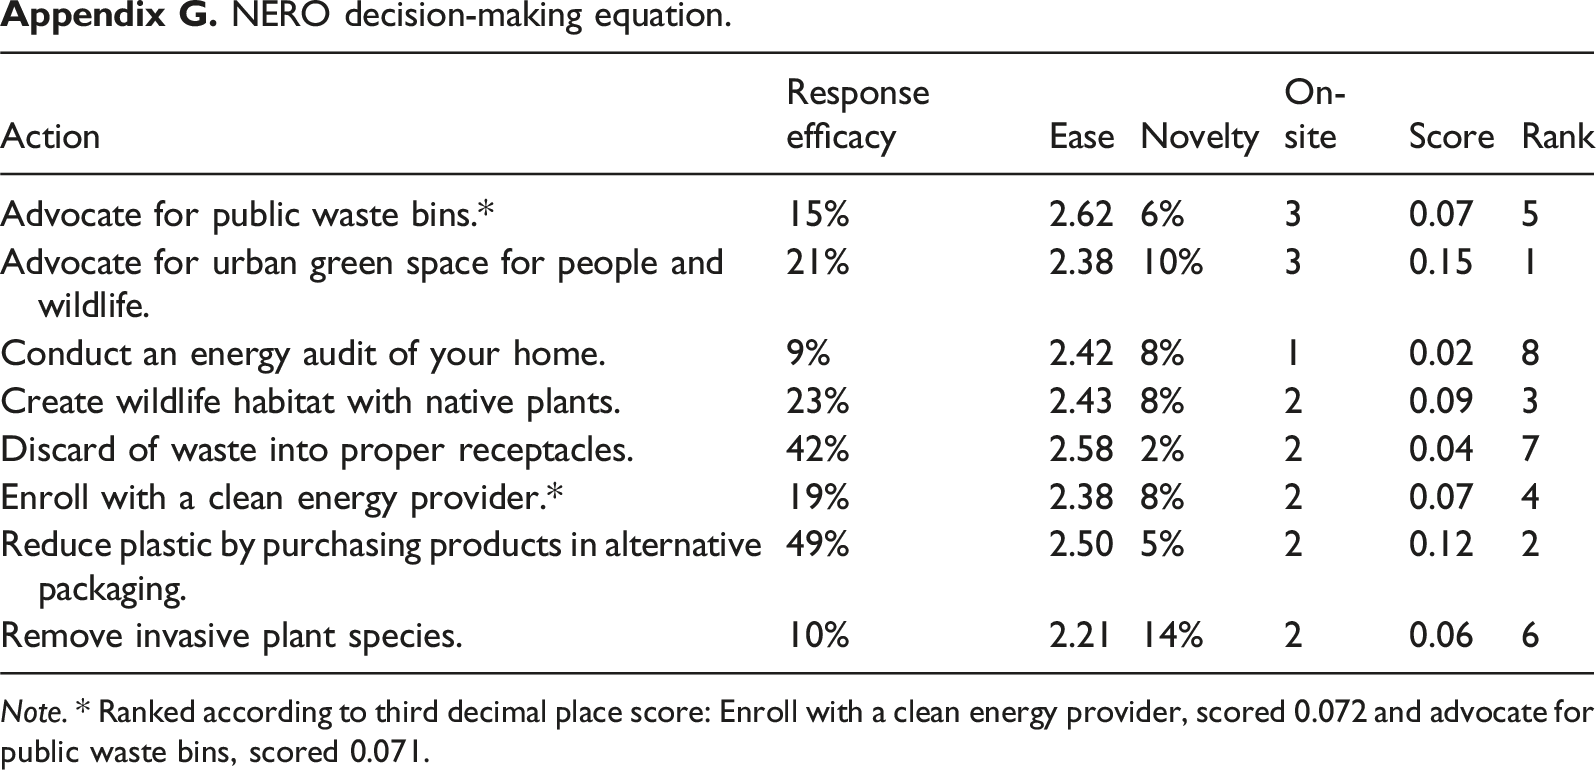
Action
Response efficacy
Ease
Novelty
On-site
Score
Rank
Advocate for public waste bins.*
15%
2.62
6%
3
0.07
5
Advocate for urban green space for people and wildlife.
21%
2.38
10%
3
0.15
1
Conduct an energy audit of your home.
9%
2.42
8%
1
0.02
8
Create wildlife habitat with native plants.
23%
2.43
8%
2
0.09
3
Discard of waste into proper receptacles.
42%
2.58
2%
2
0.04
7
Enroll with a clean energy provider.*
19%
2.38
8%
2
0.07
4
Reduce plastic by purchasing products in alternative packaging.
49%
2.50
5%
2
0.12
2
Remove invasive plant species.
10%
2.21
14%
2
0.06
6