
Abstract
Dropout prediction is an important strategic instrument for universities. The Austrian academic system relies on “student activity” for university funding, defined as accumulating 16+ ECTS credits per study year. This study proposes a combined method of machine learning and ARIMA models, predicting the number of studies eligible for funding in the next study year. Data from the University of Graz between 2013/14 and 2020/21 was used for machine learning, and data from 2011/12 to 2020/21 was used as a base for the ARIMA models. Repeated predictions for the outcome years 2018/19 to 2021/22 yielded values of accuracy at .82, precision at .76, and recall at .73. The results showed deviations between <1% and 7% from the official values. Differences may be explained by the influence of the COVID-19 pandemic. This study offers a new approach to gaining information about future successful students, which is valuable for the implementation of preventive support structures.
It can be considered a given, that not every first semester college student will graduate. Why students do not return to college after the end of a semester or a study year has been an object of research for a long time (e.g., Tinto, 1975). Key dimensions influencing student retention and graduation have been identified in demographic variables, factors of academic readiness, and students’ financial aspects (Barbera et al., 2020). From the perspective of a university, students’ academic behavior has to be considered as an interplay between personal, academic, economic, social, and institutional factors (Alban & Mauricio, 2019). The process of leaving university is a mixture of prolonged, multidimensional processes dependent on different factors. They accumulate over time and create a set of problems, making dropping out of one's study program seem inevitable (Bardach et al., 2020; Heublein, 2014; Ozga & Sukhnandan, 1998; Wilcox et al., 2005). Not only can college dropouts experience negative economic and psychological consequences after failing to graduate from a degree program (Lundquist et al., 2022); they cause a loss of money in the international university sector every year (Alban & Mauricio, 2019), especially among those institutions raising tuition fees. On an institutional level, the allocation of appropriate support structures was shown to increase student retention and decrease dropout rates (Suhlmann et al., 2018; Zając & Komendant-Brodowska, 2019). The group at risk among students needs to be known, since effective support mechanisms involve a targeted deployment (Linden, 2022; Ortigosa et al., 2019). From universities’ governance perspectives, being able to predict students’ individual inscription status and success in the future is, therefore, an important factor in both delivering support mechanisms and planning of the financial stability of universities (Aulck et al., 2017). A model to predict student status is needed that gives institutions the possibility to implement early support mechanisms based on live data.
The Austrian University System and the Special Case of “Active” Students
In Austria (Europe), universities are publicly funded, which means that students do not have to pay any fees until they stay within a predefined range of tolerance semesters. This timeframe varies depending on the curriculum (Federal Ministry of Education, Science and Research, 2002). In contrast to other countries’ academic systems, the funding of the Austrian university system is based on a number of indicators, including the number of bachelor's, master's, and diploma students that reach a threshold of 16 or more ECTS credits over the course of a study year, i.e., two semesters. ECTS stands for European Credit Transfer and Accumulation System and one ECTS credit is defined as the equivalent of 25 real-time working hours (European Union, 2015; Karran, 2004). These students are considered “active” (Federal Ministry of Education, Science and Research, 2002, 2018). Another implication arising from the absence of tuition fees is that students are more likely to inscribe into multiple studies at once. As long as they manage to accumulate at least 16 ECTS credits over the course of four semesters after enrollment, there are no limitations in the number of parallel study programs they can take. Only if these criteria are not met, their admissions expire (Federal Ministry of Education, Science and Research, 2022b). On the one hand, the ease of parallel inscription comes with the problem of making dropouts alone less meaningful as an outcome to predict and to use in governance processes. This way, students can try out different programs and finish or drop out of as many of them as they want. On the other hand, the concept of student activity (16+ ECTS) offers a unique indicator established by law, which leads to the four possible states students can have in each of their studies: dropout, inactive (0–15 ECTS), active (16+ ECTS), and graduation. Only the latter two stages being eligible for funding (Federal Ministry of Education, Science and Research, 2002, 2018), efforts are made to increase these indicators in every public Austrian university (Federal Ministry of Education, Science and Research, 2019, 2022a, 2022b). Therefore, the focus of this study is creating an approach to predict the status of students’ studies and estimating the number of future funded studies.
Student Status Prediction
Proceeding from the assumption that student status in general, i.e., becoming a dropout or completing a degree program from inscription to graduation, is highly complex (Bardach et al., 2020; Heublein, 2014; Ozga & Sukhnandan, 1998; Wilcox et al., 2005), prediction methods must be able to account for this complexity (Ortigosa et al., 2019). Estimating the probability of a student becoming a dropout or staying in the system is a classification problem, which has been approached with various machine learning algorithms in recent years (Rastrollo-Guerrero et al., 2020). More specifically, supervised learning is a machine learning method centered on using training datasets, i.e., past data, to make predictions about future instances (Kotsiantis et al., 2007). It has been successfully used in the context of student retention and dropout prediction (e.g., Dewan et al., 2015; Serra et al., 2018; Thammasiri et al., 2014). Nevertheless, determining the right predictors for student behavior is a challenge (Nandeshwar et al., 2011). The application of several algorithms and comparing their results has been suggested (Rastrollo-Guerrero et al., 2020). The accuracy different algorithms can produce is dependent on the exact setting (Albreiki et al., 2021; Rastrollo-Guerrero et al., 2020) and can sometimes be misleading, depending on the input data (Nandeshwar et al., 2011). Previous works state that the performance of predictors in machine learning methods on real-time dynamic data is yet to be explored (Albreiki et al., 2021).
With the goal of building a model that can predict the future number of studies eligible for funding, predicting the status of enrolled students is only one part of a twofold problem. On the one hand, predictions about the status of currently enrolled studies need to be made. On the other hand, considering graduation and new enrolments, there also needs to be an estimate of how many relevant studies there will be among an unknown pool of future new students. Several techniques such as expert judgments, the ratio method, results from cohort studies, simulations, time-series analysis, and regression models have been used (Chen, 2008; Layzell, 1997). Time-series analysis is considered a robust choice when sufficient data points are available, and it has been used in the past to forecast student enrollments (Chen et al., 2019). One of the major methods is the autoregressive integrated moving average (ARIMA) model (Box & Jenkins, 1970). It calculates future values based on a weighted sum of previous values, combining it with a moving average that creates a series of averages in different subsets of the data.
Estimating the Number of Funded Studies
Making predictions on an individual level in the light of the complex construct of variables student behavior can be (Bardach et al., 2020; Heublein, 2014; Ozga & Sukhnandan, 1998; Wilcox et al., 2005), it must be clear that the pool of possible predictors universities areable to access will be a lot smaller. Everything beyond administration data explaining student behavior is not available in universities’ databases. Since it has been suggested that large datasets yield better outcomes than smaller ones in conducting machine learning predictions of student status (Albreiki et al., 2021), all enrolled students and their studies should be addressed at once. Both the size of the datasets and the interest in generating outcomes on the university level make extensive data collection, in terms of adding predictors to the student data, impossible. Thus, the applied methods need to be based on data from universities’ registrar databases (e.g., Aulck et al., 2017). As previously shown, using only the administrative data for student status classification with supervised machine learning algorithms is an approach yielding good accuracy (Serra et al., 2018). This suggests that there is no necessity to model outside factors into the prediction data.
One of the main goals of the existing research was to predict future student status based on early study performance (Huang & Fang, 2013; Kotsiantis et al., 2007; Slim et al., 2014). Due to the circumstances established by the funding system of the Austrian universities, the study at hand needs to focus on predicting student status independent of the progress in and the level of the degree program of each individual student and their enrolled studies. A literature review suggests that research is lacking consideration of the dynamic nature of student behavior and performance, as these parameters underly steady changes (Albreiki et al., 2021). In this study, the robustness of the available predictors and models will be evaluated, applying the prediction algorithms to historical data and comparing the prediction outcomes with the real data for several years in the past. Possible changes in student behavior will be taken into account by moving the database forward in time depending on the target study year used as a base for the predictions. In line with this, this study offers one approach to how the concept of “student activity” can be used in universities as a means of preventive university management.
Expected Outcomes
A twofold model is proposed: (a) a supervised machine learning approach, using different algorithms to predict the status of the studies of all enrolled students at the end of a target study year and (b) a time series using ARIMA models to estimate the number of studies per status at the same point in time. The outcomes of both parts of the model are then summed up and the results are compared to the official numbers at the end of the respective study year as published by the Austrian Federal Ministry of Education, Science and Research (Federal Ministry of Education, Science and Research, 2023). The primary objective of this study is to build and test a model that predicts the number of students eligible for funding at the end of one study year in the future. Since the model should be applicable to other institutions and be able to be executed efficiently, runtime minimization, while maximizing model parameters, was a secondary goal.
Methods
Data Background
The data was retrieved from the internal database of the University of Graz. It is Austria's second largest University with approximately 30,000 students, being enrolled in around 34,000 studies per study year. Graz is known as a student-centered city, with the University of Graz not being the only facility for higher education. Other universities are closely located to the University of Graz with specializations in technology, medicine, music, and performing arts as well as applied sciences. These facilities are cooperating with each other, offering unique cooperation degree programs. In 2018, the current funding system was established by law (Federal Ministry of Education, Science and Research, 2018), making active studying (16+ ECTS per study year) a priority of Austrian universities since back then. The official numbers of funded students (Federal Ministry of Education, Science and Research, 2023), which will be compared to the results of the proposed model, are therefore valid for the study years 2018/19 and later. One study year ranges from October 1st to September 30th. Degree programs included in the data are bachelor's, master's, and diploma degree programs. Doctoral degree programs are not funded via student activity (Federal Ministry of Education, Science and Research, 2018).
It needs to be mentioned that student activity in the official numbers is divided proportionately depending on the university that offered the courses that generated the ECTS credits. This means a student reaching activity (16+ ECTS credits) in one of their studies will be generally counted as one active study. If 50% of the credits came from courses from one university and 50% of courses from another, each university receives a count of 0.5 for the activity measure. Thus, the discrepancy between the columns “n studies” and the official numbers does not mean that only a small portion of all studies reaches the activity threshold. It is a reflection of the cooperation of the University of Graz with the surrounding higher education facilities. For comparability, this division is applied to the outcome data after the prediction process and does not affect the model per se.
Data Structures and Model Setup
Machine Learning
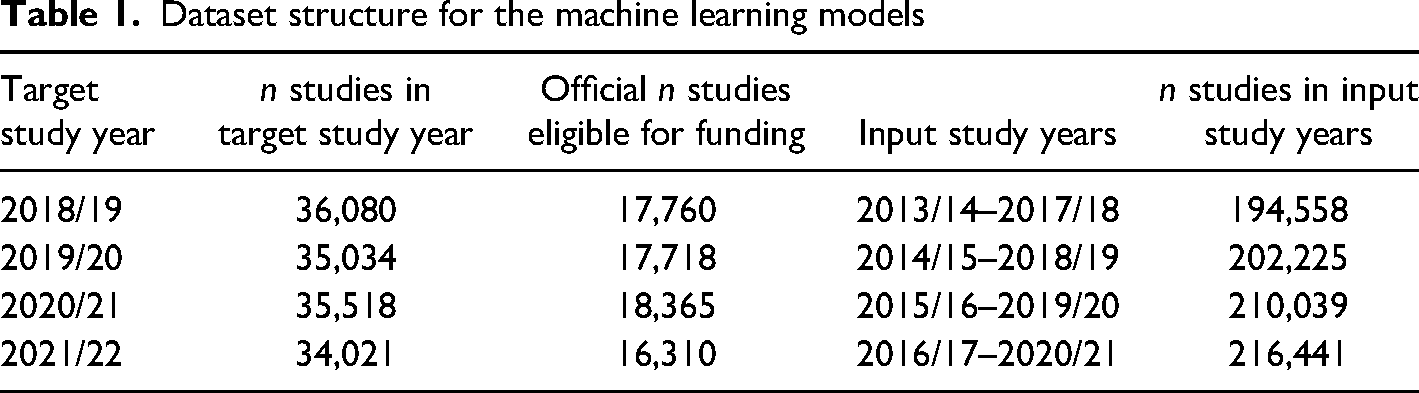
Machine learning predictions will be conducted for the study years 2018/19, 2019/20, 2020/21 and 2021/22. Each model per outcome study year will be trained on the data of five previous study years and predict the student status one study year ahead. The earliest time period includes data from 2013/14 to 2017/18, predicting the status in 2018/19. Every degree student is included in each of their studies as long as their studies are valid at the beginning of the target study year. One line in the dataset represents one study year of a single study from one person. Test data is randomly selected from the training data set, representing 30% of all rows. The division into training and test data is repeated for each target study year's input time range. Table 1 summarizes the sizes of the respective datasets used for training, testing, and predicting.
Dataset structure for the machine learning models
ARIMA
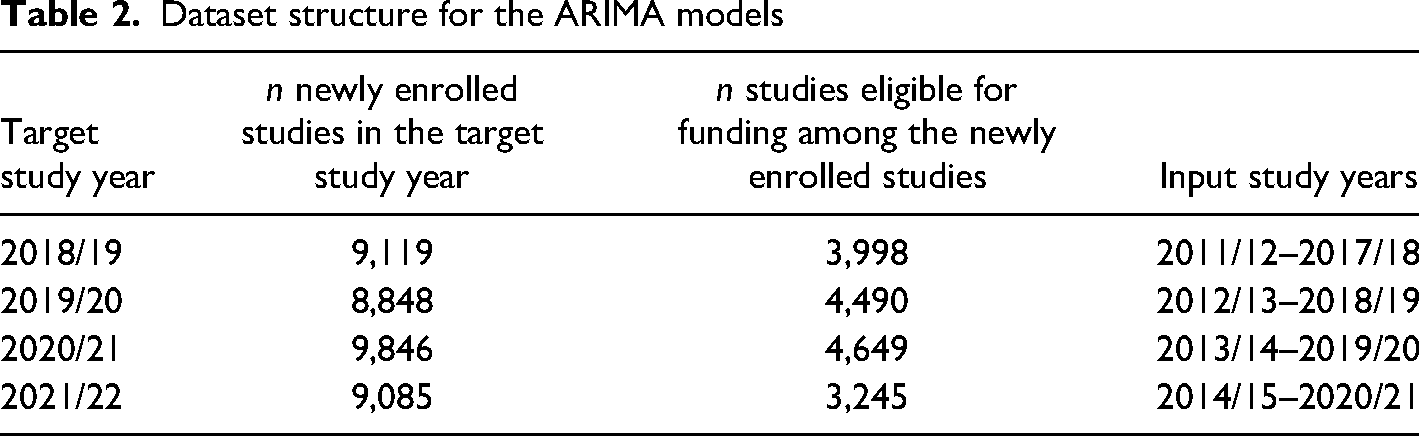
The ARIMA models are based on the time series data leading up to the target study year. They are executed on a time series of seven input study years for newly enrolled studies that are eligible for funding. Table 2 shows the target study years’ values. n newly enrolled studies are counted as 1, whereas n studies eligible for funding are divided as noted earlier.
Dataset structure for the ARIMA models
Apparatus
All calculations were performed on a PC with an installation of Microsoft Windows® 11, 16 core processor, 64 GB RAM. R was used as programming language (R Core Team, 2022), and machine learning was performed via the caret package (Kuhn, 2008). The package caretEnsemble (Deane-Mayer & Knowles, 2019) was used in hyperparameter tuning. Data was retrieved from an Oracle® SQL Server.
Modeling
Outcome Variable
The variable “student status” is a dichotomous variable that can either be categorized as “funded” or “not funded.” All studies that accumulate 16 or more ECTS credits within a study year or successfully finished study programs at the end of this time period are labeled as funded. Dropping out or not reaching 16 ECTS credits within a study year is labeled as not funded. Each machine learning algorithm's probability of being either funded or not funded is calculated. The probability of becoming funded is treated as the main outcome variable. For comparing the results of the machine learning algorithms with the official numbers of funded studies, the probabilities for the label “funded” are used, as they allow for more granularity compared to a dichotomous classification outcome. They are averaged across the algorithms and the results are summed up to get one measure for comparison.
Input Variables
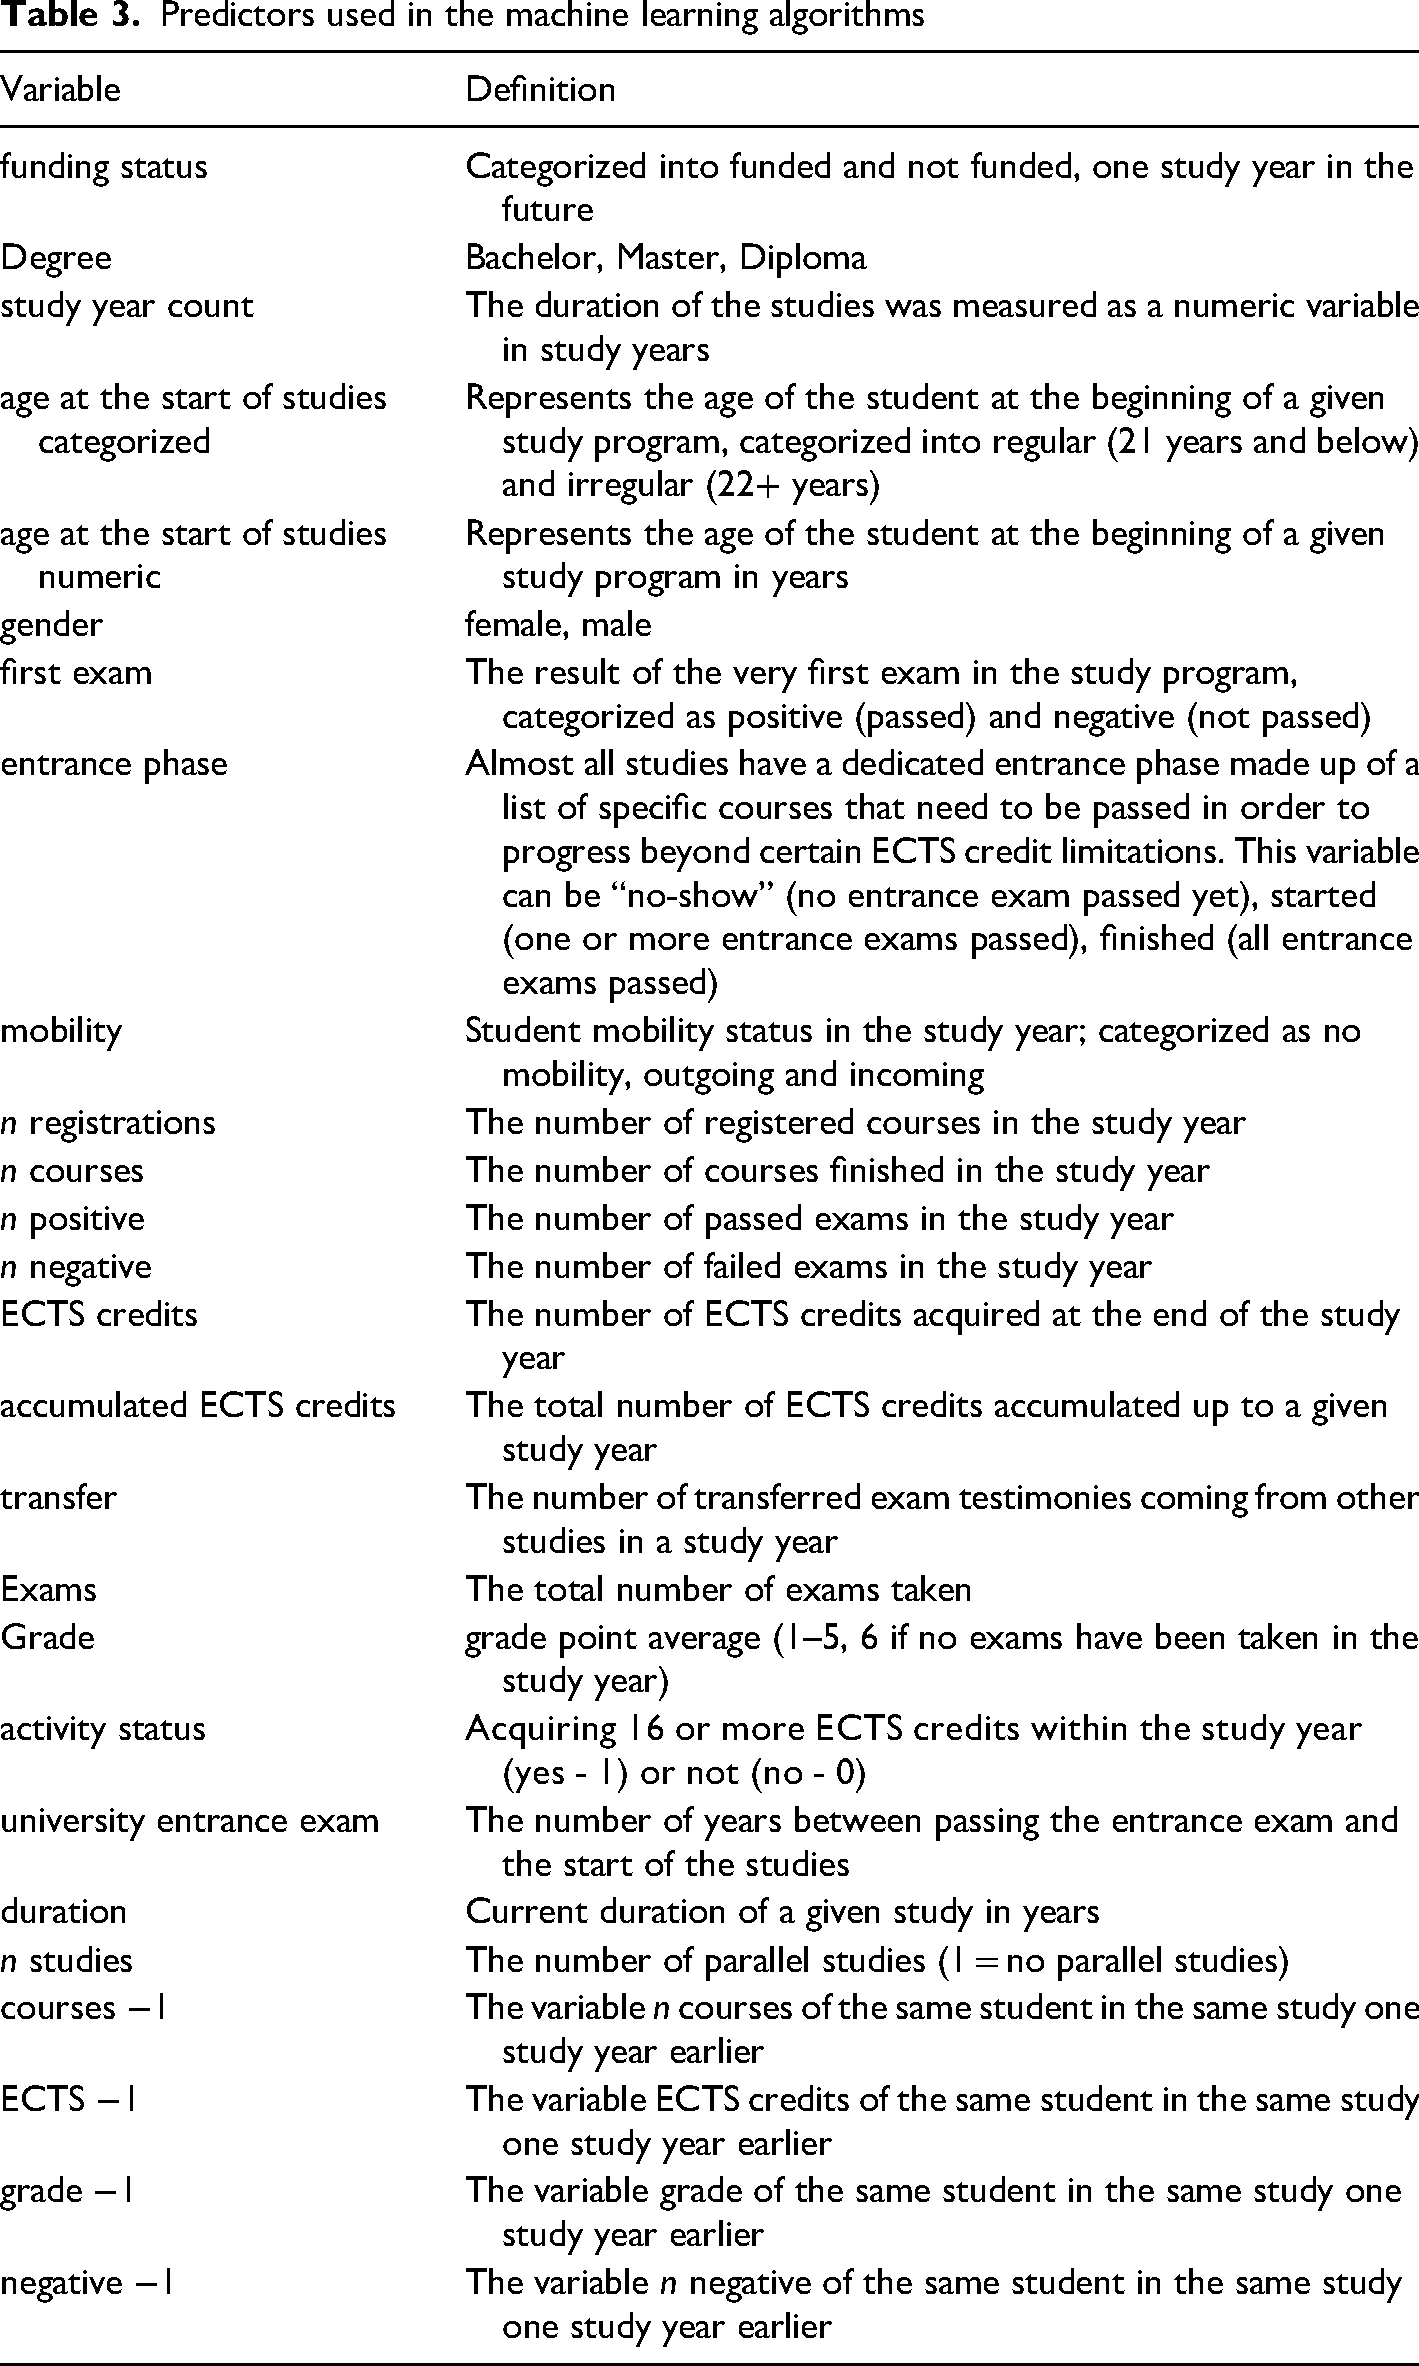
Determining input variables was done via an explorative variable reduction approach: in the first step, all possible input variables were retrieved from the database. The selection was based on (a) reasons of being performance measures (e.g., grades, ECTS), (b) because variables characterize a study program (e.g., type of degree program), or (c) they give information on the students (e.g., gender, age). Variance checks on all variables were performed and variables with zero variances and near-zero variances were excluded. In a second step, variable importance was calculated in a repeated algorithm pretesting phase, using the full variable list, to reduce the input variables by their influence on the outcome model. The final input variable selection was then adjusted, removing variables with low influence scores while keeping accuracy constant. Variables excluded in this stage were age, study program, school type, citizenship, and performance indicators 3 years in the past (courses, ECTS, grade, negative exam results). Table 3 shows the final variable list used as predictors. Categorial variables were dummy coded in the preprocessing stage.
Predictors used in the machine learning algorithms
Standard Pearson correlations were performed to obtain the correlations between the input variables. The goal was to find very high correlations that would indicate possible interchangeabilities of certain variables. Figure 1 shows the results for the target study year 2021/22. It can be deduced that there is a certain degree of high(er) interdependency between some of the input variables, but most correlations are not strong enough to justify the exclusion of certain variables. To account for the high correlation, a designated preprocessing method was implemented.
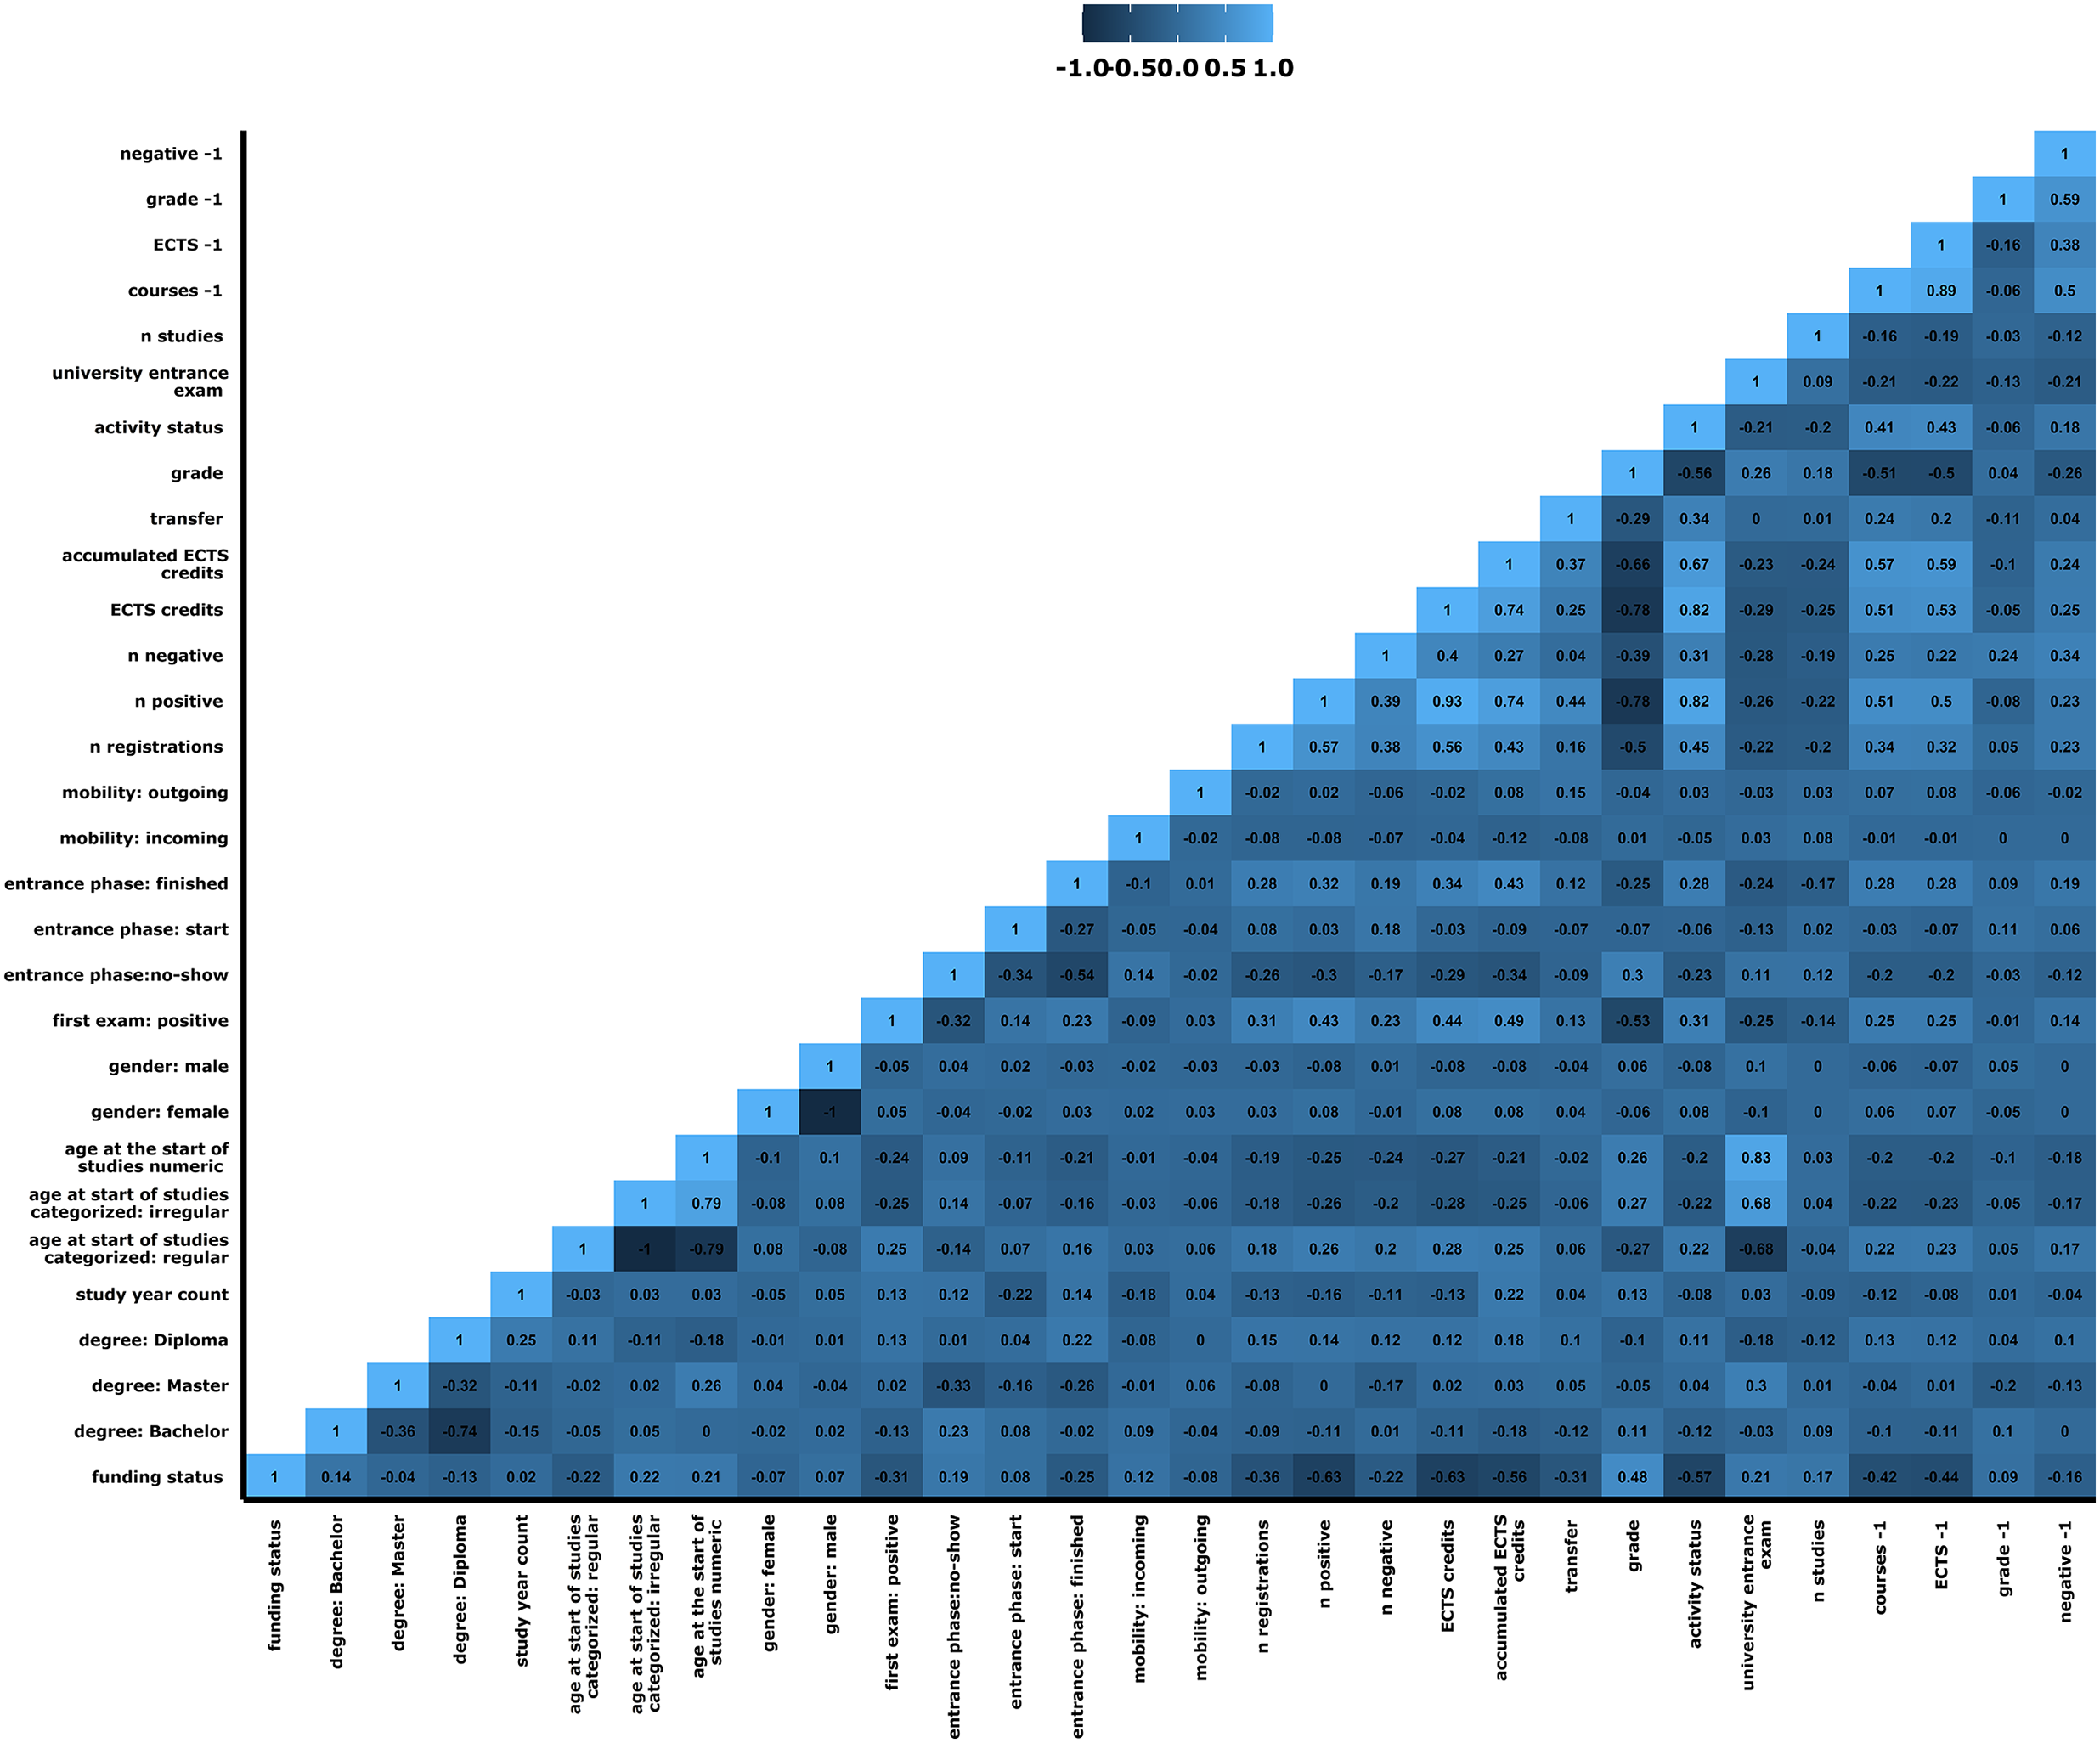
Pearson correlation matrix of input variables.
Machine Learning Pretesting
On both the full and smaller sets of the dataset, various machine learning models and preprocessing methods were pretested. The goals were to find the models with the strongest predictive value and minimal runtime, to determine preprocessing methods to improve the models best, and to determine the optimal hyperparameter settings after resampling.
Preprocessing is a method of adjusting and transforming the data to improve results and has been used in past studies (Chaudhury et al., 2016). Comparing several algorithms was suggested in previous research (Rastrollo-Guerrero et al., 2020) and considered a prerequisite in finding fast-performing algorithms with high accuracy in this study. Model training was tested using decision trees, regression models, support vector machines, and neural networks. These tests showed that the neural network “glmnet” (Hastie et al., 2021), and the regression algorithms “pls,” “simpls,” and “kernelpls” (Rosipal & Krämer, 2005) had the shortest runtime and highest accuracy, making them the main algorithms used in this study. Adaptive resampling (e.g., Iyengar et al., 2000) showed no benefit in the model outcomes and was not used for further calculations. Recursive feature elimination was not considered, since it is suggested for smaller datasets (Chen & Jeong, 2007).
Preprocessing methods yielding the best outcomes were:
The “Yeo-Johnson” and “SpatialSign” transformations are used to transform the predictor variables to fit the algorithms better (Serneels et al., 2006; Yeo & Johnson, 2000). The “corr” preprocessing method filters highly correlated predictors out of the dataset (Kuhn, 2008). “ConditionalX” is used in classification settings and examines the predictors’ distribution conditional to the outcome. Predictors with only one unique value within a class are excluded (Kuhn, 2008). Additionally, zero and near-zero variance detection and exclusion were performed via the methods “nzv” and “zv” (Kuhn, 2008). glmnet: alpha = .01, .001, .0001; lambda = .001, .0001, .00001, .000001 pls: ncomp = 5–15 simpls: ncomp = 10–20 kernelpls: ncomp = 10–20
The selected preprocessing methods were applied to the training and test datasets of all study years before model training was executed. Running the algorithms on the data and resampling was performed repeatedly to optimize hyperparameters. The following parameters were set for the final model in use:
Results
Machine Learning Performance Measures
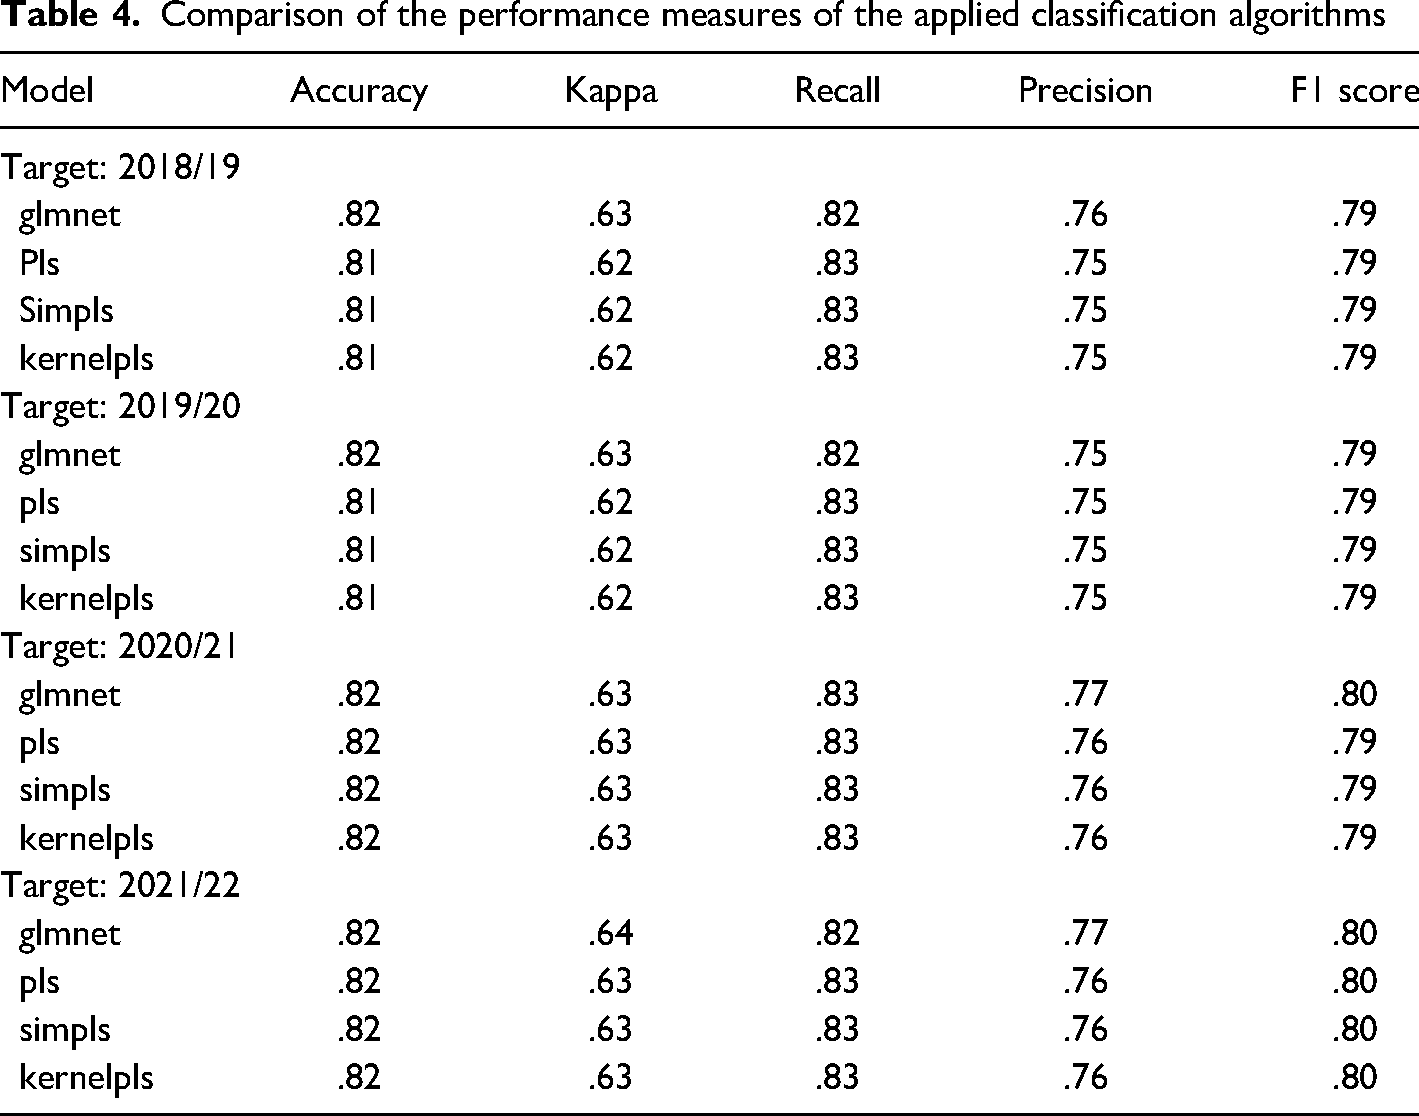
Applying the machine learning algorithms to the data, predicting the study years 2018/19–2021/22, performance measures were obtained for each algorithm in each study year. Table 4 summarizes the predictive parameters for the algorithms per target study year. Over all study years, performance measures varied to a minimal degree.
Comparison of the performance measures of the applied classification algorithms
Variable importance and contribution to the individual models were determined for each model and study year. Calculating importance scores, partial least squares models use the weighted sums of the absolute regression coefficients. They are a function of the reduction of the sums of squares across the number of components for each outcome. The contribution of the coefficients is weighted proportionally to the reduction in the sum of squares (Kuhn, 2008). Neural networks rely on a method using combinations of the absolute values of the weights (Gevrey et al., 2003; Kuhn, 2008). These scores are then transformed into a number between 0 and 100 and depicted as a bar plot shown in Figure 2.
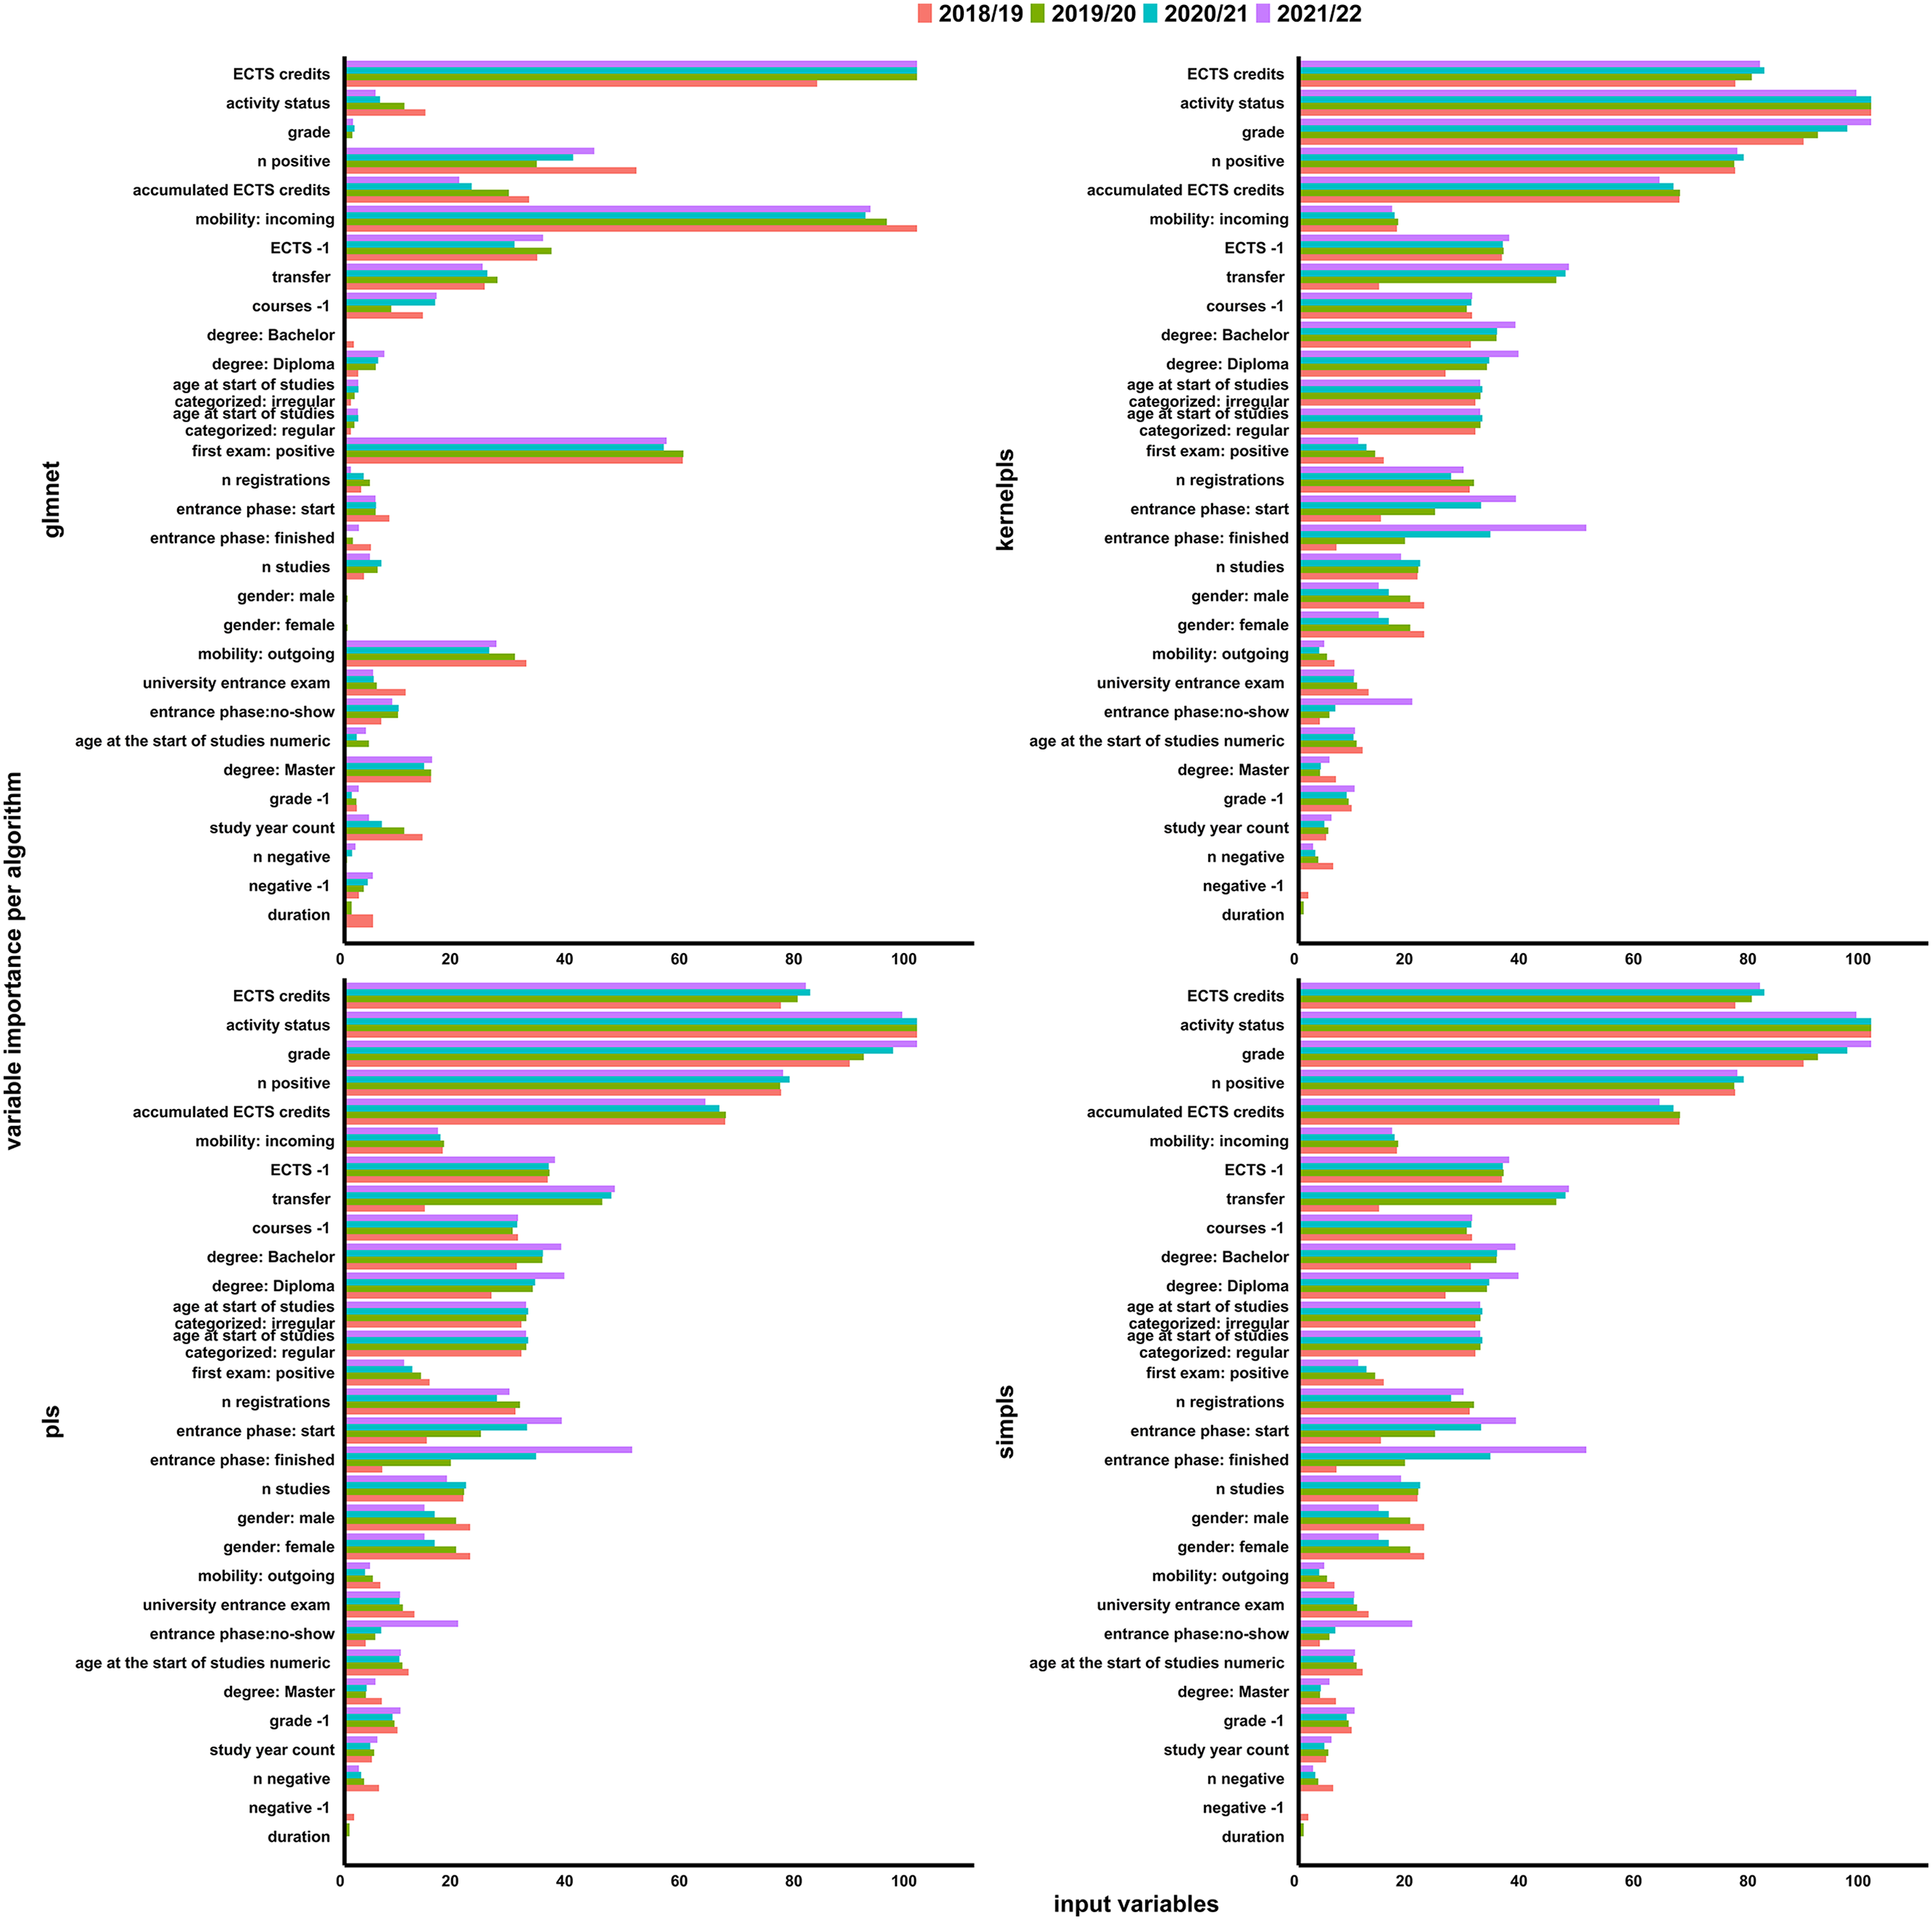
Variable importance of the algorithms per target study year.
ARIMA Models
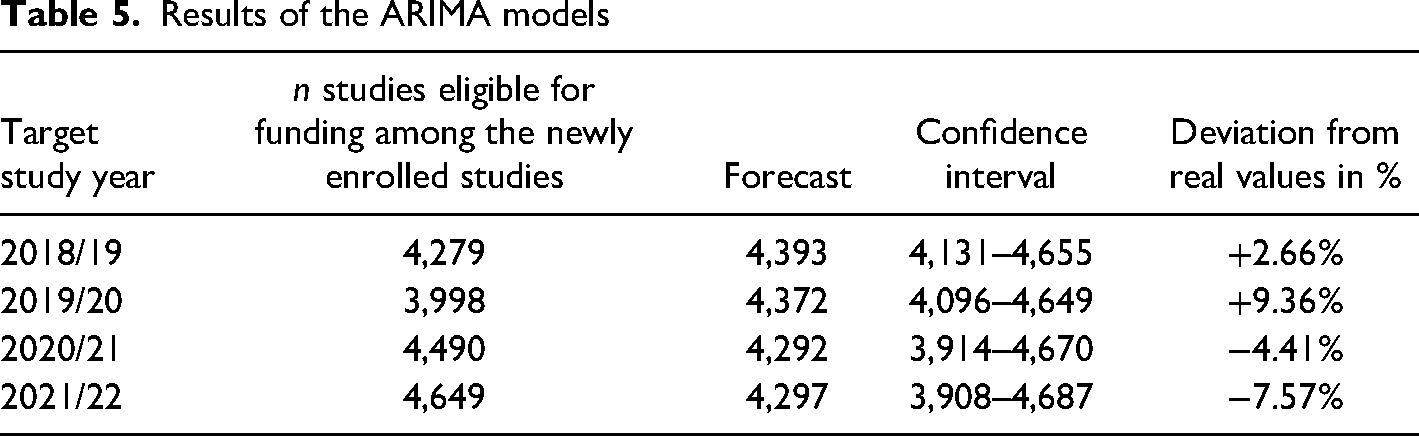
The ARIMA models were calculated including a 95% confidence interval and compared to the official values. The results are shown in Table 5.
Results of the ARIMA models
Final Estimations
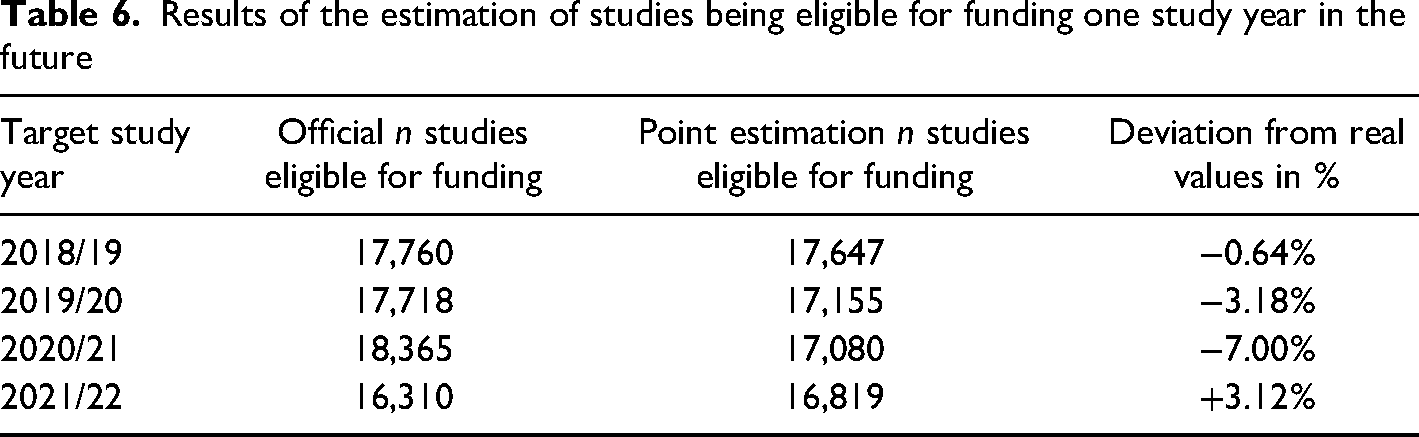
The algorithms were executed on the target data to predict the individual probabilities per status in each study year. The mean of the probabilities of all algorithms to be eligible for funding was calculated for each row in the dataset and the values were summed up. Including the results from the ARIMA model the final values of Table 6 were obtained.
Results of the estimation of studies being eligible for funding one study year in the future
Discussion
Main Results
The proposed model had an absolute deviation range of <1% to 7% comparing the official values with the point estimations of the model. It is considered a good fit for the task of predicting the number of studies eligible for funding in the Austrian university system one study year ahead. Big parts of the training datasets were comprised of data prior to the unforeseen COVID-19 pandemic, which was driving changes in how universities used to operate up to this point. Deviations can likely be explained by these new circumstances.
For the study year 2020/21 the highest deviation was registered, which needs to be considered an outlier to the norm. Although the university sector of some countries may have experienced declines in enrollments during the COVID-19 pandemic (Bulman & Fairlie, 2022) the University of Graz saw a peak in both newly enrolled students and student activity following the pandemic outbreak in the study year 2020/21 (Federal Ministry of Education, Science and Research, 2023). People under the age of 25 being employed were among the most affected populations by the pandemic (Institute for Fiscal Studies, 2020) as increasing unemployment rates followed the outbreak worldwide (Office for Budget Responsibility, 2020). In this context, three main reasons may explain the peaks in the data: (a) due to the easy accessibility of the Austrian university system (e.g., no tuition fees), previously employed young people may have sought alternatives since finding a new job was unlikely, therefore resorting to possibilities for further education. Austria may not have been an exception in the decline of job vacancies reported during the ongoing pandemic mid 2020 (Forsythe et al., 2020; Bell & Blanchflower, 2020) and the decrease in the number of jobs for the less educated (Petropoulos, 2021), which supports this assumption. (b) Students already enrolled in the university system at the beginning of the pandemic may have also been faced with losing their jobs. As off-campus work is associated with prolonging one's study duration (Behr & Theune, 2016), having no job due to the pandemic in combination with social distancing may have positively affected the time they could attribute to being academically successful. (c) The shift to online learning during lockdown times has affected all of the students across the whole university. At the University of Graz, exam modalities were reorganized to fit the circumstances. For instance, as a shift towards competence-based learning in an online setting, the number of open book exams rose to a high extent, allowing students to use their learning documents during an online exam. These changes may be reflected in the findings that students’ test anxiety was lower at the beginning of the pandemic compared to a year earlier (Ewell et al., 2022). Assuming these three main factors contributed to the increases in active students and were responsible for student behavior change since the onset of the COVID-19 pandemic, inaccuracies of the model can be traced back to these differences in respect of the training and outcome datasets.
Predictive Limitations
The predictive parameters of the machine learning algorithms were weaker compared to other studies focusing on dropout prediction (e.g., Kabathova & Drlik, 2021). As discussed earlier, the influence of the COVID-19 pandemic may have skewed the predictive value of the training data. Research needs to be done to what extent the effects on the data have outlived the critical phase of the pandemic in 2020. New models will then either have to find ways to account for these changes or to exclude variables and timeframes not matching the current situation in a given university system. Another reason could be the novelty of this approach. Since no other study has used “student activity” as an outcome criterion yet, explorative pretesting was considered the best way to determine the optimal settings for the proposed model. More research is needed to determine a better set of predictors accessible via universities’ internal databases for activity prediction.
As suggested (Nandeshwar et al., 2011), this study pretested a range of different algorithms on the data. Four algorithms were chosen due to runtime and performance measures. The variable importance scores for each model in Figure 1 showed that the regression models operated similarly to each other, while the neural network declared other variables important for prediction. Since probabilities were obtained and averaged over all models, a bias towards the regression models exists in the data. To reduce possible errors, runtime constraints should be dropped in newer research in favor of a mix of more diverse operating algorithms.
ARIMA models have the disadvantage of requiring around 40–50 longitudinal data points to produce a good prediction (Chen, 2008), which means that they do not work well on small time series(Schaffer et al., 2021). However, with early online databases being installed in the mid-2000s at the University of Graz and increasing data quality above the study year 2010/11, forecasts based on a study year structure will not be able to fulfill this requirement. In addition, going back too many study years in terms of student status prediction from enrollment data will create an inhomogeneity, considering changes in law, goals of the university sector, and student behavior (Federal Ministry of Education, Science and Research, 2002, 2018). ARIMA models with seasonality could be a solution for other university systems. By switching to a semester structure instead of study years, the predictive value of the model may increase, as the shift from study years to semesters doubles the amount of data points without going back too far in time (Chen, 2008; Qin et al., 2019). In this study, predicting student status is based on funding eligibility, i.e., crossing 16 ECTS credits per study year. Since the law does not specify any distribution of ECTS credits over that timeframe for the concept of student activity (Federal Ministry of Education, Science and Research, 2002, 2018), it is theoretically possible for students to stay inactive throughout the winter term and become active during the summer term. The database also includes students accumulating almost enough ECTS credits to be considered active, but then taking no other exams for the rest of the study year. This implies that defining activity on a semester level, i.e., dividing the existing value by two and using eight ECTS credits as the criterion, does not reflect the real situation. As long as the data quality cannot be ensured for more study years in the database, these limitations pertain.
The proposed model of this study also cannot account for personal reasons for not becoming active. As stated, some students stop taking exams shortly before crossing the border to reach 16 ECTS credits. Since student behavior is a multifaceted construct of various influences (Bardach et al., 2020; Heublein, 2014; Ozga & Sukhnandan, 1998; Wilcox et al., 2005), sudden changes in one's private life may lead to drastically decreasing the workload one can take during a specific semester. Even if the algorithms estimate a high probability of a given person's study being labeled active, as learned from previous data, breaking an arm and not being able to finish a thesis cannot be foreseen.
One concern in the process of variable selection was overfitting the machine learning models. The goal being to find the best predictor variables for student behavior and coming from an explorative variable reduction approach, the final set of predictors may be likely to contain some “noise” due to its size. Overfitting is defined as fitting the noise of the training dataset to the prediction dataset, negatively influencing accuracy (Dietterich, 1995). Finding a general predictive rule as an assumption for machine learning approaches (Dietterich, 1995) may not match the idea of describing students’ behavior in the best way possible with the selected variables. In order to not have to reduce the input variables further, hyperparameter tuning was conducted in repeated pretests. This strategy can be used to inhibit the effects of overfitting (Ying, 2019). Although overfitting may have been reduced, a specific influence cannot be ruled out at this point.
Practical Application and Future Outlook
Despite the discussed possible influences on the model, the point estimations can be considered close to the original values. This makes the proposed model not only relevant within the Austrian university system. “Student activity” in general is a measure of student workload, defined via the number of ECTS credits positively accomplished within a given time period (Federal Ministry of Education, Science and Research, 2002, 2018). Modifying this parameter, e.g., using a semester structure and different ECTS-target thresholds, gives universities the possibility to gain information about their future successful students, which is different from predicting who is going to drop out of the system. By analyzing the prediction data, information on future developments within the institution can be obtained and measures and support structures can be implemented early on. In addition to dropout prediction, this approach offers a valuable tool in the strategic steering of universities.
Conclusion
This study provides an effective approach to estimating the number of successful students of a given university at the end of one study year in the future. Combining machine learning algorithms and ARIMA models may be a valid method for predicting student status. This data can be used as a basis for preventive university management, in order to create support mechanisms in an early stage. However, the circumstances under which the training data was formed being different from the prediction data, deviations between the estimations and real numbers could be observed. This means that the proposed model was exposed to some degree of instability, which cannot be determined in the available data. The main influences on the inaccuracy of the final result can likely be traced back to the COVID-19 pandemic, which challenged university systems around the world.
Footnotes
Acknowledgement
The author(s) acknowledges the financial support by the University of Graz.
Declaration of Conflicting Interests
The author(s) declared no potential conflicts of interest with respect to the research, authorship, and/or publication of this article.
Funding
The author disclosed receipt of the following financial support for the research, authorship, and/or publication of this article: This work was supported by the Karl-Franzens-Universität Graz.