
Abstract
Objective:
Using a multistep machine-learning approach, the aim is to create virtual continuous glucose monitoring (CGM) traces from glycemic data collected in the Diabetes Control and Complications Trial (DCCT) to assess the relationship between CGM metrics and DCCT cardiovascular (CV) outcomes in people with type 1 diabetes.
Research Design and Methods:
Utilizing the virtual CGM traces created for each DCCT participant, as previously published, discrete Cox proportional hazard models were used to calculate hazard ratios (HRs) for the association between glycemic metrics (hemoglobin A1c [HbA1c] and virtual CGM) and 3 separate DCCT CV outcome definitions: (1) all DCCT-recorded events; (2) a restricted set of “hard” CV end points; and (3) a restricted set of major CV and major peripheral vascular events.
Results:
Mean HbA1c and CGM metrics reflective of hyperglycemia were consistently higher, and time-in-range (70–180 mg/dL) and time-in-tight-range (70–140 mg/dL) were consistently lower, in DCCT participants who experienced a CV outcome versus those who did not. For the outcome definition encompassing all CV events, specific adjusted HRs for a CV outcome per a 1 standard deviation (SD) change in glucose metrics were 1.29 for HbA1c with nearly identical values of 1.29–1.31 for relevant CGM metrics. A similar pattern was seen when assuming a 0.5 SD change in glucose metrics. Notably, there was no increased risk for experiencing a CV outcome as time-below-range increased, and in fact, there was a trend toward a slightly protective effect when assuming either a 1- or 0.5-SD change in virtual hypoglycemia metrics.
Conclusions:
Virtual CGM metrics are associated with CV outcomes in people with type 1 diabetes. These findings support the case for CGM metrics to be included as clinical trial primary endpoints for this population.
Introduction
Epidemiological data indicate that people with type 1 diabetes experience cardiovascular (CV) events on average more than a decade earlier and have lifespans ≈13 years shorter than the general population.1–4 Recent improvements in mean glucose, blood pressure, and lipids have reduced rates of CV complications in this population overall, 5 but the difference in CV risk between people with type 1 diabetes and the general population endures despite these improvements and is mostly unexplained by conventional risk factors. 2
The importance of optimal glycemic control in preventing chronic macrovascular complications in people with type 1 diabetes is well-established6–8 and was first demonstrated in the Diabetes Control and Complications Trial (DCCT). 9 However, recent real-world observational analyses have shown that many (ranging anywhere from 42.3% to 79%) people with type 1 diabetes do not achieve recommended glycemic targets10–12 and that age-adjusted cardiovascular disease (CVD) mortality rates remain nearly threefold higher than the general population even when target hemoglobin A1c (HbA1c) levels of <7% are achieved. 8
Utilization of continuous glucose monitoring (CGM) is rapidly increasing in people with type 1 diabetes, 13 but prospective studies linking CGM metrics to CV outcomes in this population are lacking. Kovatchev et al.14,15 recently used contemporary data science methods to create virtual CGM traces for each of the 1441 participants in the DCCT. The virtual CGM data were then used to compute CGM metrics. Notably, time-in-range (TIR; 70–180 mg/dL), time-in-tight-range (TITR; 70–140 mg/dL), mean glucose, and various hyperglycemia metrics corresponded to the development or progression of microvascular disease (retinopathy and nephropathy) in similar manner to mean HbA1c. To expand these analyses further, we evaluated the association of these virtual CGM metrics with CV outcomes in the DCCT.
Materials and Methods
Virtual DCCT CGM metrics
The DCCT was a multicenter, parallel-group, randomized controlled clinical trial that followed 1441 participants with type 1 diabetes who were randomly assigned to either intensive therapy (N = 711) or conventional therapy (N = 730) for up to 10 years. 16 The original DCCT data analyzed for the current study were obtained from the National Institutes of Diabetes and Digestive and Kidney Diseases through a data use agreement. Using the DCCT data, virtual CGM traces were created for each of the 1441 DCCT participants by a methodology that has been previously described. 15 CGM metrics were then computed from the virtual CGM traces.
CV outcomes
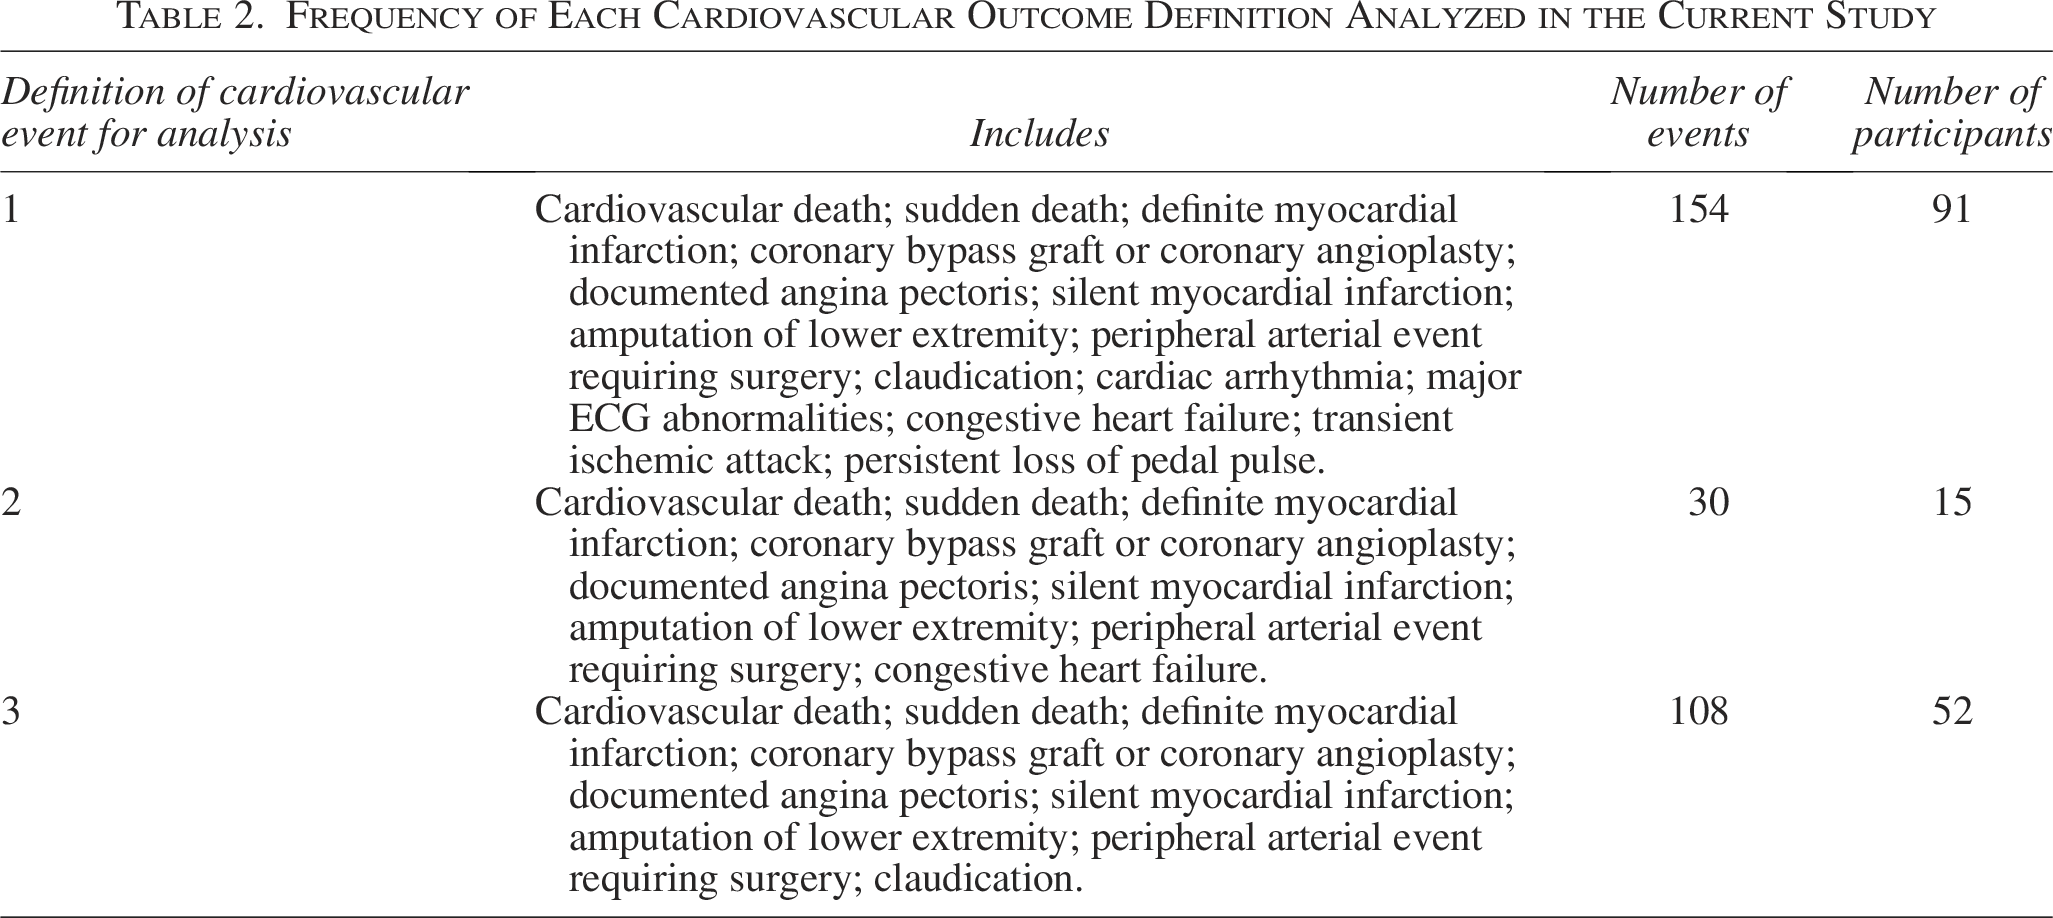
CV outcomes in the DCCT were adjudicated by a committee that was blinded to assigned treatment group and HbA1c levels.6,17 Notably, the CV outcomes referenced in the current analysis include only those collected during the original DCCT (in which data captured ended in 1993) and not during the Epidemiology of Diabetes Interventions and Complications follow-up period. For the current analyses, we examined three different definitions of CV outcomes (Table 1). Definition #1 consisted of all events recorded in the original DCCT (i.e., all events in Table 2). Definition #2 was created to evaluate classical “hard” CV end points. Definition #3 included all major CV events and major peripheral vascular events in Table 2.
Frequency of All Cardiovascular Outcomes in the Diabetes Control and Complications Trial a
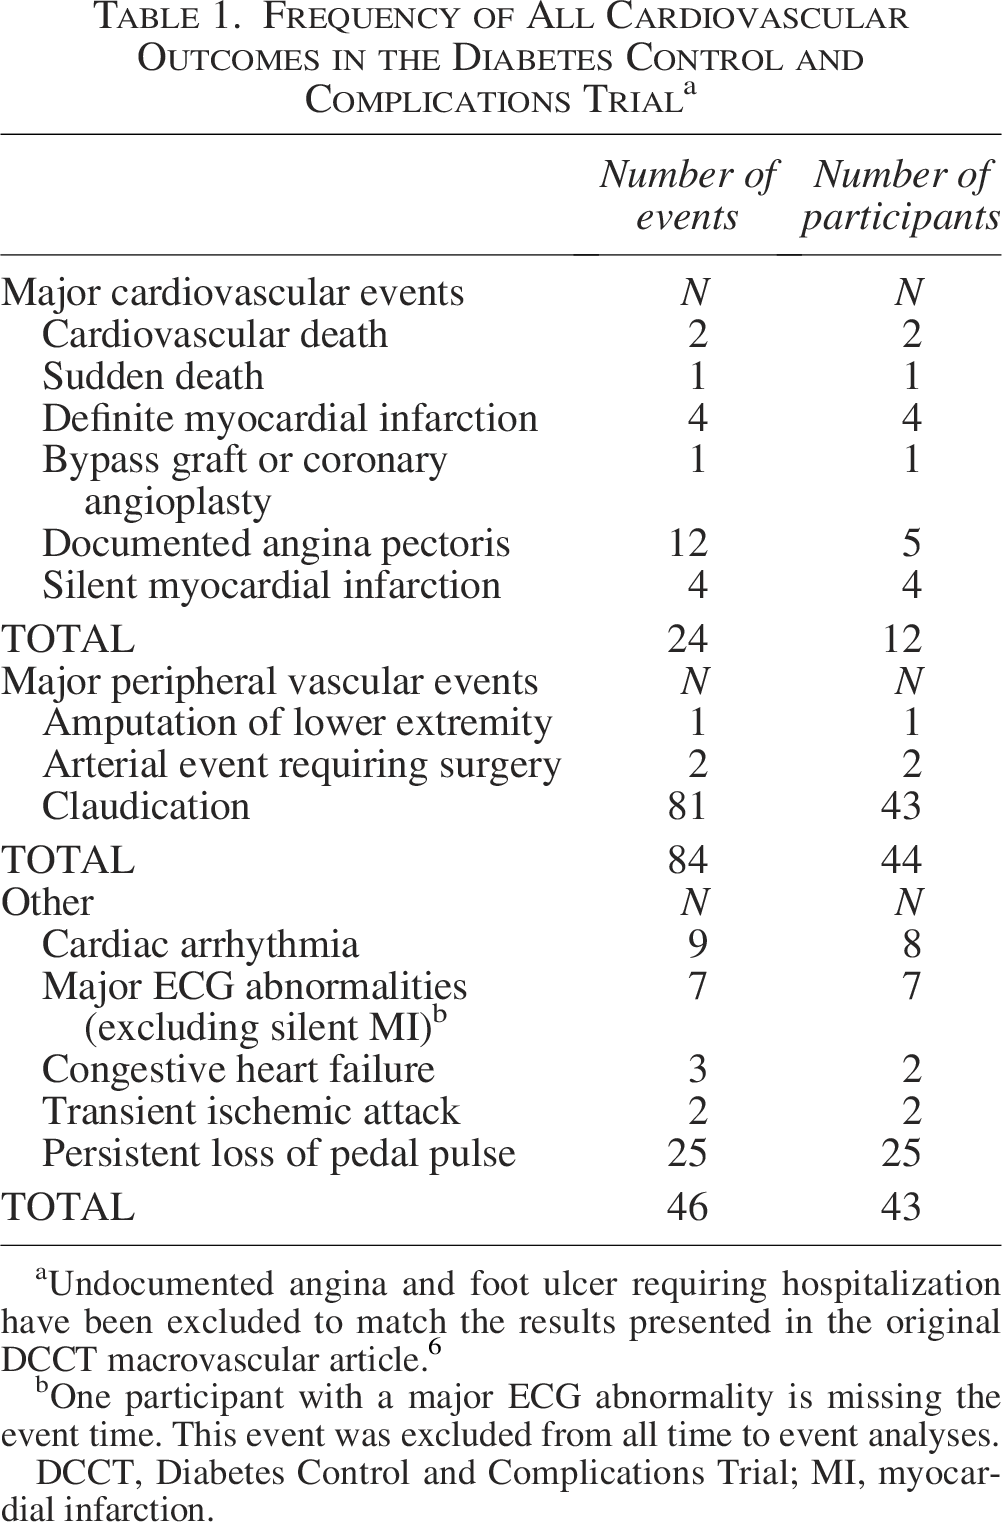
Undocumented angina and foot ulcer requiring hospitalization have been excluded to match the results presented in the original DCCT macrovascular article. 6
One participant with a major ECG abnormality is missing the event time. This event was excluded from all time to event analyses.
DCCT, Diabetes Control and Complications Trial; MI, myocardial infarction.
Frequency of Each Cardiovascular Outcome Definition Analyzed in the Current Study
Statistical analyses
To standardize the degree of change across HbA1c and CGM metrics, the amount of change constituting a 1.0 standard deviation (SD) change and 0.5 SD change was computed for each metric. Hazard ratios (HRs) for the first CV outcome were derived from discrete Cox proportional hazard models with the glycemic metric included as a time-dependent covariate calculated by pooling all data before the outcome date (i.e., the date of macrovascular event that was recorded in the original DCCT dataset). Adjusted models in the current analyses included age, sex, and duration of diabetes as covariates. Confidence intervals (CIs) have not been adjusted for multiple comparisons.
Results
During the DCCT, there were 24 major CV events in 12 participants, 84 major peripheral vascular events in 44 participants, and 46 other CV events in 43 participants (Table 1). CV Outcome Definition #1 included 154 events experienced by 91 participants, Outcome Definition #2 included 30 events experienced by 15 participants, and Outcome Definition #3 included 108 events experienced by 52 participants (Table 2).
Across the entire cohort of 1441 DCCT participants, mean HbA1c was 8.2%, mean TIR was 50%, mean TITR was 31%, mean time-above-range (TAR; glucose >180 mg/dL) was 47%, and mean time-below-range (TBR; glucose <70 mg/dL) was 2.9%. At the completion of DCCT, mean age of all participants was 33 years and mean duration of diabetes was 12 years. 18
Association of glycemic metrics to CV outcomes
Mean HbA1c and CGM metrics reflective of hyperglycemia were numerically higher and TIR and TITR numerically lower for all 3 CV outcome definitions in DCCT participants who experienced a CV outcome compared with participants who did not (Table 3). For these metrics, adjusted HRs for a Definition #1 CV Outcome per a 1 SD change in glucose metrics were 1.29 for HbA1c and nearly identical values of 1.29–1.31 for relevant CGM metrics (Table 4). For Definition #2, adjusted HRs were 1.86 for HbA1c and 1.60–1.81 for relevant CGM metrics (Table 4). For Definition #3, HRs were 1.25 for HbA1c and 1.24–1.26 for CGM metrics (Table 4). A similar pattern was seen when assuming a 0.5 SD change in glucose metrics (Supplementary Table S1). Here we note that several of the associated CIs for these HRs (specifically for CV Outcome Definitions #2 and #3) were wide and crossed 1.0, thus we cannot rule out no association in analyses where this occurred. Specifically, 3/5 adjusted HRs for Definition #2 and all 5 adjusted HRs for Definition #3 crossed 1.0 when comparing virtual CGM metrics with CV outcomes. We highlight that the low number of CV outcomes for Definitions #2 and #3 likely contributed to their wide CIs.
Comparison of Hemoglobin A1c and Hyperglycemia Virtual Continuous Glucose Monitoring Metrics in Diabetes Control and Complications Trial Participants with and Without a Cardiovascular Outcome
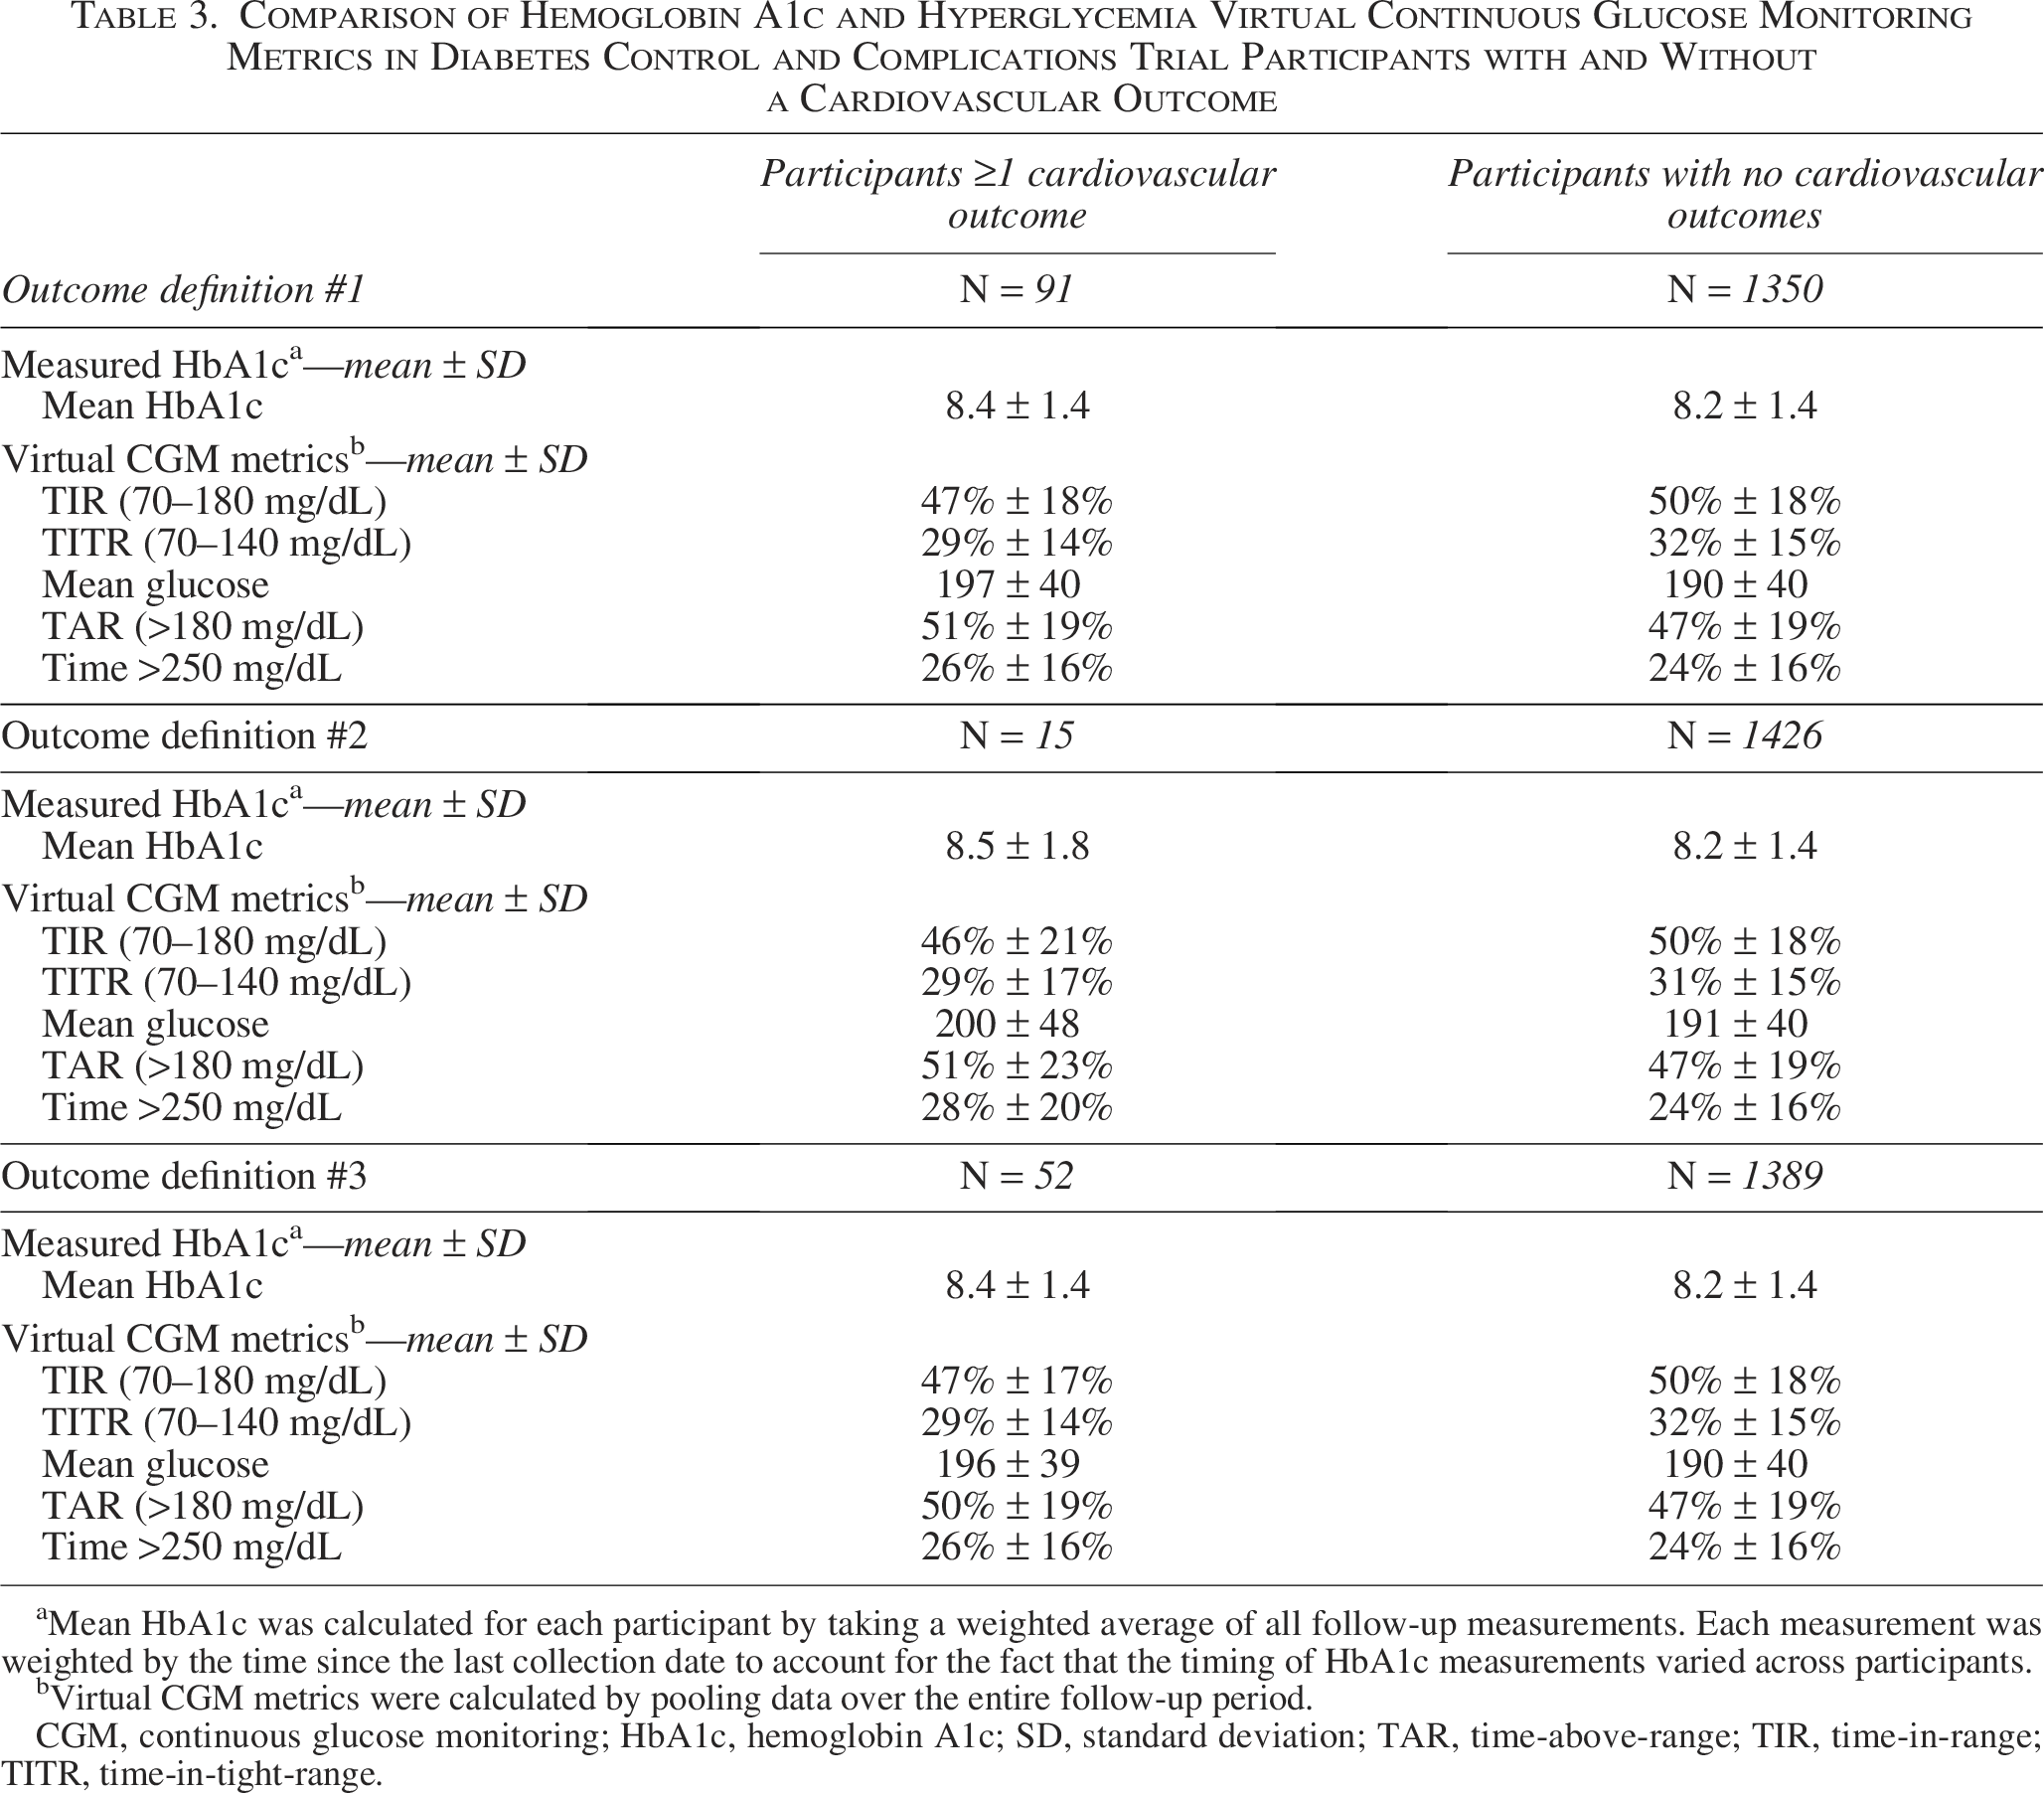
Mean HbA1c was calculated for each participant by taking a weighted average of all follow-up measurements. Each measurement was weighted by the time since the last collection date to account for the fact that the timing of HbA1c measurements varied across participants.
Virtual CGM metrics were calculated by pooling data over the entire follow-up period.
CGM, continuous glucose monitoring; HbA1c, hemoglobin A1c; SD, standard deviation; TAR, time-above-range; TIR, time-in-range; TITR, time-in-tight-range.
Hazard Ratio for the First Cardiovascular Outcome Assuming 1 Standard Deviation Change in Hemoglobin A1c or Hyperglycemia Virtual Continuous Glucose Monitoring Metrics
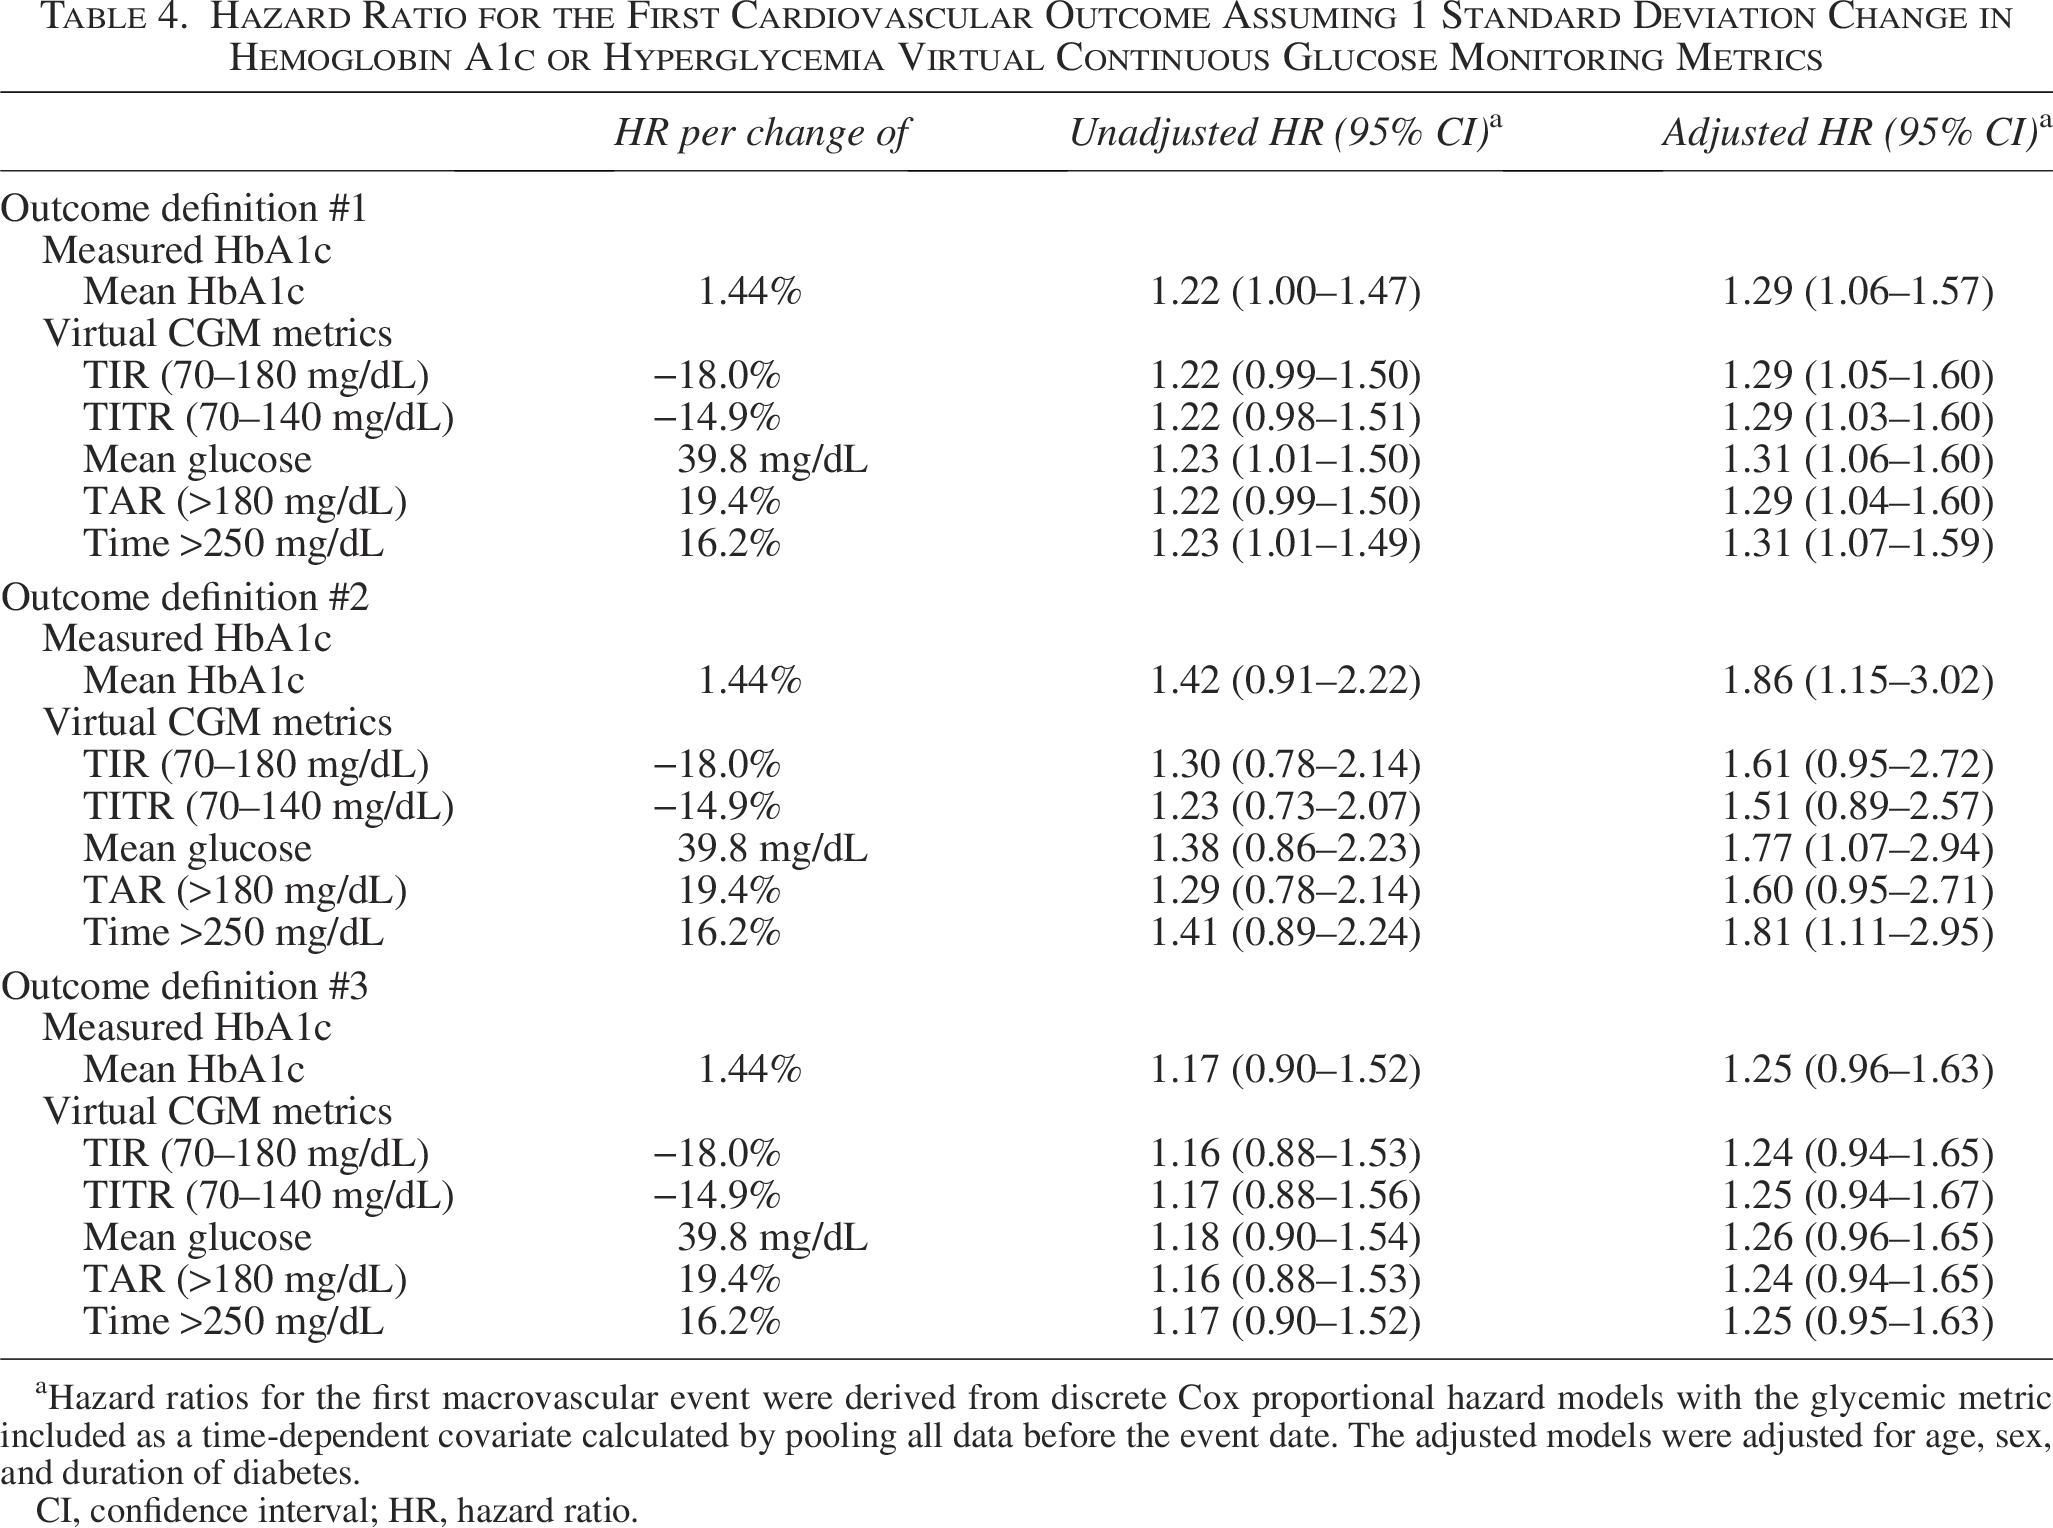
Hazard ratios for the first macrovascular event were derived from discrete Cox proportional hazard models with the glycemic metric included as a time-dependent covariate calculated by pooling all data before the event date. The adjusted models were adjusted for age, sex, and duration of diabetes.
CI, confidence interval; HR, hazard ratio.
With respect to CGM hypoglycemia metrics, values were generally similar between DCCT participants who did or did not experience a CV outcome (Table 5). Notably, the HR for experiencing a CV outcome as TBR (<70 mg/dL) increased was low and suggested a possible protective effect when assuming either a 1 SD change (Table 6) or 0.5 SD change (Supplementary Table S2) in glucose metrics.
Comparison of Hypoglycemia Virtual Continuous Glucose Monitoring Metrics in Diabetes Control and Complications Trial Participants with and Without a Cardiovascular Outcome
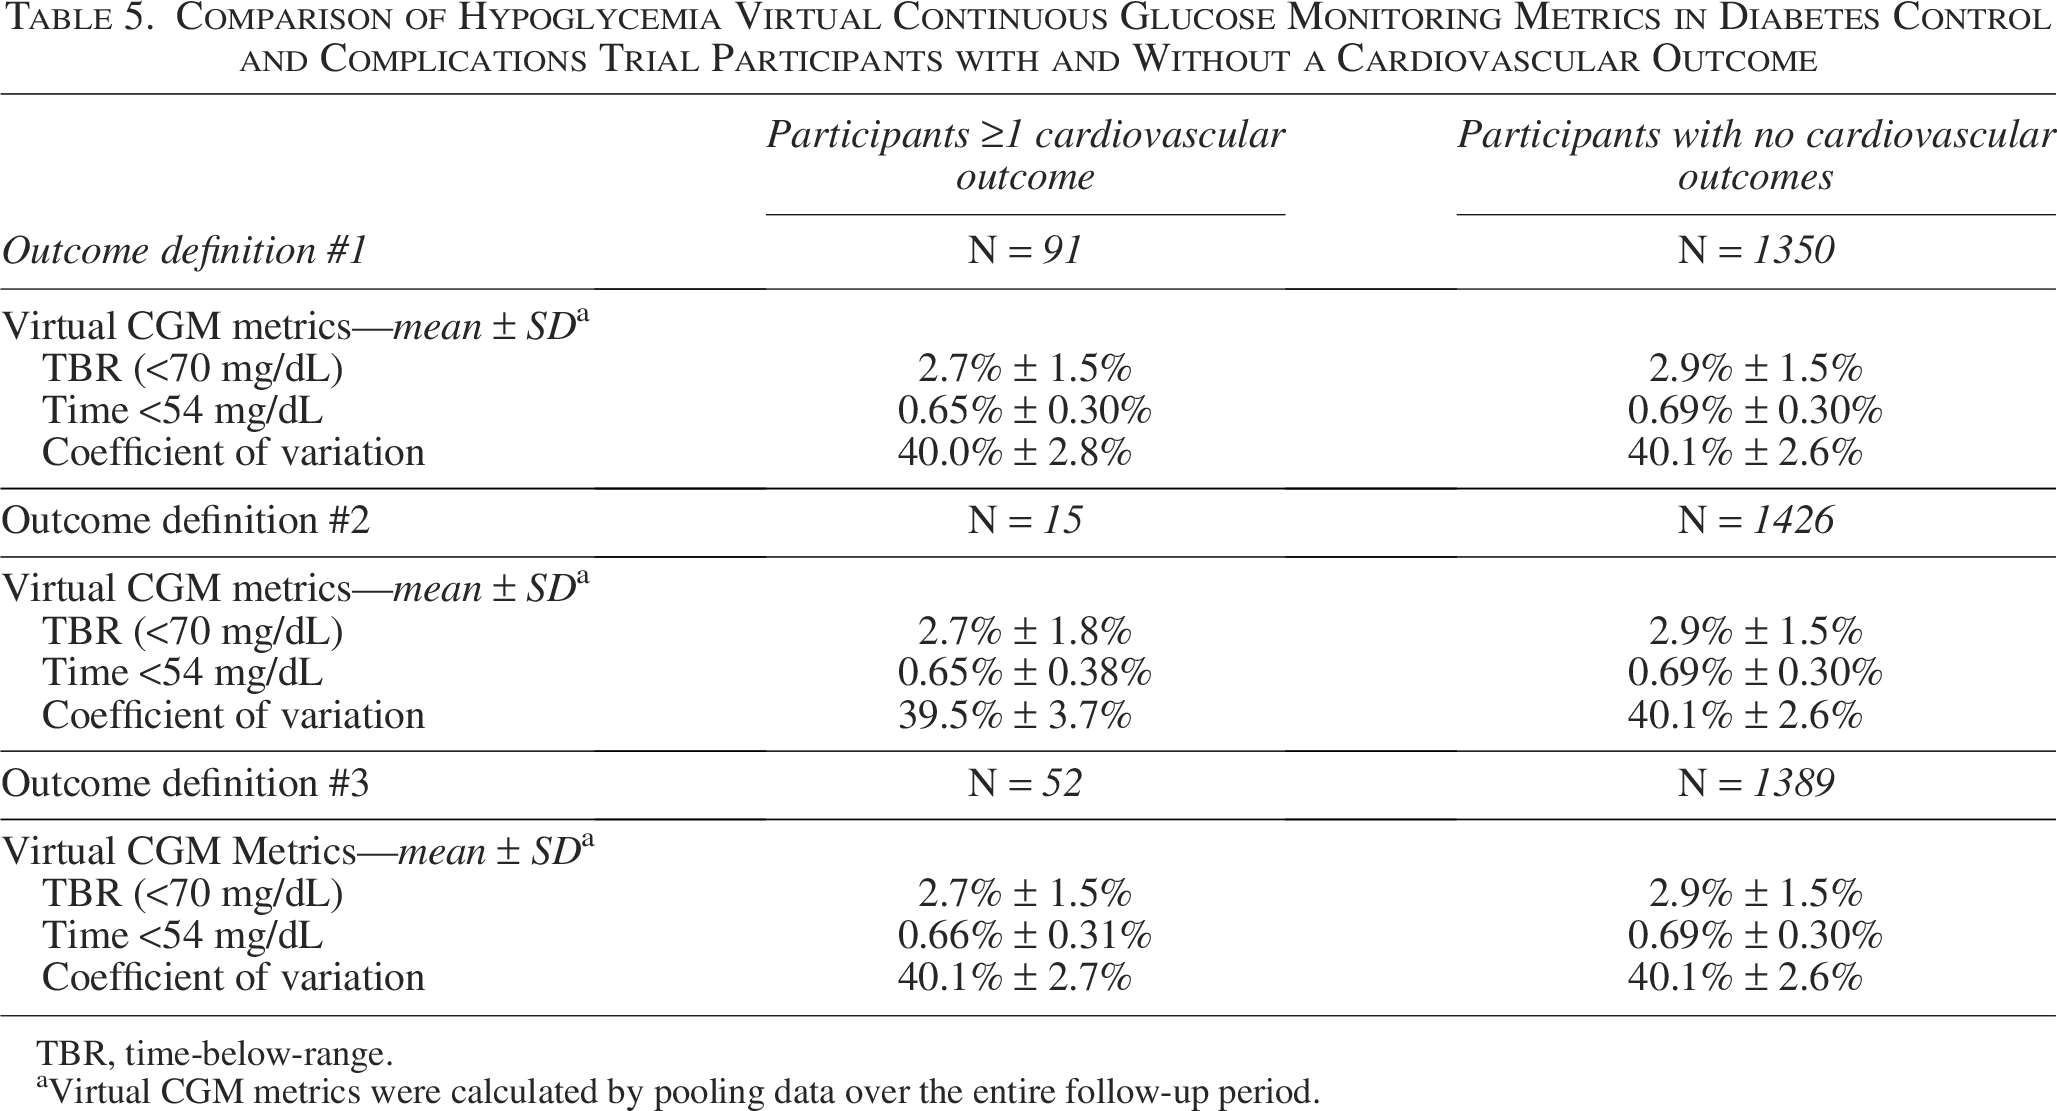
TBR, time-below-range.
Virtual CGM metrics were calculated by pooling data over the entire follow-up period.
Hazard Ratio for the First Cardiovascular Outcome Assuming a 1 Standard Deviation Change in Hypoglycemia Virtual Continuous Glucose Monitoring Metrics
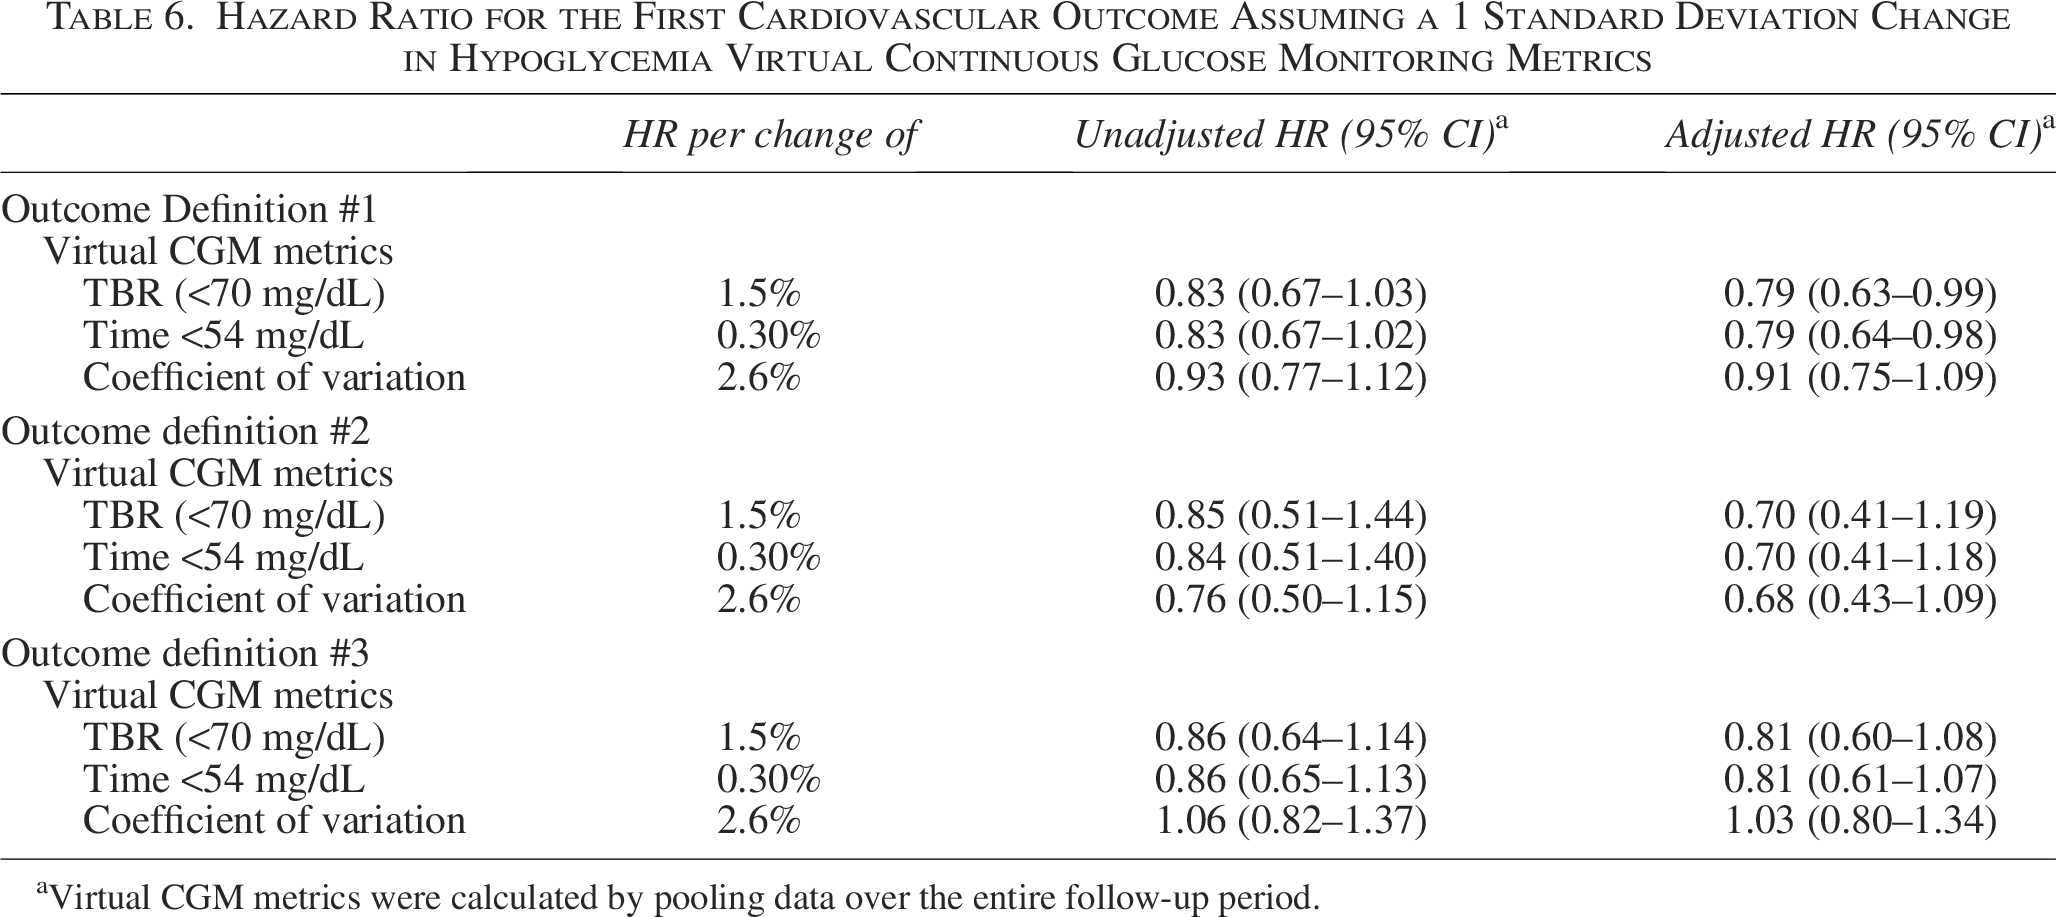
Virtual CGM metrics were calculated by pooling data over the entire follow-up period.
Discussion
The landmark DCCT informed the current treatment strategy for people with type 1 diabetes that led to significant improvements in quality of life 19 and provided valuable insight into how glycemic control impacts micro- and macrovascular complication rates in this population.6,20–25 However, one well-recognized limitation of the DCCT glucose data is that they were sparse and limited to quarterly HbA1c measurements and 7-point capillary self-monitored blood glucose (SMBG) profiles. 15 These data, while still useful, do not provide the same robust quantity and dynamic quality of glucose data afforded by current CGM devices. Herein we saw an opportunity to expand the DCCT by “virtualizing” its glucose data and adding CGM profiles for each of the original 1441 participants. Specifically, we aimed to compare these data to CV events reported in the DCCT given that, to our knowledge, there are no large studies that have prospectively linked CGM metrics to well-defined CV outcomes in people with type 1 diabetes.
We have previously shown that virtual CGM data can reliably replicate the relationships between mean HbA1c and microvascular complications (i.e., retinopathy, nephropathy, and/or neuropathy) 15 along with retinopathy progression 14 from the original DCCT. In the current study, we found that virtual CGM metrics were also able to predict CV outcomes in the DCCT population. This is notable for several reasons. First, as noted above, there is no study that as of yet has prospectively linked CGM metrics to CV outcomes in people with type 1 diabetes. One study by Lu et al. has prospectively linked lower TIR with an increased risk of all-cause and CVD mortality in people with type 2 diabetes, 26 and a separate post hoc analysis of the DEVOTE Trial also reported a negative association between derived TIR and major adverse CV events in the same patient population. 27 Specific to people with type 1 diabetes, the FACULTY Study is underway in France, and this retrospective real-world observational cohort study will follow participants for 6 years and examine the relationship between CGM metrics and macro- and microvascular complications. 28 A second noteworthy point is that regulators have hesitated to incorporate CGM metrics as clinical trial end points. 15 Enhancing the DCCT by adding virtual CGM metrics and linking them to numerous micro-14,15 and macrovascular outcomes augments the already-strong case for CGM-measured TIR to be accepted as a clinical trial end point. As highlighted elsewhere, 15 the DCCT population well-represents the heterogeneity of the broader type 1 diabetes community, and thus, relationships observed in this study carry broad generalizability. A final key point to be made is that other studies have shown that age-adjusted CVD mortality rates significantly improve but still remain nearly threefold higher than the general population even when people with type 1 diabetes achieve target mean HbA1c levels. 8 These data suggest that optimizing TIR is a key component of CVD prevention, but it is unlikely to be the only necessary intervention.
Regarding hypoglycemia, we did not identify a positive relationship between TBR and CV outcomes in the virtual DCCT. Perhaps counterintuitively, we actually found a trend toward a modestly protective effect as TBR increased. Here we note that TBR in the virtual DCCT was low (2.9%) overall. Our result differs from an analysis of the Action to Control Cardiovascular Risk in Diabetes (ACCORD) trial in which 10,251 participants with type 2 diabetes and a history of CVD or elevated CV risk were randomized to a strategy of intensive or standard glycemic control and it was reported that those (in either treatment arm) who experienced severe hypoglycemia had higher mortality than those who did not. 29 However, a subsequent post hoc analysis of the same trial reported a significant inverse relationship between the number of hypoglycemic episodes and mortality among participants in the intensive treatment group. 30 Similarly, the Veterans Affairs Diabetes Trial (VADT) and the Action in Diabetes and Vascular Disease: Preterax and Diamicron Modified Release Controlled Evaluation (ADVANCE) trial randomized 1791 and 11,140 participants with type 2 diabetes, respectively, to intensive or standard glycemic control strategies and did not identify differences in CV outcomes or mortality between the two arms despite greater hypoglycemia in the intensive group of each study.31,32 One key difference between these trials and the DCCT is that they involved older cohorts of people with type 2 diabetes (and in some cases CVD or elevated CV risk), whereas the DCCT enrolled a young cohort of people with type 1 diabetes that were without CVD at baseline. While the potential for a causative relationship between hypoglycemia and CV outcomes has been demonstrated in mechanistic studies, our results from the virtual DCCT combined with the equivocal results of ACCORD, ADVANCE, and VADT suggest that more work is needed to clarify the nature of this relationship in people with type 1 diabetes.
While our results are significant and exciting, they are not without several limitations that should be noted. First, not every individual reconstructed CGM data point can be considered accurate, and such granularity is almost certainly unachievable with the sparse glycemic data collection practices utilized in the DCCT. 15 Second, the definition of CV events in the original DCCT contained several pathologies that would be considered “soft” CV outcomes in current clinical trials. Thus, we created several definitions to evaluate this question in greater detail. The relationship between virtual CGM metrics and CV events was similar by each definition examined; however, the event rates were smaller for Definitions 2 and 3, and thus, the 95% CI values were wider. We believe that these relationships hold true, but our findings do point to a need for further investigation of the relationship between CGM metrics and “hard” CV end points. Third, the number of CV events that occurred in the original DCCT was low, likely due to the relatively young age (and consequently low CV risk) of the participants. 33 Finally, differences in both HbA1c and TIR (along with other CGM metrics) between those who did and did not experience a CV outcome were small in the DCCT. This issue has been recognized previously and aligns with the fact that DCCT was originally designed to assess the impact of intensive glycemic control specifically on microvascular complications. To wit, our prior virtual DCCT article assessing the association of CGM metrics with retinopathy identified larger HRs 14 for that outcome than the current analyses did for CV outcomes. While this point does not limit the association of CGM metrics with CV outcomes in people with type 1 diabetes, it further substantiates the growing recognition that glycemic control alone is not enough to considerably reduce and/or normalize CV risk in this population. 8 Along these lines, we were intrigued to see that relatively small differences in virtual CGM metrics were able to predict CV outcomes in the DCCT. It will be important for future studies to clarify what specific CGM thresholds and/or metric differences (e.g., 5% improvement in TIR leads to what degree of CV risk reduction and so on) correspond to improved CV outcomes in people with type 1 diabetes.
Conclusions
In conclusion, we utilized glycemic data from the DCCT to create virtual CGM profiles for each participant. We then compared these virtual CGM metrics to reported CV outcomes and found that the virtual CGM data reproduced relationships between mean HbA1c and CV events from the original DCCT. These findings support the case for CGM metrics to be included as primary end points in type 1 diabetes clinical trials.
Authors’ Contributions
W.B.H.: Writing—original draft, writing—review and editing, and funding acquisition. B.P.K.: Conceptualization, methodology, writing—review and editing, and funding acquisition. L.G.K.: Data curation, software, validation, formal analysis, writing—review and editing, and visualization. R.W.B.: Conceptualization, resources, writing—review and editing, and supervision.
Footnotes
Author Disclosure Statement
The authors have no conflicts of interest to disclose.
Funding Information
This work was supported, in part, by grants from Breakthrough T1D (3-SRA-2023–1236-M-B to W.B.H.) and NIDDK (R01DK085623 and R01DK133148 to B.P.K.).
The Diabetes Control and Complications Trial (DCCT) and its follow-up, the Epidemiology of Diabetes Interventions and Complications (EDIC) study, were conducted by the DCCT/EDIC Research Group and supported by National Institute of Health (NIH) grants and contracts and by the General Clinical Research Center Program (GCRC), the National Center for Research Resources (NCRR). The data from the DCCT/EDIC study were supplied by the NIDDK Central Repository (NIDDK-CR). This article was not prepared under the auspices of the DCCT/EDIC study and does not represent analyses or conclusions of the DCCT/EDIC study group, NIDDK-CR, or NIH. These data analysis and the work on this article were supported by the University of Virginia Center for Diabetes Technology, Charlottesville, Virginia and by the JAEB Center for Health Research, Tampa, Florida.
Supplemental Material
References
Supplementary Material
Please find the following supplemental material available below.
For Open Access articles published under a Creative Commons License, all supplemental material carries the same license as the article it is associated with.
For non-Open Access articles published, all supplemental material carries a non-exclusive license, and permission requests for re-use of supplemental material or any part of supplemental material shall be sent directly to the copyright owner as specified in the copyright notice associated with the article.