
Abstract
Pressurised metered dose inhalers (pMDIs) release greenhouse gases with substantially higher carbon dioxide equivalent (CO2e) emission than other inhalers. Data from the Pharmaceutical Benefits Scheme (PBS) from 2013-2023, showed 28.3% increase in inhalers prescribed. pMDIs account for 47.5% of inhalers prescribed, contributing to 95.6 of inhaler-related carbon emissions. Targeted strategies to optimise disease control and promote use of non-pMDI inhalers where clinically appropriate can significantly reduce emissions while maintaining high-quality care.
Introduction
Climate change increasingly threatens human health, particularly for individuals with chronic respiratory disease due to increased bush fire smoke exposure and thunderstorm events.1,2 In Australia, asthma and COPD affect over 10% of the population, 3 with inhalers forming the cornerstone of treatment. Inhalers vary in their environmental impact: dry powder inhalers (DPIs) and soft mist inhalers (SMIs) are low-emission devices, whereas pMDIs in Australia contain hydrofluorocarbon (HFC) propellants (HFC-134a or HFC-227ea), which are potent greenhouse gases generating approximately 20 times more carbon emissions than DPIs or SMIs.4–6 Countries permitting over the counter pMDIs access have higher pMDI use. 2
Recent publications from peak health organisations and the Australian government encourage consideration of lower emission inhalers where clinically appropriate.2,5,7 However, anecdotally, there is reluctance to embrace these recommendations due to patient and clinician preference and concerns about inspiratory flow. Understanding prescribing trends and their environmental impact is therefore essential to inform future policy and practice.
Aims and objectives
To describe the trends in inhaler prescribing in Australia and the associated CO2e emissions between 2013-2023.
Methods
Inhaler reimbursement data was extracted from the Australian PBS from 1st January 2013 to 31st December 2023 inclusive. Estimated CO2e emissions per inhaler were derived from United Kingdom (UK), PrescQIPP. 8 For items not listed, emissions were estimated using comparable devices with similar delivery mechanisms and active ingredients. Annual CO2e emissions were calculated by multiplying number of reimbursed inhalers by the estimated carbon emissions per inhaler (gCO2e). (see supplementary materials for item codes).
Results
From 2013-2023, 121,103,866 inhalers were reimbursed: 45.6% inhaled corticosteroid and long acting beta agonists (ICS-LABA), 23.5% short-acting beta agonists (SABA), 16.9% long-acting muscarinic antagonists (LAMA), 5.1% ICS monotherapy, 4.0% LAMA-LABA, 2.7% single inhaler triple therapy (SITT) containing ICS-LAMA-LABA, 1.4% LABA and 0.7% short-acting muscarinic antagonists (SAMA).
Total reimbursements increased by 28.3%, with stable proportion of pMDIs (47.2% in 2013 vs 48.5% in 2023).
Cumulative estimated CO2e emissions were 1,018,103 tonnes CO2 equivalent (tCO2e), peaking in 2022 (105,581 tCO2e). pMDIs represent 47.5% of total inhaler reimbursements, accounting for 95.6% of emissions.
41.8% of ICS-LABA and 77.5% of ICS monotherapy were delivered by pMDI (Figure 1), contributing to 52.4% of total CO2e emissions (533,574 tCO2e) and 8.2% of emissions respectively. SITT prescribing increased from 71,258 (2018) to 1,127,274 (2023); 87.0% are delivered by DPI. LABA, LAMA and LABA-LAMA inhalers were exclusively non-pMDI, collectively contributing only 1.3% of CO2e emissions (Figure 2). Prescribed inhaler reimbursements (columns) and carbon emissions (line) from 2013-2023 by therapeutic class and delivery method. Annual CO2e emissions of preventer inhalers by delivery type (columns) and total CO2e emissions per annum (line).

Reliever inhaler prescribing increased by 34.5% over 10 years, 97.9% delivered by pMDI. SABA pMDIs comprised >96.0% of relievers until 2020, decreasing to 87.5% in 2023 (Figure 3). From 2020, there was a shift towards DPI prescribing for reliever inhalers, increasing from 1.1% to 8.1% in 2023, mostly represented by ICS-formoterol therapy (79.6%) (Figure 3). Anti-inflammatory reliever (AIR) therapy with ICS-formoterol represent 2.1% of all reliever inhalers, increasing from 1.4% of relievers in 2020 to 8.4% in 2023, with a stable proportion (approximately 77%) delivered by DPI. SAMA prescribing remained stable (3.1% in 2013 and 4.1% in 2023) (Figure 3). Annual inhaler reliever therapy reimbursements (columns) and the annual CO2e emissions (line).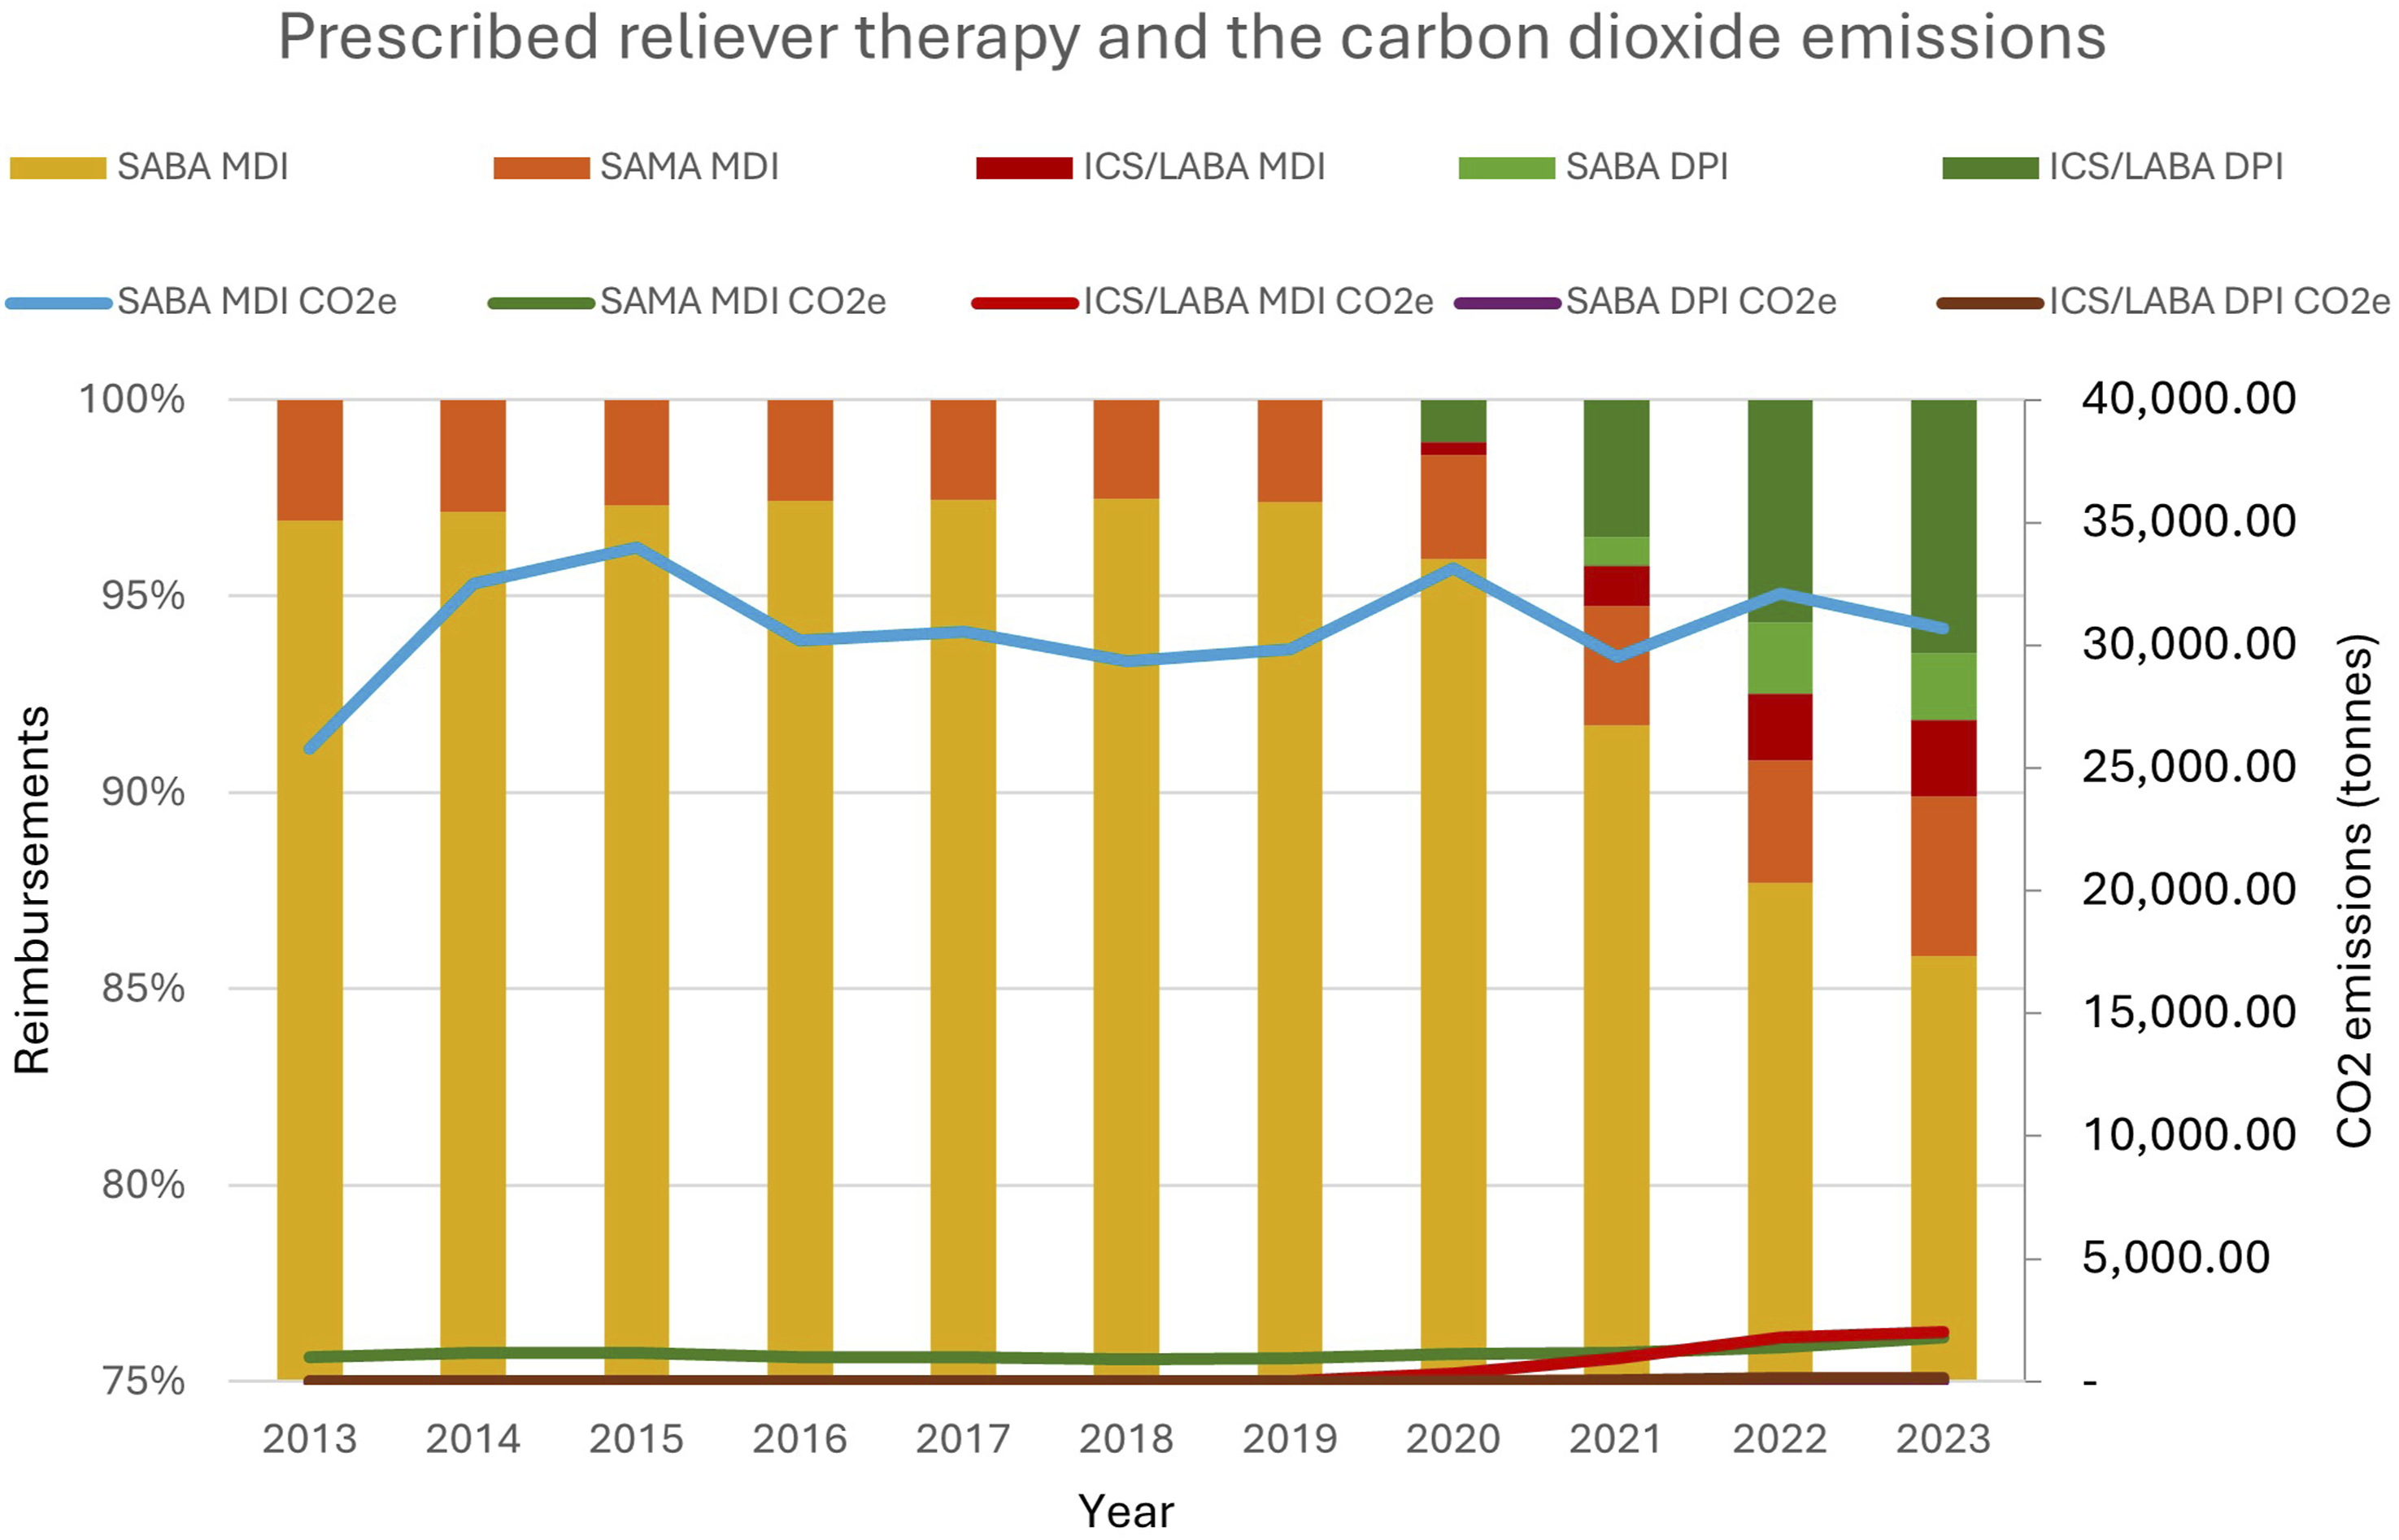
Overall, SABA pMDI comprised 23.4% of all prescribed inhalers but contributed to 94.9% of reliever inhaler-related and 33.2% of total inhaler-related CO2e emissions. Whereas ICS-formoterol pMDI represent 0.1% of all inhalers and contribute to 1.4% of reliever inhaler-related and 0.5 % of total inhaler-related CO2e emissions.
Discussion
Over 10 years, inhaler reimbursements increased by 28.3% with a 53.0% increase in CO2e, likely reflecting population growth and increasing prevalence of airways disease.
Although pMDIs represent 47.5% of inhaler reimbursements, they contribute >96.0% of inhaler-related emissions highlighting the environmental impact of device choice, presenting opportunity to reduce emissions through wider adoption of non-pMDI inhalers where clinically appropriate.
Prescribing of reliever inhalers were predominantly SABA pMDIs, however in 2020, there was a decrease in SABA with increased uptake of AIR therapy (Figure 3). This trend aligns with Australian and international guidelines recommending ICS-formoterol over SABA, as first line AIR or as maintenance and reliever therapy (MART) in 2019 which contributes to improve asthma control, therefore reducing reliance on relievers and severe exacerbations while reducing carbon emissions.2,6,9
In line with Australian National Health and Climate strategy 2023, reducing inhaler-related emissions require a multifaceted approach. Key strategies include improving diagnostic accuracy of airways disease, optimising disease control to reduce reliance on reliever inhalers, adopting AIR-based approach in asthma management, preferentially prescribing lower emission devices and implementation of lower-emission propellants. Establishing a national database capturing over the counter and private inhaler sales would better inform national policies to guide reduction in inhaler-related emissions.
Strengths and limitations
The study used a comprehensive, nationally representative dataset over 10 years, including pre- and post- COVID-19 pandemic, which may influence prescribing behaviours.
Estimated CO2e emission were based on UK data self-reported by manufacturers. Whilst this may introduce imprecision, the values are the most reliable and applicable to Australian inhalers.
The analysis excluded over-the-counter sales and private prescriptions due to lack of data, underestimating proportion of SABA and pMDIs. It is hypothesised over the counter salbutamol sales account for approximately 70% of total salbutamol inhalers sold annually. 10
The dataset accounts for prescribing patterns rather than actual use or participation in initiatives such as the National Return and Disposal of Unwanted Medicines Program. It is assumed that the contents of pMDI cannisters will continue to leak even when disposed of when partially full, therefore reasonable to assume 100% environmental impact of propellants.
Lastly, patient-specific factors were not available, limiting analysis of inhaler choice based on disease severity or patient characteristics.
Conclusion
Inhaler-related CO2e emissions in Australia are largely driven by pMDIs. Transitioning toward non-pMDI inhalers where clinically appropriate offers an opportunity to reduce emissions without compromising care.
Supplemental material
Supplemental Material - Prescribing trends and environmental impact of prescribed inhaled medicines in Australia
Supplemental Material for Prescribing trends and environmental impact of prescribed inhaled medicines in Australia by Sharon W. L. Lam, Vidya V. Navaratnam, Danielle F. Wurzel, Brett Montgomery, John D. Blakey in Chronic Respiratory Disease.
Footnotes
Acknowledgements
This work has been presented as a poster at the ERS Conference 2025.
Funding
The authors received no financial support for the research, authorship, and/or publication of this article.
Declaration of conflicting interests
The authors declared the following potential conflicts of interest with respect to the research, authorship, and/or publication of this article: DFW has received research funding from GSK and MSD, and honoraria from MSD, Sanofi and Praxhub for education/consultancy fees paid to DFW’s research institute. VN or her institution have received honorarium for educational or advisory activity outside this work from Boehringer Ingelheim. VN is funded by the The Laurent Fellowship for Respiratory Health. In the last 3 years, JDB or his institution have received income for educational or advisory activity, or in-kind benefit for research, outside this work from Asthma Australia, Astra Zeneca, Boehringer Ingelheim, Chiesi, GSK, and Sanofi.
Data Availability Statement
The study data can be accessed by contacting the corresponding author.
Supplemental material
Supplemental material for this article is available online.
References
Supplementary Material
Please find the following supplemental material available below.
For Open Access articles published under a Creative Commons License, all supplemental material carries the same license as the article it is associated with.
For non-Open Access articles published, all supplemental material carries a non-exclusive license, and permission requests for re-use of supplemental material or any part of supplemental material shall be sent directly to the copyright owner as specified in the copyright notice associated with the article.