
Abstract
Background
The triglyceride-glucose (TyG) index serves as a reliable proxy for insulin resistance (IR). IR has been linked to heightened incidence, prevalence, or severity of chronic obstructive pulmonary disease (COPD) and asthma. Prior research indicates that critically ill patients are prone to developing IR. Nevertheless, few studies have delved into the correlation between IR and all-cause mortality in critically ill patients with COPD and asthma. Therefore, the aim of this study is to explore the association between the TyG index and all-cause mortality in patients with COPD and asthma, with the goal of assessing the impact of IR on the prognosis of this patient population.
Methods
This is a retrospective study, and all data are from the Medical Information Mart for Intensive Care IV (MIMIC-IV) critical care database. This study included 684 ICU patients with COPD and asthma and divided them into quartiles based on TyG index levels. The primary outcomes of this study were all-cause mortality during follow-up, encompassing mortality at 30 days, 90 days, and 180 days. The Kaplan–Meier analysis was used to compare all-cause mortality among the above four groups. Cox proportional hazards analyses were performed to examine the association between TyG index and all-cause mortality in critically ill patients with COPD and asthma. Restricted cubic spline analysis was used to assess potential nonlinear association between the TyG index and the primary outcome.
Results
A total of 684 patients (53.9% female) were included. The 90-days all-cause mortality rate and 180-days all-cause mortality were 11.7% and 12.3%, respectively. Kaplan-Meier analysis revealed a significant association between the TyG index and both 90-days all-cause mortality (log-rank p = .039) and 180-days all-cause mortality (log-rank p = .017). Cox proportional hazards analysis revealed a significant association between the TyG index and 90-days all-cause mortality in both the unadjusted model (HR, 1.30 [95% CI 1.08–1.57] p = .005) and the model adjusted for age, gender, and diabetes (HR, 1.38 [95% CI 1.15–1.67] p < .001). Similarly, the TyG index was associated with 180-days all-cause mortality in the unadjusted model (HR, 1.30 [95% CI 1.09–1.56] p = .004) and the model adjusted for age, sex, and diabetes (HR, 1.38 [95% CI 1.15–1.66] p < .001). The restricted cubic splines (RCS) regression model indicated a significant nonlinear association between the TyG index and both 90-days and 180-days all-cause mortality. Specifically, TyG index >4.8 was associated with an increased risk of mortality at both 90 days and 180 days.
Conclusions
In summary, our results extend the utility of the TyG index to critically ill patients with COPD and asthma. Our study shows that the TyG index is a potential predictor of all-cause mortality in critically ill patients with COPD and asthma. In addition, in patients with a TyG index exceeding 4.8, there was a heightened risk of mortality. Measuring the TyG index may help with risk stratification and prognosis prediction in critically ill patients with COPD and asthma. Further prospective studies are needed to confirm our findings.
Keywords
Introduction
Chronic obstructive pulmonary disease (COPD) and asthma are the most common chronic respiratory diseases and are among the leading causes of morbidity and mortality worldwide. In 2017, COPD and asthma accounted for 3.9% and 3.6% of global mortality, respectively, and were the leading causes of death from chronic respiratory diseases. 1 The role of metabolism in chronic lung disease is an area of active concern. 2 Metabolic syndrome, characterized by insulin resistance (IR) and a cluster of comorbidities, has been linked to an increased incidence, prevalence, or severity of COPD and asthma.3,4,4–6 This association has led to speculation that metabolic factors may directly impact lung function and disease progression.
The gold standard assessment of insulin resistance is the hyperinsulinemic-euglycemic clamp, a time-consuming and invasive procedure. 7 The effectiveness of fasting blood glucose (FBG) and triglyceride-based Triglyceride-glucose (TyG) index as proxy biochemical measures for evaluating IR has been demonstrated.8,9 Wu et al. demonstrated that an increase in the TyG index was associated with worsening respiratory symptoms and deterioration of lung function in patients with COPD. 10 Additionally, Peter et al. found that insulin resistance was linked to reduced lung function, accelerated loss of lung function, and poor lung function response in patients with asthma. 11 However, research on the relationship between insulin resistance in critically ill patients and mortality rates among individuals with chronic respiratory diseases has been limited. In fact, critically ill patients are more prone to developing insulin resistance. Previous studies have indicated that critically ill patients experience a 50% to 70% reduction in insulin sensitivity compared to healthy controls. 12 Assessing whether the TyG index is an independent influencing factor in patients with chronic lung disease in the ICU may help identify patients at high risk of all-cause mortality for potential early intervention. Therefore, this study aimed to explore the potential relationship between the TyG index and all-cause mortality in critically ill patients with COPD and asthma.
Methods
Study population
This study is a retrospective observational study. Data were extracted from an online international database, the Medical Information Mart for Intensive Care IV (MIMIC-IV), which consists of comprehensive and high-quality data of patients admitted to ICUs at the Beth Israel Deaconess Medical Center between 2008 and 2019. 13 One author (WZ) completed the NIH’s web-based course on securing human research participants and obtained permission to access the dataset (certification number: 55035752). The project was approved by the institutional review boards of MIT and Beth Israel Deaconess Medical Center (BIDMC) and was granted a waiver of informed consent.
We included 53,150 people (≥18 years) with MIMIC-IV and excluded patients without COPD or asthma on admission. Subsequently, we further excluded patients with missing triglyceride (TG) and glucose data on the first day of admission. A total of 684 patients were enrolled in the final study cohort and were divided into four groups based on the quartile of the TyG index on the first day of ICU hospitalization. Patient screening flow chart is displayed in Figure 1. Study flow diagram.
Data collection
Structured Query Language (SQL) with PostgreSQL (version 9.6) was used to extract baseline characteristics, including sex, age, body mass index (BMI), and severity on admission (as measured by sequential organ Failure Assessment (SOFA) score, Systemic inflammatory response syndrome (SIRS) score, Acute physiology score III (APSIII) were extracted from the MIMIC-IV database (MIMIC (mit.edu). The initial TyG index and laboratory indicators within 24 h of ICU admission were also extracted. The TyG index was calculated as ln [fasting triglycerides (mg/dl) × fasting glucose (mg/dl)]/2.9,14 If a variable has been recorded more than once in the previous 24 h, we use its average. Comorbidities identified based on documented ICD-9 codes include coronary heart disease (CHD), heart failure (HF), hypertension, atrial fibrillation (AF), diabetes mellitus (DM), chronic obstructive pulmonary disease (COPD), asthma, acute kidney injury (AKI), chronic kidney disease (CKD).
Variables with missing data are common in MIMIC-IV, Multiple imputation of missing values using generalized linear models. 15 Variables with missing rates over 25% were converted to dummy variables in the models to avoid possible bias caused by direct filling missing values. All screening variables contain <30% missing values.
Primary outcome and clinical definition
The primary outcomes of this study were all-cause mortality during follow-up, encompassing mortality at 30 days, 90 days, and 180 days. Secondary outcomes included in-hospital mortality, as well as the length of stay in the ICU and hospital. Mortality data for discharged patients were obtained from the U.S. Social Security Death Index. AKI was defined according to Kidney Disease: Improving Global Outcomes (KDIGO) guidelines define AKI stage 1 as an increase in serum creatinine level 1.5 to 1.9 times from baseline; AKI stage 2 as an increase in serum creatinine level 2.0 to 2.9 times from baseline; and AKI stage 3 as an increase in serum creatinine level three times from baseline. 16
Statistical analysis
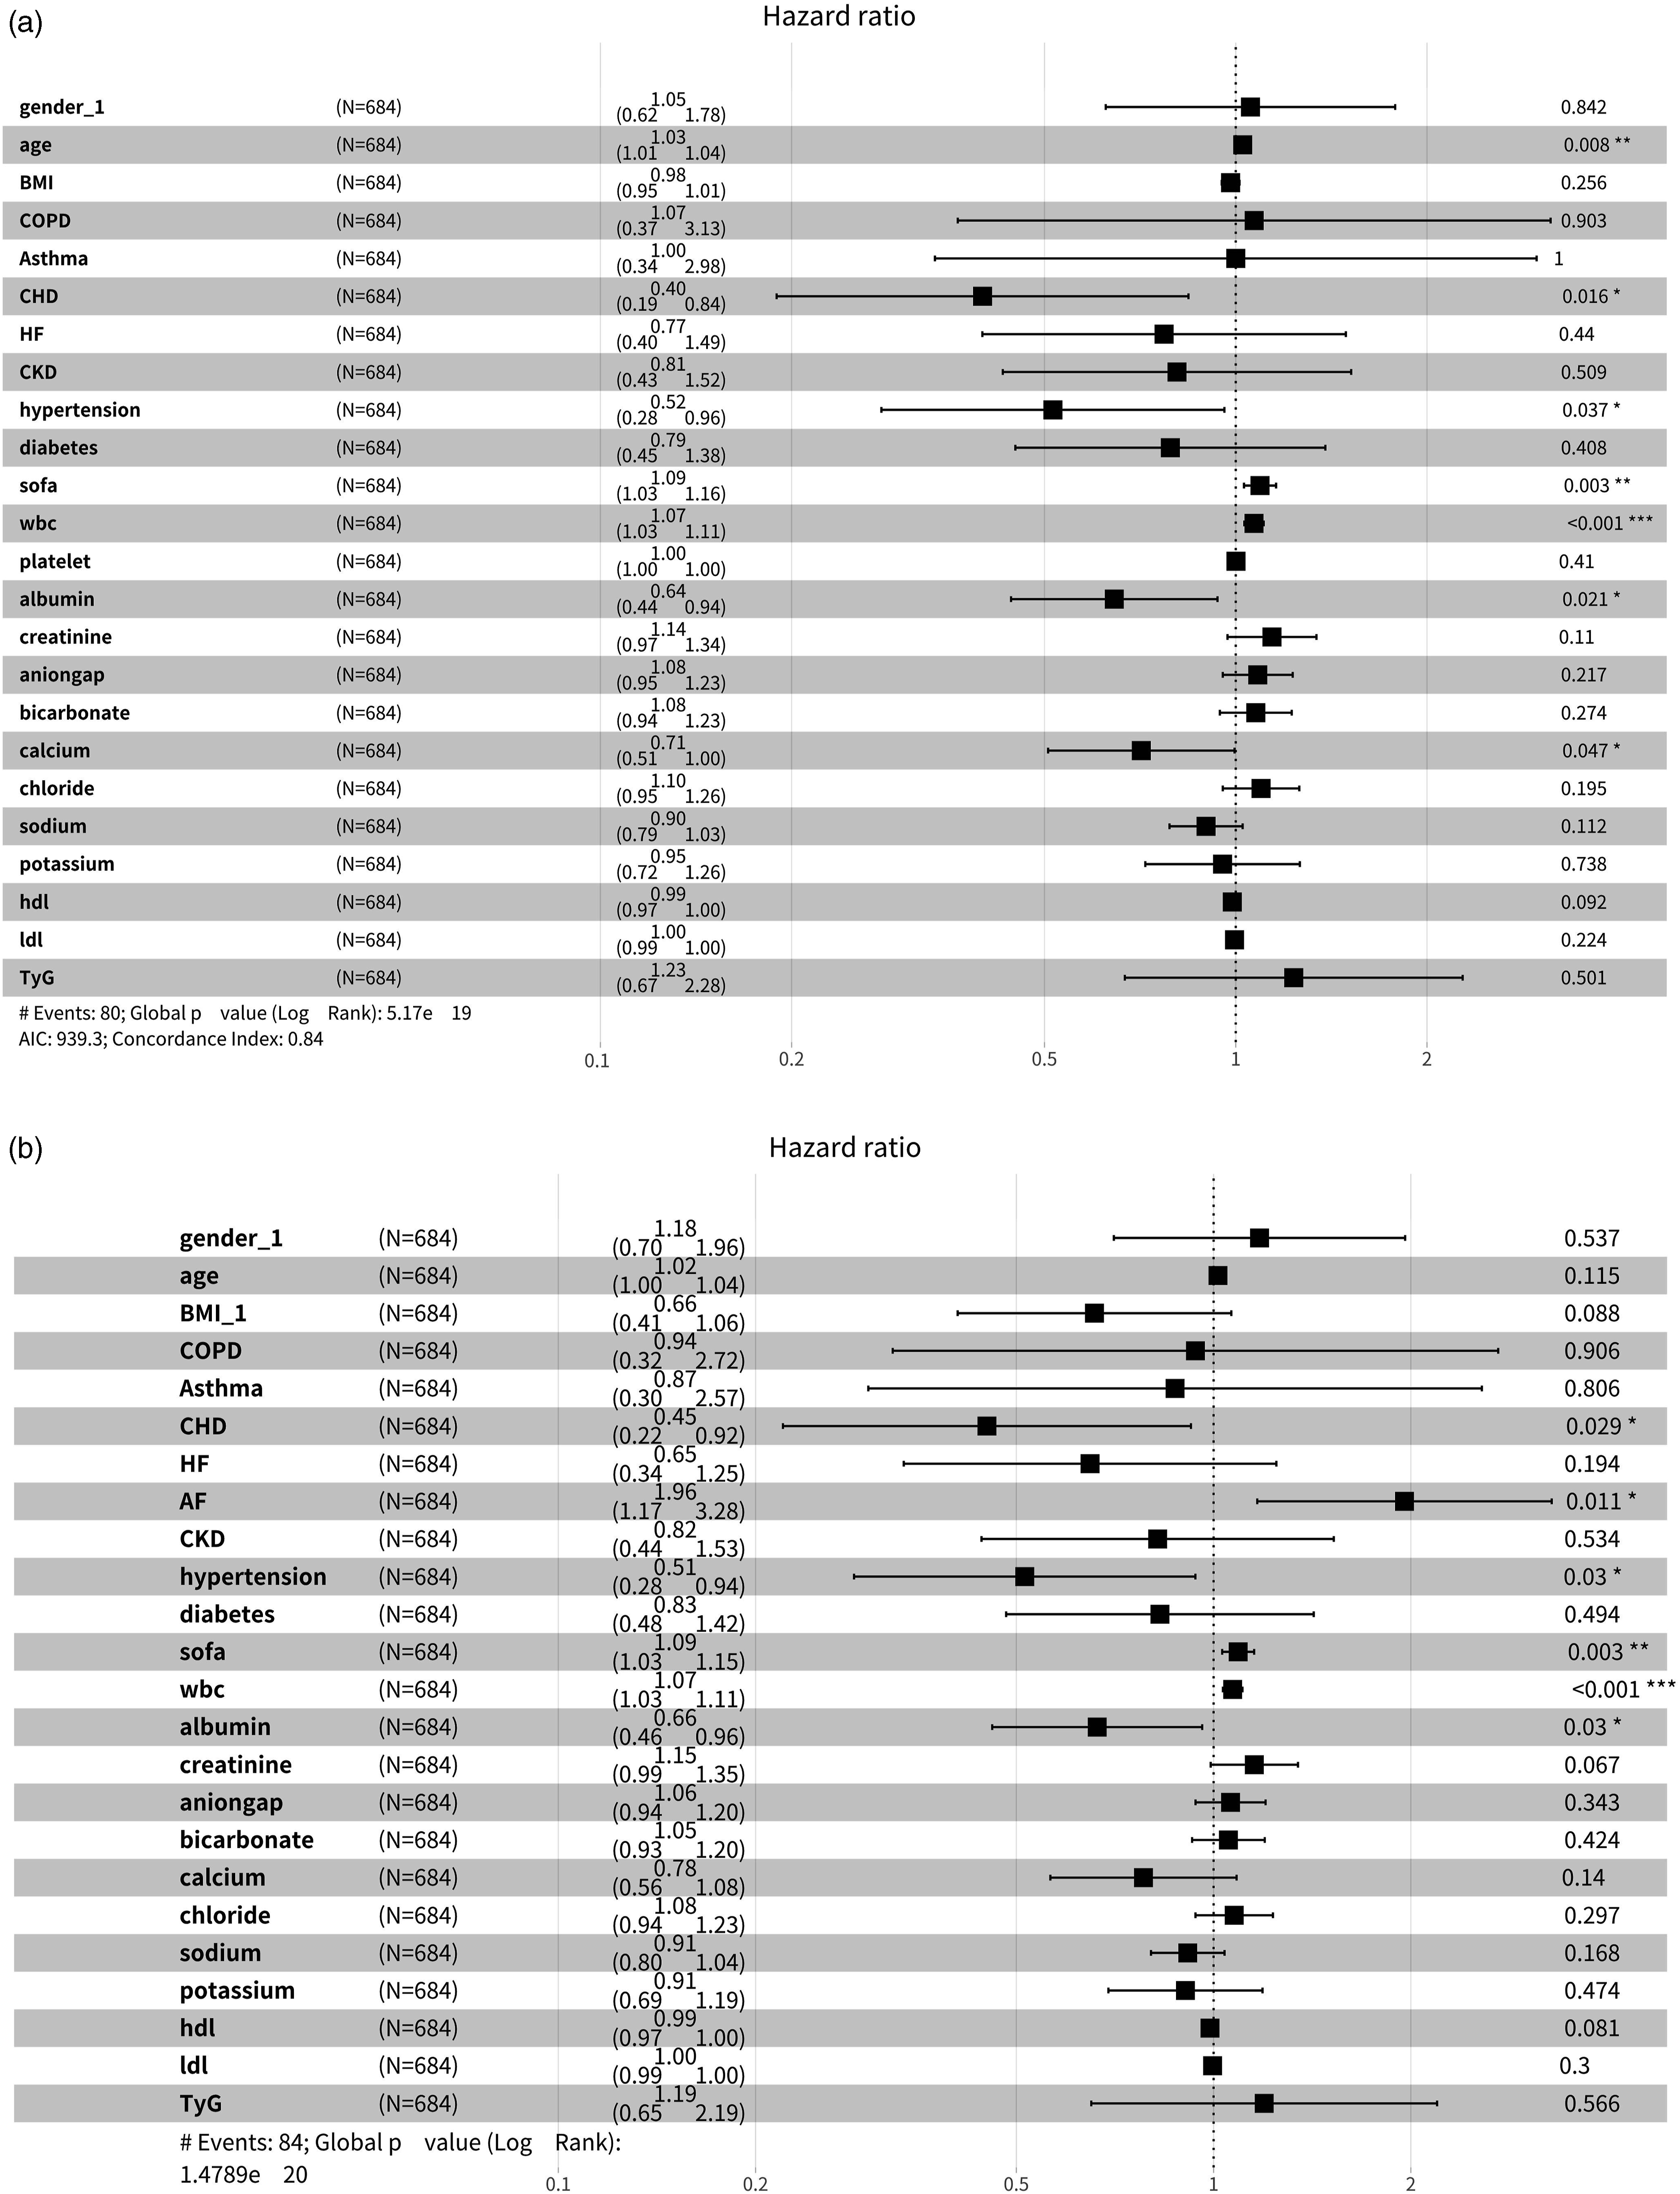
The study population was divided into four groups based on the TyG index quartile on the first day of ICU hospitalization. For continuous variables, data are represented as mean with standard deviation (SD) or median with interquartile range (IQR), and for categorical variables, data are shown as number and frequency (%). Continuous variables were compared using Student’s test or rank sum test, and categorical variables were compared using the Pearson chi-square test or Fisher’s exact test. To assess the incidence of events for the primary outcome between groups according to different levels of the TyG index, we used Kaplan-Meier survival analysis and assessed differences between groups by log-rank tests, and we used the Cox proportional hazards model to estimate the risk ratio (HR) and 95% confidence interval (CI) between the TyG index and the primary outcome and adjusted for multiple models. We included all variables that could affect outcomes into the model for multivariate COX regression and excluded variables that did not meet the Proportional Hazards Assumption. Given the potential for overfitting, we also calculated the variance inflation factor (VIF), Variables with a variance inflation factor ≥5 were excluded (Figure 5). Finally, clinically relevant and prognostically relevant variables were included in the multivariate model: Model 1: unadjusted; Model 2: Adjusted for age, gender, and diabetes; Model 3: Adjusted for age, sex, BMI, diabetes, hypertension, SOFA score, albumin, white blood cell, red blood cell, low-density lipoprotein, triglyceride, coronary heart disease. The TyG index was included in the model both as a continuous variable and as categorical variables (with the lowest TyG index quartile serving as the reference group) for comparison. In addition, we employed a restrictive cubic spline (RCS) model with three hypothetical nodes to assess the nonlinear relationship between the TyG index and all-cause mortality.
All data analysis was performed using R software (version 4.2.2; R Foundation for Statistical Computing, Vienna, Austria) and STATA software (version 17.0). For all analyses, a two-tailed p-value of less than 0.05 was deemed statistically significant.
Results
After reviewing the data of 53,150 patients admitted to the ICU for the first time in the MIMIC-IV database, we included a total of 684 patients. The median age of the enrolled patients was 64 years old (IQR, 54-76), including 369 (53.9%) female patients. The median TyG index of all enrolled patients was 4.81 (IQR, 4.60-5.05). The 28-days all-cause mortality, 90-days all-cause mortality rate and 180-days all-cause mortality were10.1%, 11.7% and 12.3%, respectively.
Baseline characteristics of critical patients with COPD and asthma grouped according to TyG index quartiles a .

aTyG index: Q1 (3.82–4.56), Q2 (4.56–4.81), Q3 (4.81–5.05), Q4 (5.05–6.95).
Abbreviation: TyG index, triglyceride glucose index; BMI, body mass index; COPD, chronic obstructive pulmonary disease; CHD, coronary heart disease; HF, heart failure; AF, atrial fibrillation; CKD, Chronic kidney disease; AKI, acute kidney injury; SOFA, Sequential organ failure assessment; SIRS, Systemic inflammatory response syndrome; APSIII, Acute physiology score III; GCS, Glasgow coma scale; WBC, White blood cell; RBC, Red blood cell; LDL, Low-density lipoprotein; HDL, High-density lipoprotein; LOS, length of stay; IMV, Invasive mechanical ventilation; TG, Triglyceride.
The Kaplan–Meier survival analysis curves for incidence of primary outcomes among groups, according to the TyG index quartiles are shown in Figure 2. During the 90-days follow-up period, statistically significant differences in mortality between groups were observed (log-rank p = .039, Figure 2(a)). Similarly, during the 180-days follow-up period, a statistically significant difference in mortality was also observed between the groups (log-rank p = .017, Figure 2(b)). However, no statistically significant difference was observed in 30-days all-cause mortality (log-rank p = .06, Figure 2(c)). Cox proportional hazards analysis revealed a significant association between the TyG index and 90-days all-cause mortality in both the unadjusted model (HR, 1.30 [95% CI 1.08–1.57] p = .005) and the model adjusted for age, gender, and diabetes (HR, 1.38 [95% CI 1.15–1.67] p < .001). Similarly, the TyG index was associated with 180-days all-cause mortality in the unadjusted model (HR, 1.30 [95% CI 1.09–1.56] p = .004) and the model adjusted for age, sex, and diabetes (HR, 1.38 [95% CI 1.15–1.66] p < .001). However, no statistically significant difference was observed in either fully adjusted model (Table 2). RCS regression models indicated a significant nonlinear association between the TyG index and both 90-days and 180-days all-cause mortality. Specifically, TyG index >4.8 was associated with an increased risk of mortality at both 90 days and 180 days (Figure 3). (a) Kaplan–Meier curves showing cumulative probability of all-cause mortality according to groups at 90 days. (b) Kaplan–Meier curves showing cumulative probability of all-cause mortality according to groups at 180 days. (c) Kaplan–Meier curves showing cumulative probability of all-cause mortality according to groups at 28 days. Cox proportional hazard ratios (HR) for all-cause mortality. aTyG index: Q1 (3.82–4.56), Q2 (4.56–4.81), Q3 (4.81–5.05), Q4 (5.05–6.95). Model 1: unadjusted. Model 2: adjusted for age, sex, BMI, diabetes. Model 3: adjusted for age, sex, BMI, diabetes, hypertension, SOFA score, albumin, white blood cell, red blood cell, low-density lipoprotein, triglyceride, coronary heart disease. (a) Restricted cubic spline for 90-days mortality. (b) Restricted cubic spline for 180-days mortality.


Further evaluation of the risk stratification value of the TyG index for primary outcomes was conducted in various subgroups of the study population, including sex, age, BMI, diabetes, hypertension, CKD, COPD and Asthma (Figure 4). The TyG index was significantly associated with higher risk of 90-days all-cause mortality in subgroups of male [HR (95% CI) 1.41 (1.04–1.91), p = .028], those aged ≤65 years [HR (95% CI) 1.44(1.07–1.94), p = .017], those with BMI >=30 kg/m2 [HR (95% CI) 1.49 (1.07–2.07), p = .018], those without diabetes [HR (95% CI) 1.46 (1.16–1.83), p = .001], those without hypertension [HR (95% CI) 1.41 (1.13–1.77), p = .003], and those without COPD [HR (95% CI) 1.41 (1.07–1.86), p = .014]. Similar results were obtained in stratified analyses of the TyG index and 180-days all-cause mortality (Figure 4). Forest plots of hazard ratios for the primary outcome in different subgroups. (a) 90-days mortality COX forest plot. (b) 180-days mortality COX forest plot.
Discussion
To our knowledge, this study is the first to explore the relationship between the TyG index and prognosis in critically ill patients with COPD and asthma. The main finding of the study is that the TyG index is a potential predictor of mortality in critically ill patients with COPD and asthma, and this finding persists after adjusting for confounding factors such as age, gender, and diabetes. Additionally, our study showed a nonlinear association between the TyG index and 90- and 180-days all-cause mortality, with a TyG index of >4.8 being associated with an increased risk of death at 90 and 180 days.
The effects of insulin resistance on COPD and asthma disease severity and lung function remain poorly understood. In cross-sectional analysis of the American National Health and Nutrition Examination Survey (NHANES-III) and the American Atherosclerosis Risk in Communities (ARIC) cohort, impaired glucose regulation, higher levels of glycated hemoglobin, plasma insulin and c-peptide, and epidemiological indicators of insulin resistance were dose response to impaired lung function. 17 Similarly, in the Ansan-Ansung (AA) cohort, which was established to study non-communicable chronic diseases (including diabetes) in South Korea, the cross-sectional analysis showed a significant reduction in FVC in the IR subgroup, and prospective analysis showed a faster decline in FEV1 and FVC in IR patients. 18 These data support that the TyG index is a potential risk factor for a poor prognosis in chronic lung disease. However, the exact biological mechanism of the relationship between the TyG index and mortality in patients with chronic lungs is unknown. But the possible key pathway may be related to IR. Insulin resistance (IR), defined as decreased insulin sensitivity in peripheral tissues, is a prominent feature of metabolic syndrome. 19 Elevated TyG reflects dyslipidemia and hyperglycemia, which affect lung structure and function.20,21 Hypertriglyceridemia and circulating free fatty acids induce an inflammatory response in macrophages and other immune cells. 21 Signaling of LDL and intracellular cholesterol accumulation has also been shown to drive lipotoxicity within the innate immune system.22,23 Diabetes and hyperglycemia increase the risk and severity of lung infections through compromised host immunity and enhanced virulence of infecting microorganisms. 24 In addition, insulin has been shown to directly induce airway fibroblast collagen deposition and cause airway hyperresponsiveness. 25 All of these pathophysiological changes can further contribute to the onset and progression of chronic lung disease, leading to a poor prognosis.
COPD and asthma stand as prevalent respiratory diseases, contributing significantly to global morbidity and mortality rates. Hence, it becomes imperative to identify mortality risk factors in patients with these conditions to enable timely interventions aimed at reducing mortality rates. Our findings underscore a noteworthy correlation between the TyG index and 90- and 180-days all-cause mortality, a relationship that persisted even after adjusting for confounding factors such as age, gender, and diabetes. However, the lack of significant correlation between the TyG index and all-cause mortality in the multivariate model could be attributed to the condition’s complexity of critically ill patients and the limited sample size. Moreover, in patients with a TyG index >4.8, the risk of death increased with an increase in the value of the TyG index. indicating that maintaining the TyG index below this threshold could potentially mitigate mortality risk. Considering the relatively scant research on this topic, further investigation is warranted to delineate the optimal reference range for the TyG index to guide clinical practice effectively. Interestingly, the risk of death appears to be higher in non-diabetic patients compared to diabetic patients, possibly due to clinicians' preference to use insulin in diabetic patients. Another pertinent revelation from our study was that patients with elevated TyG index levels tended to be younger, and the association between the TyG index and all-cause mortality seemed more pronounced in this demographic—a finding consistent with prior research.26–28 Contrary to conventional wisdom, clinicians may focus more on older patients because they may have more comorbidities, while our study suggests that clinicians may need to accord similar attention to younger patients as they do to older patients, because they may have a higher mortality rate.
Although our study is based on a large multicenter intensive care database, it still has some limitations. First, this is a retrospective analysis from observational studies, so causality cannot be definitively established. although we performed multivariate adjustment and subgroup analyses, residual confounding factors may have influenced prognosis. Second, our analysis focused only on the prognostic value of the baseline TyG index in people with COPD and asthma. However, the TyG index may have changed during hospitalization; Therefore, it is unclear whether changes in the TyG index predict mortality. Finally, the data comes from the United States, so the results may not be fully applicable to ICUs in other countries.
Conclusions
In summary, our results extend the utility of the TyG index to critically ill patients with COPD and asthma. Our study shows that the TyG index is a potential predictor of all-cause mortality in critically ill patients with COPD and asthma. In addition, in patients with a TyG index exceeding 4.8, there was a heightened risk of mortality. Measuring the TyG index may help with risk stratification and prognosis prediction in critically ill patients with COPD and asthma. Further prospective studies are needed to confirm our findings.
Footnotes
Author contributions
WQZ and XS were responsible for the study concept, data collection, data extraction, data analysis and drafting of the manuscript; ZC and WHD reviewed and revision of the manuscript for important intellectual content. All authors read and approved the final manuscript.
Declaration of conflicting interests
The author(s) declared no potential conflicts of interest with respect to the research, authorship, and/or publication of this article.
Funding
The author(s) disclosed receipt of the following financial support for the research, authorship, and/or publication of this article: This Project supported by the National Natural Science Foundation of China (Grant No. 82160020).
Ethical statement
Data Availability Statement
The datasets generated and analyzed during the current study are available from the corresponding author on reasonable request.