
Abstract
Objective
Sarcopenia is a progressive skeletal muscle disorder characterized by declines in muscle mass and function. This study developed a novel composite biomarker, the triglyceride glucose–frailty index, which integrates metabolic and frailty-related measures, and examined its association with sarcopenia in adults.
Methods
Data from 2334 participants in the National Health and Nutrition Examination Survey were analyzed. Multivariable logistic regression was used to evaluate the association between triglyceride glucose–frailty index and sarcopenia after adjustment for key covariates. Restricted cubic spline analyses and subgroup analyses were conducted to assess nonlinearity and consistency. Machine learning models were developed to predict sarcopenia, and model performance was evaluated using the area under the curve, accuracy, and F1-score. SHapley Additive exPlanations analysis was applied to improve model interpretability.
Results
After full adjustment, higher triglyceride glucose–frailty index was significantly associated with an increased risk of sarcopenia (odds ratio = 1.468, 95% confidence interval: 1.246–1.730, p < 0.0001), showing a clear dose–response relationship. Subgroup analyses demonstrated consistent associations across populations. Among the machine learning models, XGBoost showed the best predictive performance, with an area under the curve of 0.978. SHapley Additive exPlanations analysis identified triglyceride glucose–frailty index as the second most important predictor after race.
Conclusions
Triglyceride glucose–frailty index is a strong and independent predictor of sarcopenia. This composite biomarker may serve as a practical tool for improved risk stratification and early prevention in clinical settings.
Keywords
Introduction
Sarcopenia is a clinical syndrome characterized by a progressive and generalized decline in skeletal muscle mass and function. 1 Its pathogenesis is complex and multifactorial, involving interrelated mechanisms such as endocrine dysfunction, chronic inflammation, nutritional deficiencies, and neurodegenerative changes.2–4 As a major contributor to functional impairment, physical frailty, increased risk of falls, higher hospitalization rates, and elevated mortality in older adults, sarcopenia imposes a substantial socioeconomic burden worldwide. Approximately 10%–16% of the global older population is affected by sarcopenia, highlighting the urgent need for more comprehensive and accurate risk assessment tools for early prevention and intervention. 5
The triglyceride-glucose (TyG) index, derived from fasting triglyceride and glucose levels, is a cost-effective and highly efficient biomarker with broad applicability in both clinical and epidemiological contexts. It is strongly associated with insulin resistance (IR) and has shown considerable utility as a practical surrogate marker for metabolic assessment. 6 Evidence suggests that the TyG index exhibits high sensitivity and specificity in detecting reduced insulin sensitivity. 7 IR, in turn, promotes proteolysis, impairs energy metabolism, and facilitates intramuscular lipid accumulation, collectively contributing to the loss of skeletal muscle mass and function.8,9
The frailty index (FI) is a validated quantitative tool in gerontology and aging research, designed to estimate an individual’s biological age by integrating cumulative health deficits. 10 It captures the overall burden of multisystem physiological dysregulation and consistently predicts multiple chronic adverse outcomes, including cardiovascular diseases, metabolic disorders, and musculoskeletal impairments.11–14
Previous studies have examined TyG and FI as independent predictors of sarcopenia. However, evidence remains largely limited to isolated evaluations of each metric, and their combined effect has not been fully explored.15,16 Conceptual frameworks increasingly recognize frailty as an integrated challenge to health, reflecting a multisystem vulnerability that requires multidimensional assessment strategies. 17
Metabolic dysregulation and physiological frailty frequently co-occur in older adults with chronic conditions. To address this dual burden, this study proposes a novel composite indicator—the TyGFI—to simultaneously capture metabolic stress and physiological vulnerability. Using survey-weighted multivariable logistic regression, restricted cubic spline (RCS) modeling, stratified subgroup analyses, and machine learning algorithms, this study aims to develop a comprehensive and refined risk assessment framework for sarcopenia, providing new methodological support for its early identification and prevention.
Materials and methods
Data source and study population
This study used data from four consecutive cycles of the National Health and Nutrition Examination Survey (NHANES) conducted between 2011 and 2018. Each cycle employed a stratified, multistage probability sampling design to generate a nationally representative sample of the US population. NHANES provides extensive standardized data on sociodemographic characteristics, dietary intake, physical examinations, laboratory biomarkers, and self-reported health status, making it a widely used resource for population-based chronic disease research. The analysis sample was constructed as follows: all participants were initially included (n = 39,156), followed by sequential exclusions of individuals under 40 years of age (n = 15,066), those lacking sarcopenia diagnostic data (n = 5319), those without fasting plasma glucose (FPG) data (n = 2458), and those without triglyceride (TG) data (n = 2407). Participants with other key covariates missing or identified as TyGFI outliers were subsequently excluded (n = 11,572). Ultimately, 2334 participants met the inclusion criteria and were retained for the final analysis. All participants provided written informed consent. The NHANES study protocol was approved by the National Center for Health Statistics (NCHS) Research Ethics Review Board; therefore, no additional ethical approval was required for this secondary analysis. A detailed study flowchart is presented in Figure 1.

Flowchart of study population selection.
NHANES complex survey design and analytic strategy
To ensure that the findings are representative of the noninstitutionalized US civilian population, appropriate sampling weights, masked variance units, and strata were incorporated into all statistical analyses. As this study used laboratory and examination data, such as dual-energy X-ray absorptiometry body composition, Mobile Examination Center (MEC) weights (WTMEC2YR) were applied. For the combined dataset spanning four NHANES cycles (2011–2018), new multi-cycle weights were calculated by dividing the 2-year weights by 4, in accordance with NCHS analytic guidelines.
Population inference. Descriptive characteristics (Table 1) and traditional logistic regression analyses were performed using survey-weighted procedures (R survey package) to account for the complex sampling design (strata, clusters, and weights).
Baseline characteristics of NHANES participants according to sarcopenia status.
NHANES: National Health and Nutrition Examination Survey; PIR: poverty–income ratio; BMI: body mass index; ALT: alanine aminotransferase; AST: aspartate aminotransferase; FPG: fasting plasma glucose; TyG: triglyceride glucose index; TyGFI: triglyceride glucose–frailty index; HDL: high-density lipoprotein cholesterol; TC: total cholesterol; TG: triglycerides; LDL: low-density lipoprotein cholesterol; FI: fasting insulin; GGT: gamma-glutamyl transferase; P: phosphorus; Ca, calcium; PA: physical activity.
Predictive modeling. For the machine learning phase, models were developed using unweighted data. This approach prioritizes learning intrinsic biological patterns and feature interactions without biasing the loss function toward participants with high sampling weights. This is standard practice when the primary goal is maximizing predictive accuracy at the feature level rather than estimating population-level prevalence.
For data cleaning, extreme outliers of the key index (TyGFI) were defined as values exceeding three standard deviations from the mean. These outliers were excluded to enhance model stability and reduce noise from biologically implausible measurements.
Outcome definition
The primary outcome of this study was low muscle mass, a key morphological component of sarcopenia. Following the Foundation for the National Institutes of Health (FNIH) Sarcopenia Project criteria, low muscle mass was defined using appendicular skeletal muscle mass (ASM) adjusted for body mass index (BMI). Participants were classified as having low muscle mass if their ASM/BMI ratio was <0.789 for men or <0.512 for women. For brevity, this condition is referred to as “sarcopenia” or “low muscle mass” in subsequent sections, representing the morphological deficit characteristic of the condition.
Definition and calculation of TyGFI and covariates
The TyG index was calculated using the formula: ln [triglycerides (mg/dL) × glucose (mg/dL)/2]. Frailty was measured using the FI. 18 The TyGFI was computed as the product of TyG and FI: TyGFI = TyG × FI. Demographic data were collected via standardized questionnaires and included sex, race, educational background, marital status, smoking habits, alcohol consumption, poverty–income ratio (PIR), BMI, and blood pressure (BP). Participants were classified as drinkers or nondrinkers based on the response to the question: “Do you drink 4/5 cups or more of alcohol per day?” Smoking status was categorized as nonsmokers (<100 cigarettes in a lifetime) or smokers (≥100 cigarettes in a lifetime). Hypertension was defined as an average systolic BP ≥140 mmHg, diastolic BP ≥90 mmHg, self-reported diagnosis, or current use of antihypertensive medication. Dyslipidemia was defined as triglycerides ≥150 mg/dL, total cholesterol (TC) ≥200 mg/dL, low-density lipoprotein cholesterol (LDL-C) ≥130 mg/dL, high-density lipoprotein cholesterol (HDL-C) ≤40 mg/dL (men) or ≤50 mg/dL (women), or current lipid-lowering therapy. Diabetes was defined by any of the following: (a) glycated hemoglobin (HbA1c) ≥6.5%; (b) FPG ≥7.0 mmol/L; (c) random plasma glucose ≥11.1 mmol/L or oral glucose tolerance test ≥11.1 mmol/L; (d) physician-diagnosed diabetes; or (e) current use of antidiabetic medications or insulin. Continuous covariates included self-reported age and laboratory data obtained at the MEC. Laboratory indicators comprised alanine aminotransferase (ALT), aspartate aminotransferase (AST), gamma-glutamyl transferase (GGT), phosphorus (P), calcium (Ca), TC, and HDL.
Correlation analysis and feature selection
Potential multicollinearity was assessed using variance inflation factor (VIF) analysis, with VIF >10 indicating problematic collinearity among features (Supplementary Table S1 for all VIF values). 19
Statistical analysis
All statistical analyses accounted for the complex, multistage, stratified probability sampling design of NHANES through the application of appropriate sample weights. Continuous variables were presented as weighted means ± standard errors (SE), and categorical variables as weighted frequencies and percentages. Differences between groups were assessed using weighted Student’s t-tests for continuous variables and weighted chi-square tests for categorical variables. Multivariable logistic regression models were used to evaluate the independent association between TyGFI and sarcopenia, with results reported as odds ratios (ORs) and 95% confidence intervals (CIs). Potential nonlinear relationships were examined using RCS. All statistical tests were two-sided, with a significance level set at p < 0.05. Analyses were conducted using R software (version 4.4.2) and Python (version 3.9).
Machine learning model construction
To develop predictive models for sarcopenia and evaluate their performance, the data were randomly split into training and testing sets in a 7:3 ratio. Preprocessing and feature transformation were performed prior to model training. The composite biomarker TyGFI was z-score standardized (mean ≈ 0, SD ≈ 1), while other continuous laboratory variables were retained in their original measurement units. Categorical predictors were represented using integer-coded categories (label/integer encoding) rather than one-hot encoding.
To address class imbalance, the Synthetic Minority Over-sampling Technique (SMOTE) was applied exclusively to the training set after data splitting, preventing data leakage. The testing set consisted entirely of original, unweighted real-world data to ensure an unbiased evaluation of model generalization. 20 SMOTE was applied with a sampling ratio of 1.0 and a random seed of 123, while the testing set was not resampled. The machine learning algorithms employed included k-nearest neighbors (KNN), random forest (RF), support vector machine (SVM), extreme gradient boosting (XGB), Naïve Bayes (NB), and light gradient boosting machine (LGBM). The constructed models were applied to the testing set. Within the training set, stratified 5-fold cross-validation was conducted for performance estimation and model comparison. Cross-validation was conducted on the training data only, with the held-out testing set used for final evaluation. No extensive hyperparameter optimization (e.g. grid/random/Bayesian optimization) was performed; models were trained using prespecified settings. Key parameters included the following: RF (n_estimators = 100, max_depth = 3, criterion = gini), SVM (kernel =rbf, C = 1.0), KNN (k = 5, weights =uniform), NB (Bernoulli, alpha = 1.0), LGBM (learning_rate = 0.1, boosting_type = gbdt), and XGB (booster = gbtree). For algorithms involving stochasticity, model-level random seeds were fixed at 1.
Model evaluation and interpretation
Model performance was evaluated using accuracy, precision, recall, F1-score, and the area under the receiver operating characteristic curve (AUC). Cross-validation results were summarized across the five folds, and the final model was further assessed on the held-out testing set. The model demonstrating the best discriminative power was selected for subsequent analyses. To further evaluate predictive performance and clinical utility, calibration curves, decision curves, and decision curve analysis (DCA) curves were plotted. Model interpretation was conducted using SHapley Additive exPlanations (SHAP).
Statistical analyses were conducted in R (version 4.4.2) via RStudio, while machine learning modeling was implemented in Python. Detailed hyperparameter settings and Python package versions are provided in Supplementary Table S2.
Results
Baseline characteristics of the study population
The NHANES cohort included 2334 participants, of whom 271 had sarcopenia and 2063 did not (Table 1). The overall mean age of the participants was 49.30 ± 5.76 years; 51.16% were female, and 35.05% were non-Hispanic White. Compared with participants without sarcopenia, those with sarcopenia were generally older; had lower PIR and HDL; and had higher BMI, FPG, TyG, TyGFI, TG, and FI. The sarcopenia group had higher proportions of drinkers, hypertension, dyslipidemia, and diabetes but a lower proportion reporting physical activity (PA).
Association between TyGFI and sarcopenia
The study found a significant positive association between TyGFI and sarcopenia risk. When TyGFI was analyzed as a continuous variable in logistic regression, each unit increase in TyGFI was associated with a significant rise in sarcopenia risk. In the crude model (Model 1), this association was statistically significant (OR = 1.5584; 95% CI: 1.3842–1.7544; p < 0.0001). After adjusting for demographic covariates (age, sex, race, marital status, and educational level; Model 2), the association remained robust (OR = 1.6133; 95% CI: 1.4203–1.8333; p < 0.0001). Further adjustment for clinical comorbidities (Model 3) yielded consistent results (OR = 1.4681; 95% CI: 1.2457–1.7300; p < 0.001), confirming the stability of the association.
When TyGFI was categorized by quartiles, a stepwise increase in sarcopenia risk was observed across higher quartiles (Table 2). Compared with participants in the lowest quartile (Q1), those in higher quartiles had progressively higher odds of sarcopenia. In the unadjusted model, the ORs for Q2, Q3, and Q4 were 1.551 (95% CI: 1.0047–2.4211; p = 0.0497), 2.1749 (95% CI: 1.4435–3.3319; p = 0.0003), and 3.4403 (95% CI: 2.3363–5.1765; p < 0.0001), respectively, indicating a significant linear trend (p for trend < 0.0001). This positive gradient persisted after demographic adjustment (Model 2), with participants in Q4 showing a 3.725-fold increased risk compared with Q1 (OR = 3.725; 95% CI: 2.4772–5.7137; p < 0.001; p for trend < 0.001). Although the association was slightly attenuated in the fully adjusted model (Model 3), it remained statistically significant (Q4 vs. Q1: OR = 2.7411; 95% CI: 1.6759–4.5398; p = 0.0001; p for trend = 0.0018). Overall, these findings indicate a robust positive association between TyGFI and sarcopenia risk, regardless of whether analyzed as a continuous or categorical variable.
Association between TyGFI and sarcopenia.
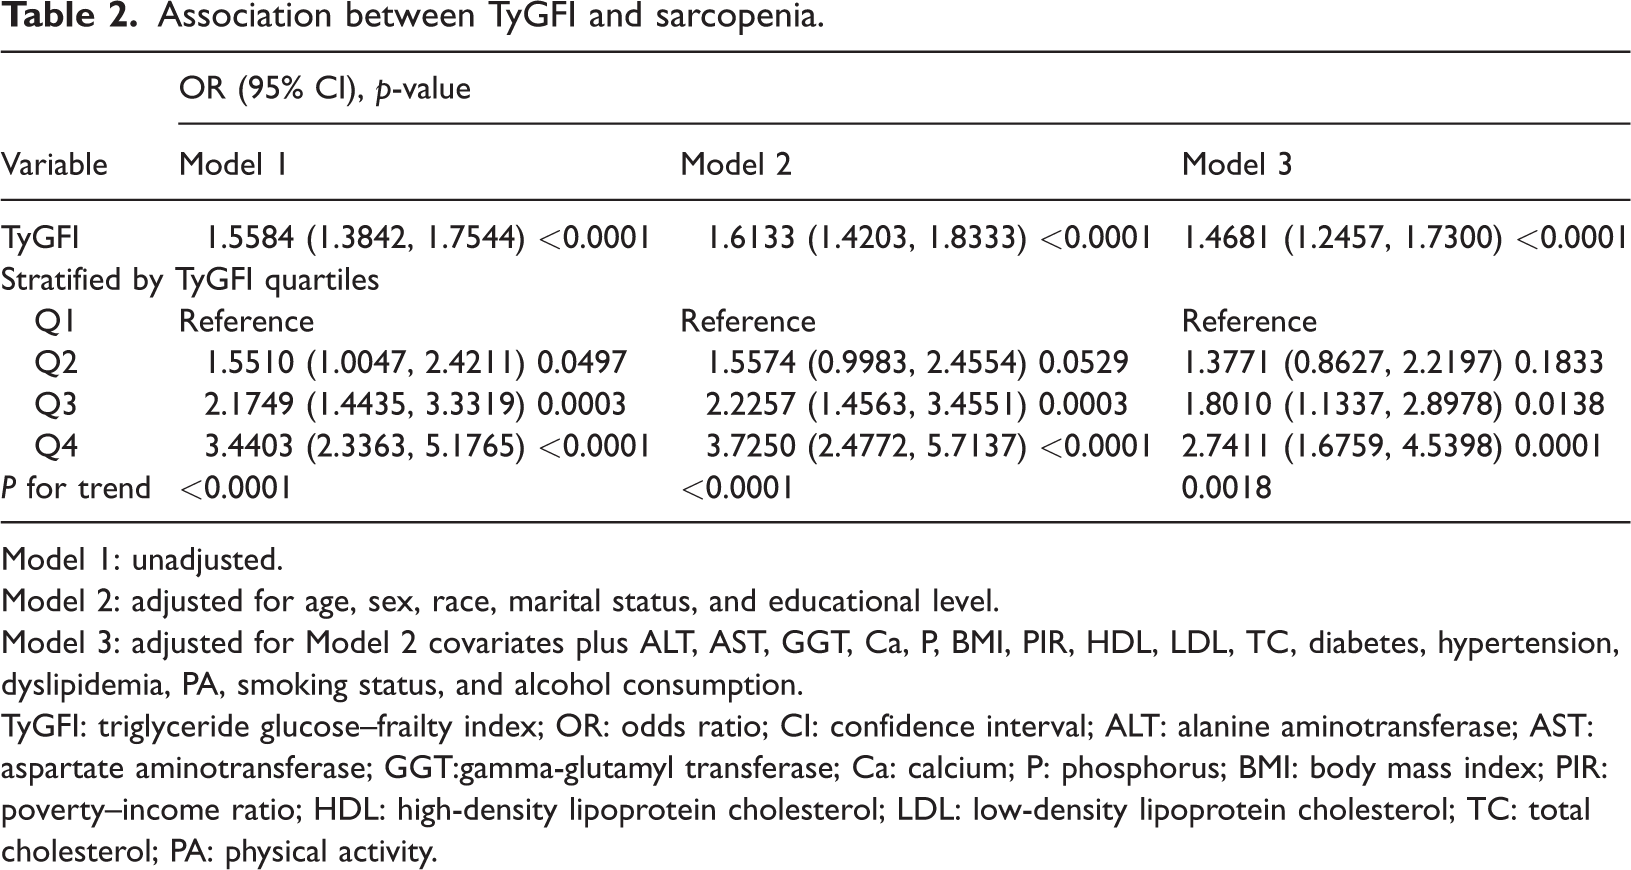
Model 1: unadjusted.
Model 2: adjusted for age, sex, race, marital status, and educational level.
Model 3: adjusted for Model 2 covariates plus ALT, AST, GGT, Ca, P, BMI, PIR, HDL, LDL, TC, diabetes, hypertension, dyslipidemia, PA, smoking status, and alcohol consumption.
TyGFI: triglyceride glucose–frailty index; OR: odds ratio; CI: confidence interval; ALT: alanine aminotransferase; AST: aspartate aminotransferase; GGT:gamma-glutamyl transferase; Ca: calcium; P: phosphorus; BMI: body mass index; PIR: poverty–income ratio; HDL: high-density lipoprotein cholesterol; LDL: low-density lipoprotein cholesterol; TC: total cholesterol; PA: physical activity.
As a sensitivity analysis, TyGFI was compared with TyG alone, FI alone, an additive model (TyG + FI), and an interaction model (TyG + FI + TyG×FI) using fully adjusted logistic regression (Supplementary Table S3). The interaction term (TyG×FI) was not statistically significant (p for interaction = 0.558).
To assess the robustness of multivariate adjustments, multicollinearity among covariates was evaluated. Collinearity diagnostics (Supplementary Table S4) showed that all VIF values were <2.0 (range: 1.07–1.60) and tolerance values were consistently >0.60, indicating no significant multicollinearity in the fully adjusted model.
Nonlinear dose–response relationship between TyGFI and sarcopenia
Figure 2 illustrates the dose–response relationship between TyGFI and sarcopenia risk, evaluated using an RCS model within a weighted logistic regression framework. The overall association was statistically significant (p-overall < 0.001), whereas there was no evidence of nonlinearity (p-nonlinear = 0.643). As TyGFI increased, the odds of sarcopenia rose steadily.

RCS analysis of the association between TyGFI and sarcopenia. The model was adjusted for age, sex, race, marital status, education, ALT, AST, GGT, Ca, P, BMI, PIR, HDL, LDL, TC, diabetes, hypertension, dyslipidemia, PA, smoking status, and alcohol consumption. RCS: restricted cubic spline; TyGFI: triglyceride glucose–frailty index; ALT: alanine aminotransferase; AST: aspartate aminotransferase; GGT: gamma-glutamyl transferase; Ca: calcium; P: phosphorus; BMI: body mass index; PIR: poverty–income ratio; HDL: high-density lipoprotein cholesterol; LDL: low-density lipoprotein cholesterol; TC: total cholesterol; PA: physical activity.
Subgroup and sensitivity analyses
To further assess the robustness and potential heterogeneity of the association between TyGFI and sarcopenia, we conducted stratified analyses by subgroups defined by sex, BMI, alcohol consumption, hypertension, dyslipidemia, diabetes, and PA status (Figure 3). Across all subgroups, the positive association between TyGFI and sarcopenia was generally consistent in both direction and magnitude. Although no statistically significant interactions were observed (p for interaction > 0.05 for all), the consistent patterns of effect estimates suggest that the association is relatively stable across different population strata.
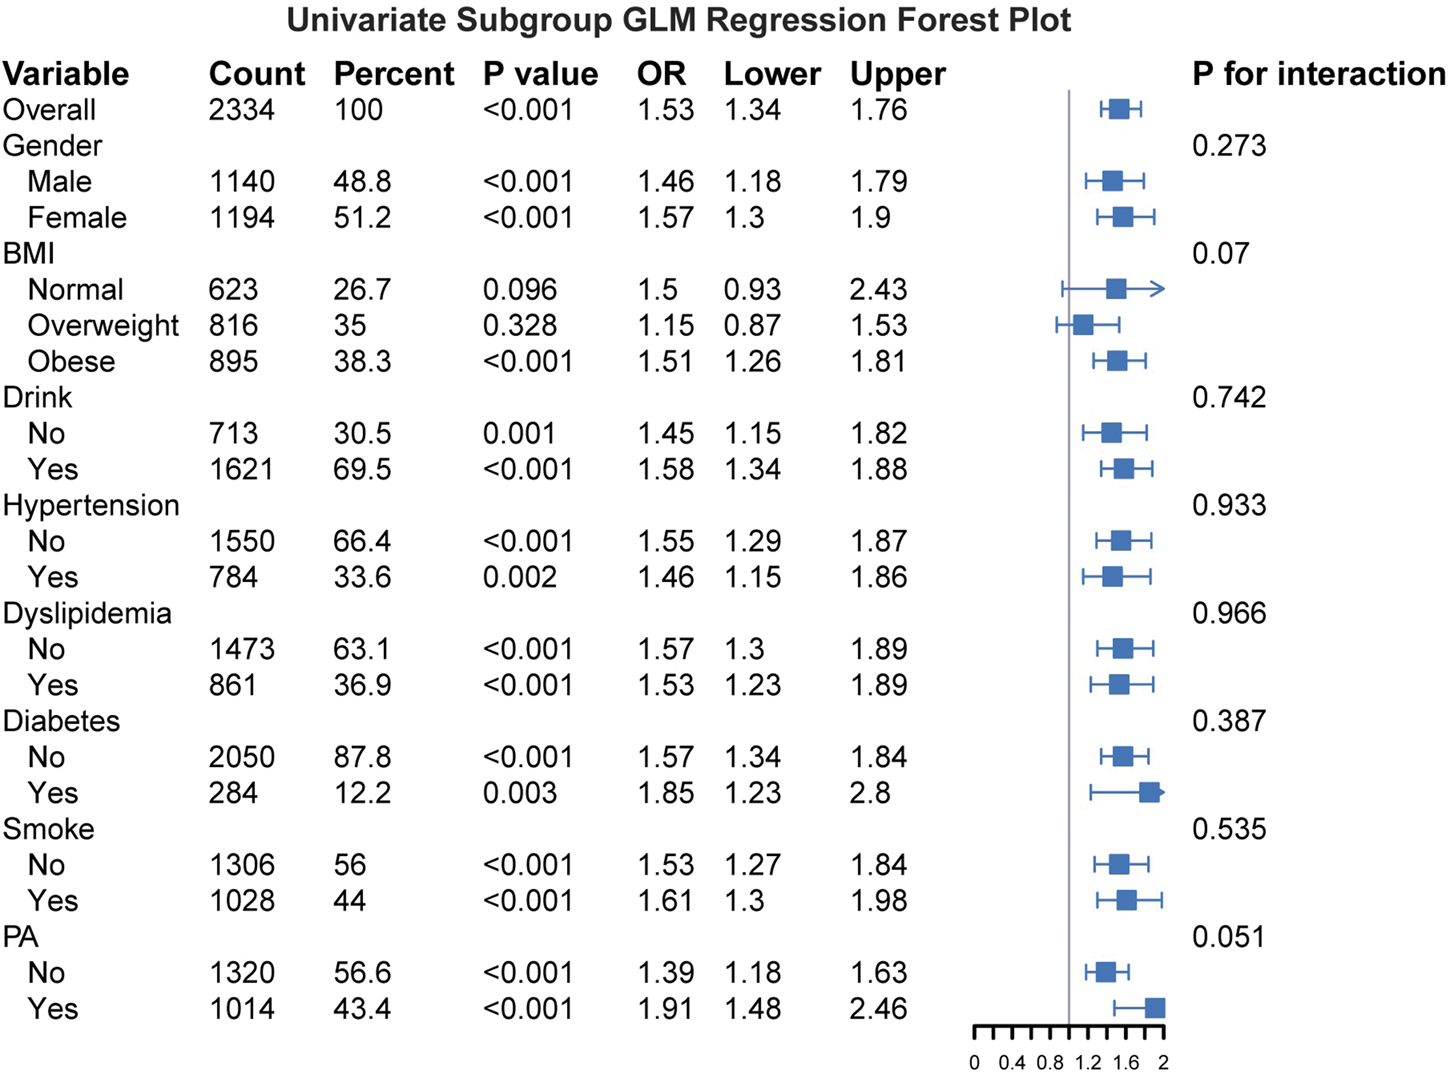
Subgroup analysis of the association between TyGFI and sarcopenia. The model was adjusted for age, race, PIR group, ALT, AST, HDL, TC, LDL, marital status, GGT, P, and Ca. TyGFI: triglyceride glucose–frailty index; PIR: poverty–income ratio; ALT: alanine aminotransferase; AST: aspartate aminotransferase; HDL: high-density lipoprotein cholesterol; TC: total cholesterol; LDL: low-density lipoprotein cholesterol; GGT: gamma-glutamyl transferase; P: phosphorus; Ca: calcium.
Significant positive correlations were observed in both males (OR = 1.46; 95% CI: 1.18–1.79; p < 0.001) and females (OR = 1.57; 95% CI: 1.30–1.90; p < 0.001). Among participants with normal BMI, the association approached statistical significance (p = 0.096); in overweight participants, it was not statistically significant (p = 0.328), while in obese participants, a significant positive correlation was observed (OR = 1.51; 95% CI: 1.26–1.81; p < 0.001). However, the interaction between BMI groups and TyGFI was not statistically significant (p for interaction = 0.07), indicating that although the strength of the association varied, there was no formal evidence of effect modification. Significant positive associations were also observed in subgroups defined by alcohol consumption, hypertension, dyslipidemia, diabetes, and PA status.
Although the effect estimate was numerically larger in the obese group, the lack of a significant interaction confirms that the association between TyGFI and sarcopenia is generally consistent across the studied population strata.
Performance of machine learning models
Table 3 presents the performance metrics of six machine learning algorithms on the independent testing set. All models were trained on the training set using stratified five-fold cross-validation for internal validation and were subsequently evaluated on the held-out testing set. Multiple metrics were assessed, including AUC, accuracy, precision, specificity, recall, and F1-score.
Performance comparison of machine learning models on the testing set (95% CI).

95% CIs were calculated using 1000 bootstrap iterations.
The AUC of XGBoost was significantly higher than those of RF, KNN, SVM, and NB (p < 0.001).
AUC: area under the receiver operating characteristic curve; KNN: k-nearest neighbors; RF: random forest; SVM: support vector machine; NB: naïve Bayes; CI: confidence interval.
To provide robust performance estimates, 95% CIs for each metric were calculated using 1000 bootstrap iterations. Among the evaluated models, XGBoost achieved the highest discriminative performance, with an AUC of 0.978 (95% CI: 0.971–0.985), accuracy of 92.6% (91.2%–94.1%), and F1-score of 0.923 (90.7%–93.8%) (Table 3, Figure 4(a)). Bootstrap difference tests revealed that XGBoost had a significantly higher AUC than RF, KNN, SVM, and NB (all p < 0.001). Although the difference between XGBoost and LightGBM was not statistically significant (p = 0.160), XGBoost exhibited slightly higher numerical values across most metrics. Consequently, XGBoost was selected for subsequent interpretation. Calibration curves demonstrated good agreement between predicted and observed outcomes, with XGBoost closely following the ideal diagonal line in the validation cohort (Figure 4(b)), indicating high predictive accuracy. DCA further showed that the model’s net benefit consistently exceeded two extreme strategies (treat all or treat none) across a wide range of threshold probabilities, suggesting potential clinical utility (Figure 4(c)). Moreover, XGBoost achieved the highest area under the precision–recall curve (0.98), highlighting robust performance under varying precision–recall conditions (Figure 4(d)). In summary, these results indicate that machine learning models, particularly XGBoost, can effectively identify patients with sarcopenia.
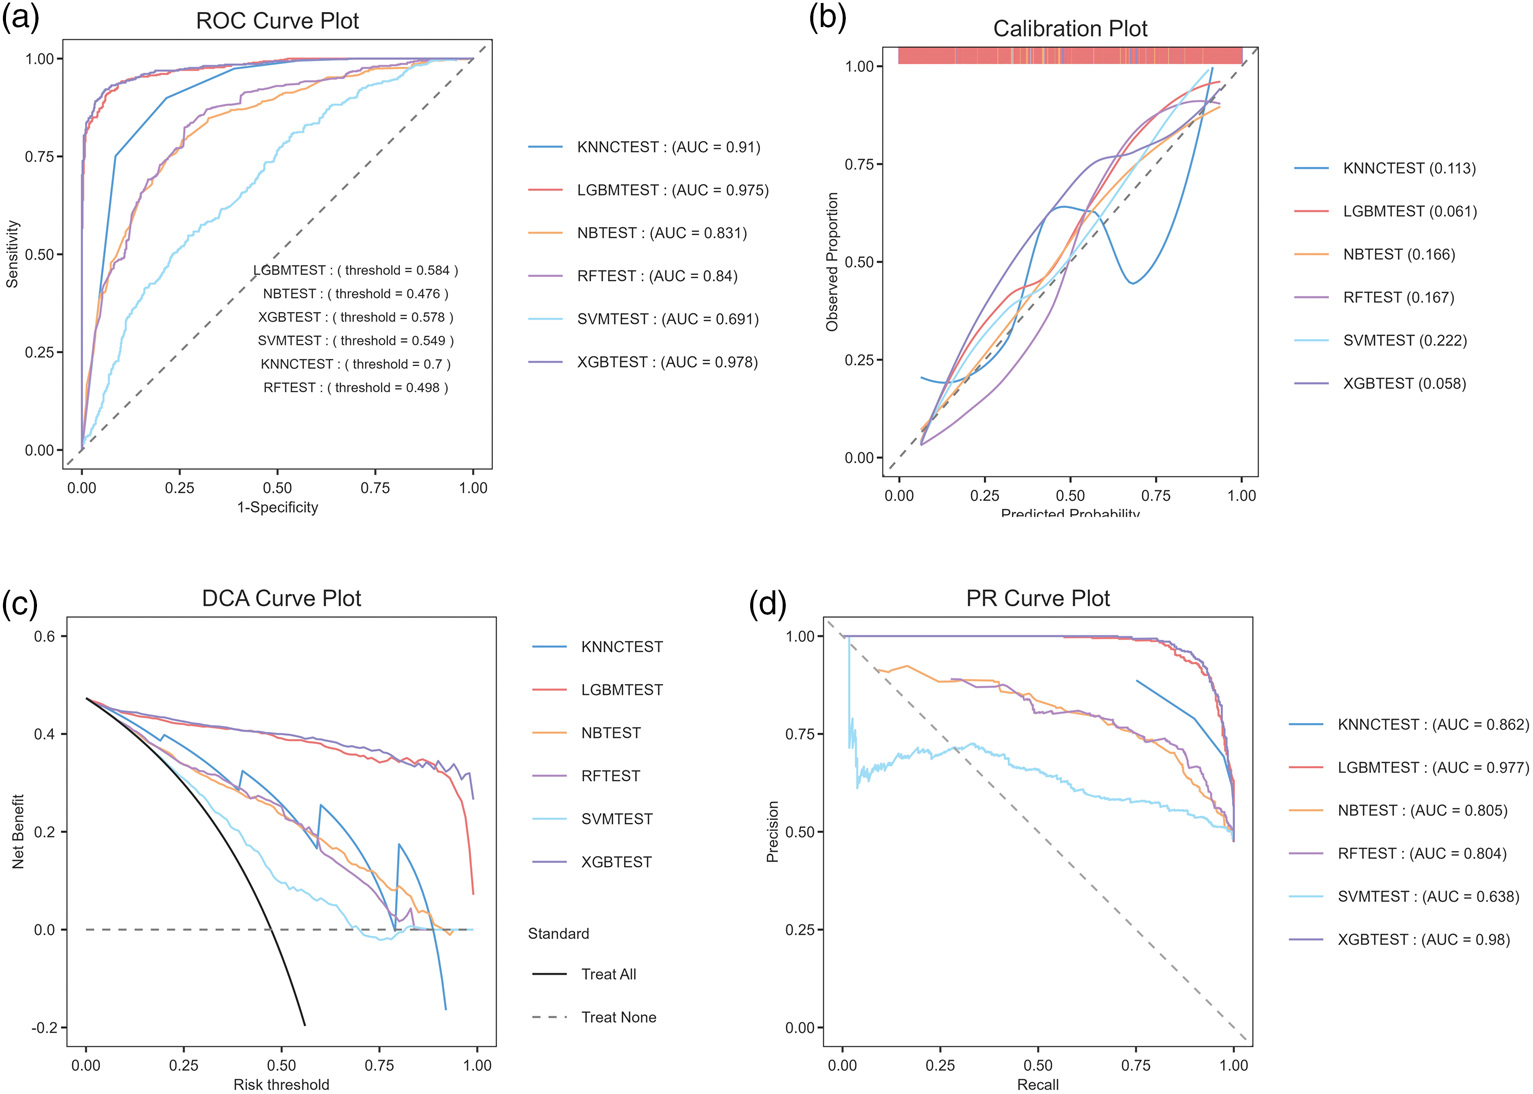
Performance comparison of six machine learning models for predicting sarcopenia. (a) ROC curves and AUC. (b) Calibration curves and Brier scores. (c) DCA curves and areas under the curve and (d) Precision–recall curves and areas under the curve. ROC: receiver operating characteristic; AUC: area under the curve; DCA: decision curve analysis.
Interpretability of the machine learning models
To evaluate the relative importance and directional impact of individual predictors in sarcopenia classification, we performed SHAP analysis using the XGBoost model. The results indicated that race was the most influential variable, followed by TyGFI, Ca, and PA (Figure 5(a)). Notably, TyGFI ranked second overall, highlighting its potential independent role in predicting sarcopenia risk. To further illustrate each feature’s contribution to model predictions, we generated a force plot (Figure 5(b)) and a waterfall plot (Figure 5(c)). As shown in Figure 5(b), features were ranked according to their contribution to predicting nonsarcopenia, with cumulative contributions leading to a final prediction of −3.97. As shown in Figure 5(c), blue features indicate a reduction in sarcopenia risk, while red features indicate an increase in sarcopenia risk. These visualizations provide detailed insights into the model’s decision-making process. The SHAP beeswarm plot (Figure 6) demonstrates a clear positive relationship between higher TyGFI values and sarcopenia risk, supporting its role as a risk factor.

Variable importance in the XGB model. (a) SHAP importance plot. (b) SHAP force plot illustrating how race groups, PIR groups, LDL, hypertension status, and 17 other features reduce sarcopenia risk (blue), whereas BMI groups increase risk (red) and (c) SHAP waterfall plot illustrating how race groups, PIR groups, LDL, hypertension status, sex, PA, ALT, GGT, and 13 other features reduce sarcopenia risk (blue), whereas BMI groups increase risk (red). XGB: extreme gradient boosting; SHAP: SHapley Additive exPlanations; PIR: poverty–income ratio; LDL: low-density lipoprotein cholesterol; BMI: body mass index; PA: physical activity; ALT: alanine aminotransferase; GGT: gamma-glutamyl transferase.

SHAP summary plot illustrating the effects of the top features on sarcopenia risk. The y-axis lists features in descending order of importance. The x-axis represents SHAP values, where positive values indicate an increased likelihood of sarcopenia and negative values indicate a decreased likelihood. Each dot represents one participant, and color indicates the feature value (red = high and blue = low). TyGFI, ranked second, shows a clear pattern in which higher values are associated with positive SHAP values, indicating increased sarcopenia risk. SHAP: SHapley Additive exPlanations; TyGFI: triglyceride glucose–frailty index.
Discussion
This study, based on a nationally representative sample of US adults (NHANES), systematically revealed a significant and robust association between the TyGFI and sarcopenia. Multivariate logistic regression analysis showed that each unit increase in TyGFI was associated with a significantly higher risk of sarcopenia (fully adjusted OR = 1.4681; 95% CI: 1.2457–1.7300; p < 0.0001). When participants were stratified by quartiles, those in Q4 exhibited a 2.7411-fold higher risk of sarcopenia compared to Q1 (95% CI: 1.6759–4.5398; p = 0.0001), with a significant dose–response trend (p for trend = 0.0018). RCS analysis further confirmed a significant, progressively increasing relationship between TyGFI and sarcopenia risk (p-overall < 0.001). Among six machine learning models, XGBoost demonstrated the highest predictive performance (AUC = 0.9779; accuracy = 0.9265). SHAP-based interpretability analysis ranked TyGFI as the second most important predictor after race, with a contribution substantially higher than most traditional indicators, underscoring its critical role in sarcopenia risk assessment.
To validate SHAP-based feature importance, complementary analyses using model-agnostic permutation importance and RF Gini importance were performed. Across all methods, TyGFI consistently ranked among the top predictors (e.g. top 5 in RF importance), confirming its robust contribution. Visualization of representative decision tree structures (Supplementary Figure S1) illustrated how TyGFI effectively splits the population to refine risk stratification, demonstrating stable predictive value across methodological approaches. Although traditional logistic regression elucidated the independent association between TyGFI and sarcopenia, machine learning (specifically XGBoost) was employed to maximize predictive accuracy for potential clinical applications. The superior performance of XGBoost (AUC = 0.978) compared with conventional linear models highlights the value of capturing complex, nonlinear interactions between metabolic and frailty components, which are often oversimplified in standard statistical approaches. Consequently, the developed model serves not only as an explanatory tool but also as a cost-effective screening instrument for primary care settings where gold-standard diagnostic modalities (e.g. DXA) are unavailable or impractical.
The data revealed a strong association between the TyGFI and sarcopenia, likely reflecting synergistic adverse effects of metabolic dysfunction and physiological frailty. As a composite indicator, TyGFI captures this complex pathophysiological process. Previous large-scale studies have confirmed a significant positive correlation between IR and muscle mass decline. 21 TyG has been widely recognized as an effective marker of IR and a significant predictor of sarcopenia.22,23 The FI quantifies diminished functional reserve by assessing cumulative multisystem health deficits, with sarcopenia—defined by progressive loss of skeletal muscle mass and function—representing a core manifestation. These conditions exhibit substantial clinical overlap and common pathophysiological pathways within geriatric syndromes. Accordingly, TyGFI provides a composite metric that not only reinforces the independent association between TyG and sarcopenia but also highlights a synergistic amplification of risk arising from metabolic disorders and physiological frailty. This composite index offers a comprehensive assessment approach and a more robust tool for elucidating sarcopenia pathogenesis and facilitating early identification of high-risk populations.
From a mechanistic perspective, the observed association between TyG and sarcopenia is consistent with established pathways linking IR to muscle homeostasis, although the cross-sectional nature of our data precludes causal inference. Prior studies suggest that IR may suppress anabolic signaling pathways, such as PI3K/Akt/mTOR, while upregulating catabolic processes, including the ubiquitin–proteasome system. 24 Metabolic dysfunction is also frequently accompanied by mitochondrial impairment and chronic inflammation,25–27 both of which contribute to muscle wasting. These observations support emerging evidence that musculoskeletal decline is not solely mechanical but is influenced by complex systemic factors, including immunometabolic dysregulation and neural vulnerability. 28 Collectively, these shared pathophysiological mechanisms provide a plausible biological rationale for the utility of TyGFI as a risk marker, reflecting the synergistic impact of metabolic and inflammatory stress on muscle health.
Conceptually, TyGFI was defined as TyG × FI to capture a potential synergistic “vicious cycle,” in which metabolic dysfunction (IR) and multisystem vulnerability (frailty-related inflammaging/oxidative stress) jointly amplify sarcopenia risk beyond the contribution of either factor alone.
Incorporating a multisystem perspective, the FI used in this study provides critical insights into sarcopenia pathogenesis, complementing the metabolic mechanisms described above.29,30 Sarcopenia and frailty exhibit bidirectional interactions and substantial pathophysiological overlap within geriatric syndromes. 31 Sarcopenia constitutes a core physiological manifestation and driver of frailty; as the body’s largest protein reservoir and metabolic organ, loss of skeletal muscle mass and function directly leads to diminished strength, reduced mobility, and metabolic dysregulation, thereby increasing frailty risk.32,33 Conversely, frailty accelerates sarcopenia development by promoting mechanisms that disrupt muscle homeostasis. Hallmarks of frailty, such as persistent low-grade inflammation and oxidative stress, drive muscle protein breakdown while simultaneously suppressing protein synthesis via inflammatory cytokines.34,35
The construction of TyGFI as a multiplicative composite index is grounded in the biological hypothesis of a “vicious cycle” between metabolic dysfunction and cumulative physiological deficits. Mechanistically, IR (reflected by TyG) promotes muscle protein degradation via the ubiquitin–proteasome pathway and impairs mitochondrial function, directly contributing to muscle loss. Concurrently, frailty (reflected by FI) is characterized by chronic low-grade inflammation (“inflammaging”) and oxidative stress, which further exacerbate IR. The multiplicative derivation (TyG × FI) captures this synergistic amplification, in which the simultaneous presence of both conditions elevates sarcopenia risk beyond the sum of their independent effects. Although an additive model (TyG + FI) also performs well statistically, TyGFI offers the clinical advantage of a single integrated risk marker, simplifying risk stratification in primary care settings.
The subgroup analyses presented in this study should be interpreted as exploratory. The loss of statistical significance in certain strata (e.g. normal BMI or specific age groups) likely reflects reduced statistical power due to smaller sample sizes rather than a definitive absence of biological association. As no significant interactions were observed, these stratified findings can be primarily used to demonstrate the consistency of the main results rather than to identify distinct high-risk phenotypes.
This analysis has several limitations and areas for further refinement. First, constrained by the cross-sectional design, the association between TyGFI and sarcopenia requires validation in prospective studies. Our approach aligns with contemporary protocols advocating for machine learning–enhanced detection of frailty-related conditions to modernize risk stratification in aging populations. 36 Second, the outcome definition relied solely on appendicular lean mass adjusted for BMI according to FNIH criteria, without incorporating muscle strength (e.g. grip strength) or physical performance measures. Consequently, the model predicts a “low muscle mass phenotype,” a morphological precursor, rather than clinically confirmed sarcopenia. Although low muscle mass is a strong independent predictor of adverse outcomes, future studies should integrate functional metrics to fully validate the model for clinical sarcopenia diagnosis. Nonetheless, this study is strengthened by its pioneering introduction of TyGFI as a composite indicator for sarcopenia risk assessment. By integrating traditional regression models with multiple machine learning algorithms, it systematically validated TyGFI’s predictive value independent of conventional factors, providing robust evidence for the application of multidimensional metabolic-frailty indicators in early sarcopenia identification. Future research should assess TyGFI’s predictive utility in large-scale prospective cohorts, explore underlying mechanisms using multi-omics technologies, and advance its clinical application for personalized prevention and treatment strategies in sarcopenia.
Conclusion
Based on a nationally representative sample, this study demonstrates an independent, dose–response association between the TyGFI and sarcopenia. Machine learning analyses further identified TyGFI as a key predictor, highlighting the utility of this composite metric, which integrates metabolic dysfunction and multisystem frailty, for sarcopenia risk assessment. Future prospective studies are warranted to validate its predictive performance, elucidate the underlying biological mechanisms, and explore its integration into clinical screening tools for early identification and intervention in high-risk populations.
Supplemental Material
sj-pdf-1-imr-10.1177_03000605261417083 - Supplemental material for Development and validation of a machine learning-based sarcopenia prediction model using the triglyceride glucose–frailty index
Supplemental material, sj-pdf-1-imr-10.1177_03000605261417083 for Development and validation of a machine learning-based sarcopenia prediction model using the triglyceride glucose–frailty index by Wang Xiang, Houcheng Zhu, Xiandong Liu and Qingsong Wu in Journal of International Medical Research
Supplemental Material
sj-pdf-2-imr-10.1177_03000605261417083 - Supplemental material for Development and validation of a machine learning-based sarcopenia prediction model using the triglyceride glucose–frailty index
Supplemental material, sj-pdf-2-imr-10.1177_03000605261417083 for Development and validation of a machine learning-based sarcopenia prediction model using the triglyceride glucose–frailty index by Wang Xiang, Houcheng Zhu, Xiandong Liu and Qingsong Wu in Journal of International Medical Research
Supplemental Material
sj-pdf-3-imr-10.1177_03000605261417083 - Supplemental material for Development and validation of a machine learning-based sarcopenia prediction model using the triglyceride glucose–frailty index
Supplemental material, sj-pdf-3-imr-10.1177_03000605261417083 for Development and validation of a machine learning-based sarcopenia prediction model using the triglyceride glucose–frailty index by Wang Xiang, Houcheng Zhu, Xiandong Liu and Qingsong Wu in Journal of International Medical Research
Supplemental Material
sj-pdf-4-imr-10.1177_03000605261417083 - Supplemental material for Development and validation of a machine learning-based sarcopenia prediction model using the triglyceride glucose–frailty index
Supplemental material, sj-pdf-4-imr-10.1177_03000605261417083 for Development and validation of a machine learning-based sarcopenia prediction model using the triglyceride glucose–frailty index by Wang Xiang, Houcheng Zhu, Xiandong Liu and Qingsong Wu in Journal of International Medical Research
Supplemental Material
sj-pdf-5-imr-10.1177_03000605261417083 - Supplemental material for Development and validation of a machine learning-based sarcopenia prediction model using the triglyceride glucose–frailty index
Supplemental material, sj-pdf-5-imr-10.1177_03000605261417083 for Development and validation of a machine learning-based sarcopenia prediction model using the triglyceride glucose–frailty index by Wang Xiang, Houcheng Zhu, Xiandong Liu and Qingsong Wu in Journal of International Medical Research
Footnotes
Acknowledgments
Not applicable.
Author contributions
Conceptualization and study design: WX, XL, and QW. Data curation and formal analysis: WX. Writing–original draft: WX. Writing–review and editing: WX, XL, and QW. Visualization (figure preparation): HZ and WX. All authors reviewed the manuscript, provided critical feedback, and approved the final version.
AI tools
The authors confirm that no AI tools were used at any stage of this study.
Data availability statement
Declaration of conflicting interests
The authors declare that they have no competing interests.
Funding
This work was supported by the Project of Sichuan Provincial Administration of TCM (grant numbers 2024MS539, 2024MS540).
Supplemental material
Supplemental material for this article is available online.
References
Supplementary Material
Please find the following supplemental material available below.
For Open Access articles published under a Creative Commons License, all supplemental material carries the same license as the article it is associated with.
For non-Open Access articles published, all supplemental material carries a non-exclusive license, and permission requests for re-use of supplemental material or any part of supplemental material shall be sent directly to the copyright owner as specified in the copyright notice associated with the article.