
Abstract
Objective
Patients with diabetes are 3–5 times higher at risk for cardiovascular diseases and myocardial infarction (MI). There is a need to find miRNAs and other target genes to reduce mortality rates. The current study aims to find potential miRNAs and target genes among MI patients, MI patients with pre-diabetes (metformin non-users), and MI patients with diabetes (metformin users).
Method
The candidate miRNAs were identified by microarray profiling, and their differential expression was evaluated through real-time polymerase chain reaction (RT-PCR) in control and patient groups. The potential targets for miR-1 and miR-133a were retrieved from the TargetScan, miRWalk, and miRDB databases. The sensitivity and specificity of miRNAs were assessed using receiver operating characteristic (ROC) curve analyses.
Results
Microarray profiling identified 16 miRNAs with significantly altered expression in all MI patient groups compared with healthy controls. According to this data, two miR-1 and miR-133a (with a high ratio) were selected for further verification. All patient groups exhibited a significant increase in the expression levels of miR-1 and miR-133a. Also, miR-1 and miR-133a levels were lower in metformin-user patients than in non-user patients (p < 0.05). Moreover, interleukins, growth factors, and other related genes were identified as potential targets for miR-1 and miR-133a. The ROC area under the curve (AUC) was 0.973 (95% CI: 0.718–0.884) for circulating miR-1, and 0.969 (95% CI: 0.723–0.876) for miR-133a in patients with diabetes (p < 0.001).
Conclusion
Prediction of miRNA profiles and network of target genes are valuable in the early diagnosis of MI in individuals without and with diabetes. Metformin treatment is associated with lower expression of MI-related miRNAs, suggesting a potential mechanism for cardiac protection by this agent.
Introduction
Diabetes is considered a silent, life-threatening and progressive disease due to its pleiotropy and complexity. 1 It is an epidemic disease resulting from genetic, epigenetic and environmental factors. Patients with diabetes are 3–5 times higher at risk for cardiovascular diseases, myocardial infarction (MI), significant occlusion of arteries and vascular death. 2 Diabetes is a major cause of disability and death in patients. The increasing number of affected individuals, obesity, lifestyle and aging in different human populations are expected to exacerbate diabetes. 3 An unhealthy diet, gender, reduced physical activity and alcohol use can increase the risk of diabetes development and cardiovascular complications. Some patients have no information about their disease. 4 Patients with hyperglycemia and uncontrolled blood glucose are at greater risk of developing nephropathy, cardiopathy, retinopathy, neuropathy, severe infectious diseases and delay in wound healing. 2 Inflammatory factors, circulating cytokines, arterial rigidity, small size vascular diameter and plaque formation have been indicated as pathological factors for cardiovascular diseases in patients with diabetes. Hyperglycemia could negatively affect the cardiac muscle, arteries, and endothelial cells, resulting from molecular and cellular changes influenced by hemodynamic load or cardiac activity and physiology.3,5,6
A proper approach for decreasing hyperglycemia is using metformin to modulate insulin signaling pathways.7,8 Metformin has cardiovascular protective effects on cholesterol, triglyceride, and blood flow for patients with diabetes. 9 Growing evidence reports that metformin is pivotal in inhibiting cancer cell growth, migration, and cardiovascular disease through microRNAs (miRNAs/miRs), small molecules and target genes. Several factors, such as gender, genetic polymorphisms, insufficient doses of some drugs and gene interactions, may contribute to variations in metformin response in different individuals. 10
Some reports have proven that the concentrations of circulating miRNAs and their messenger RNA (mRNA) targets are involved in numerous metabolic disorders, insulin resistance (IR) in cells, and insufficient insulin production in β-cell. 3 Altered levels of circulating miRNAs in blood and serum have been linked to various pathophysiological conditions. Moreover, the concentrations of circulating miRNAs and mRNAs in patients are different from those in healthy individuals. 11 MiRNAs, as informative markers, are valuable/available in predicting and monitoring diseases. 12 It is necessary to validate effective biomarkers to assess their utility in clinics and disease monitoring according to specific unique profiles for each person.
The current study aimed to integrate the potential miRNAs and target genes in cardiovascular disease using bioinformatics and clinical approaches. Overlapping candidate target genes were obtained from databases. The expression levels of some miRNAs, such as miR-1 and miR-133a, are more likely different between MI patients with diabetes and without diabetes. Thus, these results can be associated with getting new insights into metformin’s protective and therapeutic effects on the cardiovascular system and other organs.
Materials and methods
Subject group characteristics
In this study, peripheral blood samples were obtained to analyze miRNAs in patients who had cardiac symptoms, dyspnea, angina chest pain, epigastric, neck/jaw or arm pain, positive heart markers, increased levels of troponin I, creatinine kinase (CK), and ST elevation on electrocardiogram (ECG) results within 1–10 h of symptom onset. All patients were admitted to the cardiovascular hospital, diagnosed by the cardiologist according to the American College of Cardiology guidelines for the first time and underwent primary angioplasty.
Patients with a previous history of cancer, liver/renal failure, cardiomyopathy, congenital heart disease, stroke, familial hypercholesterolemia, Parkinson’s disease, dementia, type1 diabetes, other glucose-lowering drugs consumption and bleeding disorders were excluded from the study.
Some patients use metformin to treat hyperglycemia. We considered these individuals as patients with diabetes. They had taken metformin for less than 2 years. Fifty control blood samples were collected from healthy individuals without a history of diabetes and cardiovascular diseases during the same time. Healthy individuals and patients declared their agreement to enter the study by signing a consent form to the principles of the 1975 Declaration of Helsinki.
Blood sample collection and measurement of the biochemical parameters
The routine clinical assessment, including ECG, physical examination, chest radiography, history, and blood pressure, was conducted on every individual upon admission. Peripheral blood samples (3-4 mL) from healthy individuals and patients were obtained into two separate tubes. The sera were separated by centrifugation at 4000 rpm for 10 min and then stored at 4°C. The sera of samples were subjected to the measurement of common biochemistry tests, such as Creatinine, CTnI, CK-MB, cholesterol, triglyceride, glucose of blood and other standard laboratory tests using commercial kits (Pars Azmoon, Tehran, Iran, and Delta Darman Part, Tehran, Iran) and autoanalyzer medical system (BT 3500, Italy) according to manufacturer’s instructions. The normal reference ranges (up/low) were included according to standard medical tests.
MiRNA isolation and preparation
Small (less than 200 nucleotides) and large (more than 200 nucleotides) RNAs were quickly extracted from 300 to 500 µl of whole blood using the Hybrid-RTM miRNA Kit (Geneall, Korea, Catalog No.: 325-150) according to the manufacturer’s instructions. Geneall provided the separation of small and large RNAs in the aqueous phase by two different types of columns W and B. The concentration and purity were determined using a NanoDrop-2000 spectrophotometer at 280/260 nm wavelengths (Thermo Fisher Scientific, USA). Isolated miRNAs (60 ng) were transcribed to complementary DNA (cDNA) using the Universal cDNA Synthesis Exiqon Kit (miRCURY LNATM Universal RT microRNA, Vedbaek, Denmark) according to the manufacturer’s instructions. These reactions contained 5 ng/μl of total template, 1 μl of reverse transcriptase enzyme mix, 2 μl of buffer (reaction buffer 5X), 0.5 μl of RNA exogenous control (synthetic spick control) and RNase-free water for 10 μl final volume. These reverse transcription reactions were incubated at 42°C–60 min, 95°C–5 min, immediately cooled to 4°C and then cDNAs were stored in aliquot tubes at −20°C.
MiRNAs microarray profiling
After miRNA isolation, three samples of each patient group (n = 3) and healthy controls (n = 3) were utilized for microarray profiling detection.
All individuals were matched for sex, age, weight, symptoms, blood pressure, metformin dose and duration. Overnight hybridization on a chip and preparation of fragments complementary to the target miRNAs were detected using the miRCURY array labeling kit (Exiqon, Denmark), which contains 2000 hsa-miRNAs, according to the manufacturer’s protocol. All images were analyzed using GenePix Pro software (Molecular Devices, USA).
Bioinformatics prediction
Recent bioinformatics have predicted the role of miRNAs in disease. The main target genes of miR-1 and miR-133a were screened and selected through the mirWalk (https://mirWalk.umm.uni-heidelberg.de/), miRDB (https://mirdb.org) and TargetScan7.2 (https://www.targetscan.org) based on the high target score.
Validation of quantitative miR-1 and miR-133a expression by real-time PCR (RT-PCR)
Quantitative amplifications were performed using the ExiLENT SYBR® Green master mix kit (Exiqon, Denmark) in the ABI thermal cycler (Applied Biosystems, USA). The Real-Time PCR conditions included: 5 min at 95°C, 10 s at 95°C and 20 s at 60°C for 40 cycles, and a final extension at 72°C for 5 min for calculating the cycle threshold (CT). The sequence for miR-1 was amplified using primer: 5′-UGGAAUGUAAAGAAGUAUGUAU-3′, miR-133a: 5′-UUUGGUCCCCUUCAACCAGCUG-3′. Negative controls (no template) and melting curves were considered in each run. The mean CT was calculated in triplicate for each sample (10 μl volume) with the RNAU6 (U6) (5′-CUCGCUUCGGCAGCACA-3′) and synthetic miR-423-5p (5′-UGAGGGGCAGAGAGCGAGACUUU-3′) used to normalize the data. The real-time PCR reaction contained 4 μl of cDNA template, 1 μl of the primers and 5 μl PCR master mix (SYBR Green and buffer) in 10 μl total volume. The selection of the internal control gene was based on Exiqon recommendations and literature data. Exiqon has recommended several genes to normalize the data. MiRNA-423-5p and RNAU6 were described as stable and highly expressed in samples over the entire actual microRNA expression analysis. Delta CT (ΔCT) was determined as CT experimental miRNA–CT internal control gene. Data CT and delta delta CT (ΔΔCT) were calculated as the mean with the standard deviation (SD). The fold changes of selected miR-1 and miR-133a were presented based on the 2–ΔΔCT assay.
Statistical methods
Data analyses were evaluated through Microsoft Excel version 2013 (Microsoft Corp., USA), SPSS software version 16 (SPSS, Inc., Chicago, IL, USA), and XLSTAT Version 2016.02.28451 (Addinsoft, Paris, France). All obtained data were reported as the mean ± standard deviation (SD) for continuous variables of three experiments, categorical variables were expressed as numbers and percentages N (%) and comparisons between groups were calculated with one-way ANOVA. Two-sided p-values less than p < 0.05 were determined statistically significant. All miRNA expression levels were calculated as the fold changes compared with the healthy control. The receiver operating characteristic curve (ROC) analysis indicated a 95% confidence interval (CI) for both miRNAs.
Results
Clinical results of the individuals
Participant blood samples were taken from a total of 150 patients admitted to the hospital who had the manifestation of clinical symptoms and 50 healthy individuals in this study. Healthy controls were adjusted to the patients in terms of gender and age. Clinical information was adjusted for differences in patient characteristics such as chest pain symptoms, age, history of diabetes, gender, dyspnea, metformin use duration and doses.
According to these criteria, the admitted patients were segregated into three groups; group MIND patients with MI (n = 50, FBS <110 mg/dl), group MIPreD; MI individuals with prediabetes who were not taking metformin (n = 50, FBS 110–126 mg/dl) and group MID; MI individuals with diabetes who were taking metformin (n = 50, FBS >126 mg/dl). Also, the FBS (Fasting blood sugar) results of group MIPreD were in the normal reference range and they didn’t use metformin or other glucose-lowering drugs. Therefore, physicians have prescribed their physical activity and diet patterns to avoid hyperglycemia.
Of the 150 patients, 80 were males and 70 were females and the median age was 57 years, ranging from 37 to 65 years. Of the 50 healthy controls, 27 were males and 23 were females and the median age was 57 years, ranging from 38 to 65 years. The healthy controls were older than 38 years with no clinical evidence of any type of diabetes, metformin use, congenital heart disease, cardiovascular disease, cancer, malignancy, immune deficiency and infectious diseases.
The mean age of healthy controls, group MIND, group MIPreD and group MID were 56.09 ± 7.62, 58.76 ± 8.65, 58. 45 ± 9.32 and 56.32 ± 7.21 years, respectively. The mean age of all individuals was 57.90 ± 8.2 years and the number of male patients with MI was more than that of female patients.
General laboratory tests of quantitative and qualitative variables of recruited individuals.

Laboratory data detected as the mean with the count (%) and standard deviation (SD). Smoking habit (cigarette and hookah); CTnI: cardiac troponin I; CK-MB: creatinine kinase-MB; FBS: fasting blood sugar; LDL: low-density lipoprotein; HDL: high-density lipoprotein.
Microarray profiling of miRNAs expression
Microarray analysis of miRNAs expression in all patient groups compared with controls. These miRNAs were common in all patient groups in this study.


The Venn diagram displayed, Volcano plot and a Heatmap of differentially expressed miRNAs in studied groups. A Venn diagram of differentially expressed miRNAs in studied groups displayed 16 miRNAs are seen in all groups. A Volcano plot and Heatmap showed up/down regulation of miRNAs in myocardial infarction. The expression levels of the differentially expressed miRNAs showed by different colors.
Gene target prediction
The common predicted targets for hsa-miR-1 and hsa-miR-133a. Target genes are selected based on the high target score in this study.

Expression of miR-1 and miR-133a in the studied individuals
Real-time PCR of two miRNAs was performed to validate the results of microarray, which contains a high ratio and is included in TargetScan7.2 and miRDB results. The other miRNAs were considered for further evaluation in the next studies. The fold change levels of two miR-1 and miR-133a were determined for enrolled individuals. Statistical analyses illustrated up-regulation of miR-1 and miR-133a in all patient groups compared to healthy group.
The expression of miR-1 increased 55.71-fold in group I, 54.19 in group MIPreD, and 40.78-fold in group MID patients, compared with healthy group (p < 0.05). The CT levels of miR-1 were measured in all groups (mean CT = 35.45 ± 2.68, 29.65 ± 4.78, 29.69 ± 3.56 and 30.11 ± 2.65 in healthy control, group MIND, group MIPreD and group MID respectively, p < 0.05). Also, real-time PCR data showed that group MID (patients with diabetes) exhibited different miR-1 levels than group MIND and group MIPreD patients.
The miR-133a increased 64.44-fold in group I, 63.11-fold in group MIPreD, and 52.71-fold in group MID, compared with healthy group (p < 0.01). The mean CT levels of miR-133a were determined in all groups (mean CT = 34.34 ± 3.51, 28.33 ± 4.38, 28.36 ± 3.85 and 28.62 ± 2.45 in healthy control, group MID, group MIPreD and group MIND respectively, p < 0.05). Group MID showed significant down regulation of miR-133a compared with group MIND and group MIPreD (p < 0.05) (Figure 2). Validation of selected miR-1 and miR-133a by real-time PCR in healthy (n = 50) and patient groups (MIND, MIPreD, MID) (each group n = 50). The level of miR-1 and miR-133a expression were significantly up-regulated in all patient groups compared with healthy group. Group MID had significantly lower levels of the miR-1 and miR-133a expression than group MIND and group MIPreD (P < 0.05).
The value of miR-1 and miR-133a in the studied individuals: ROC analysis
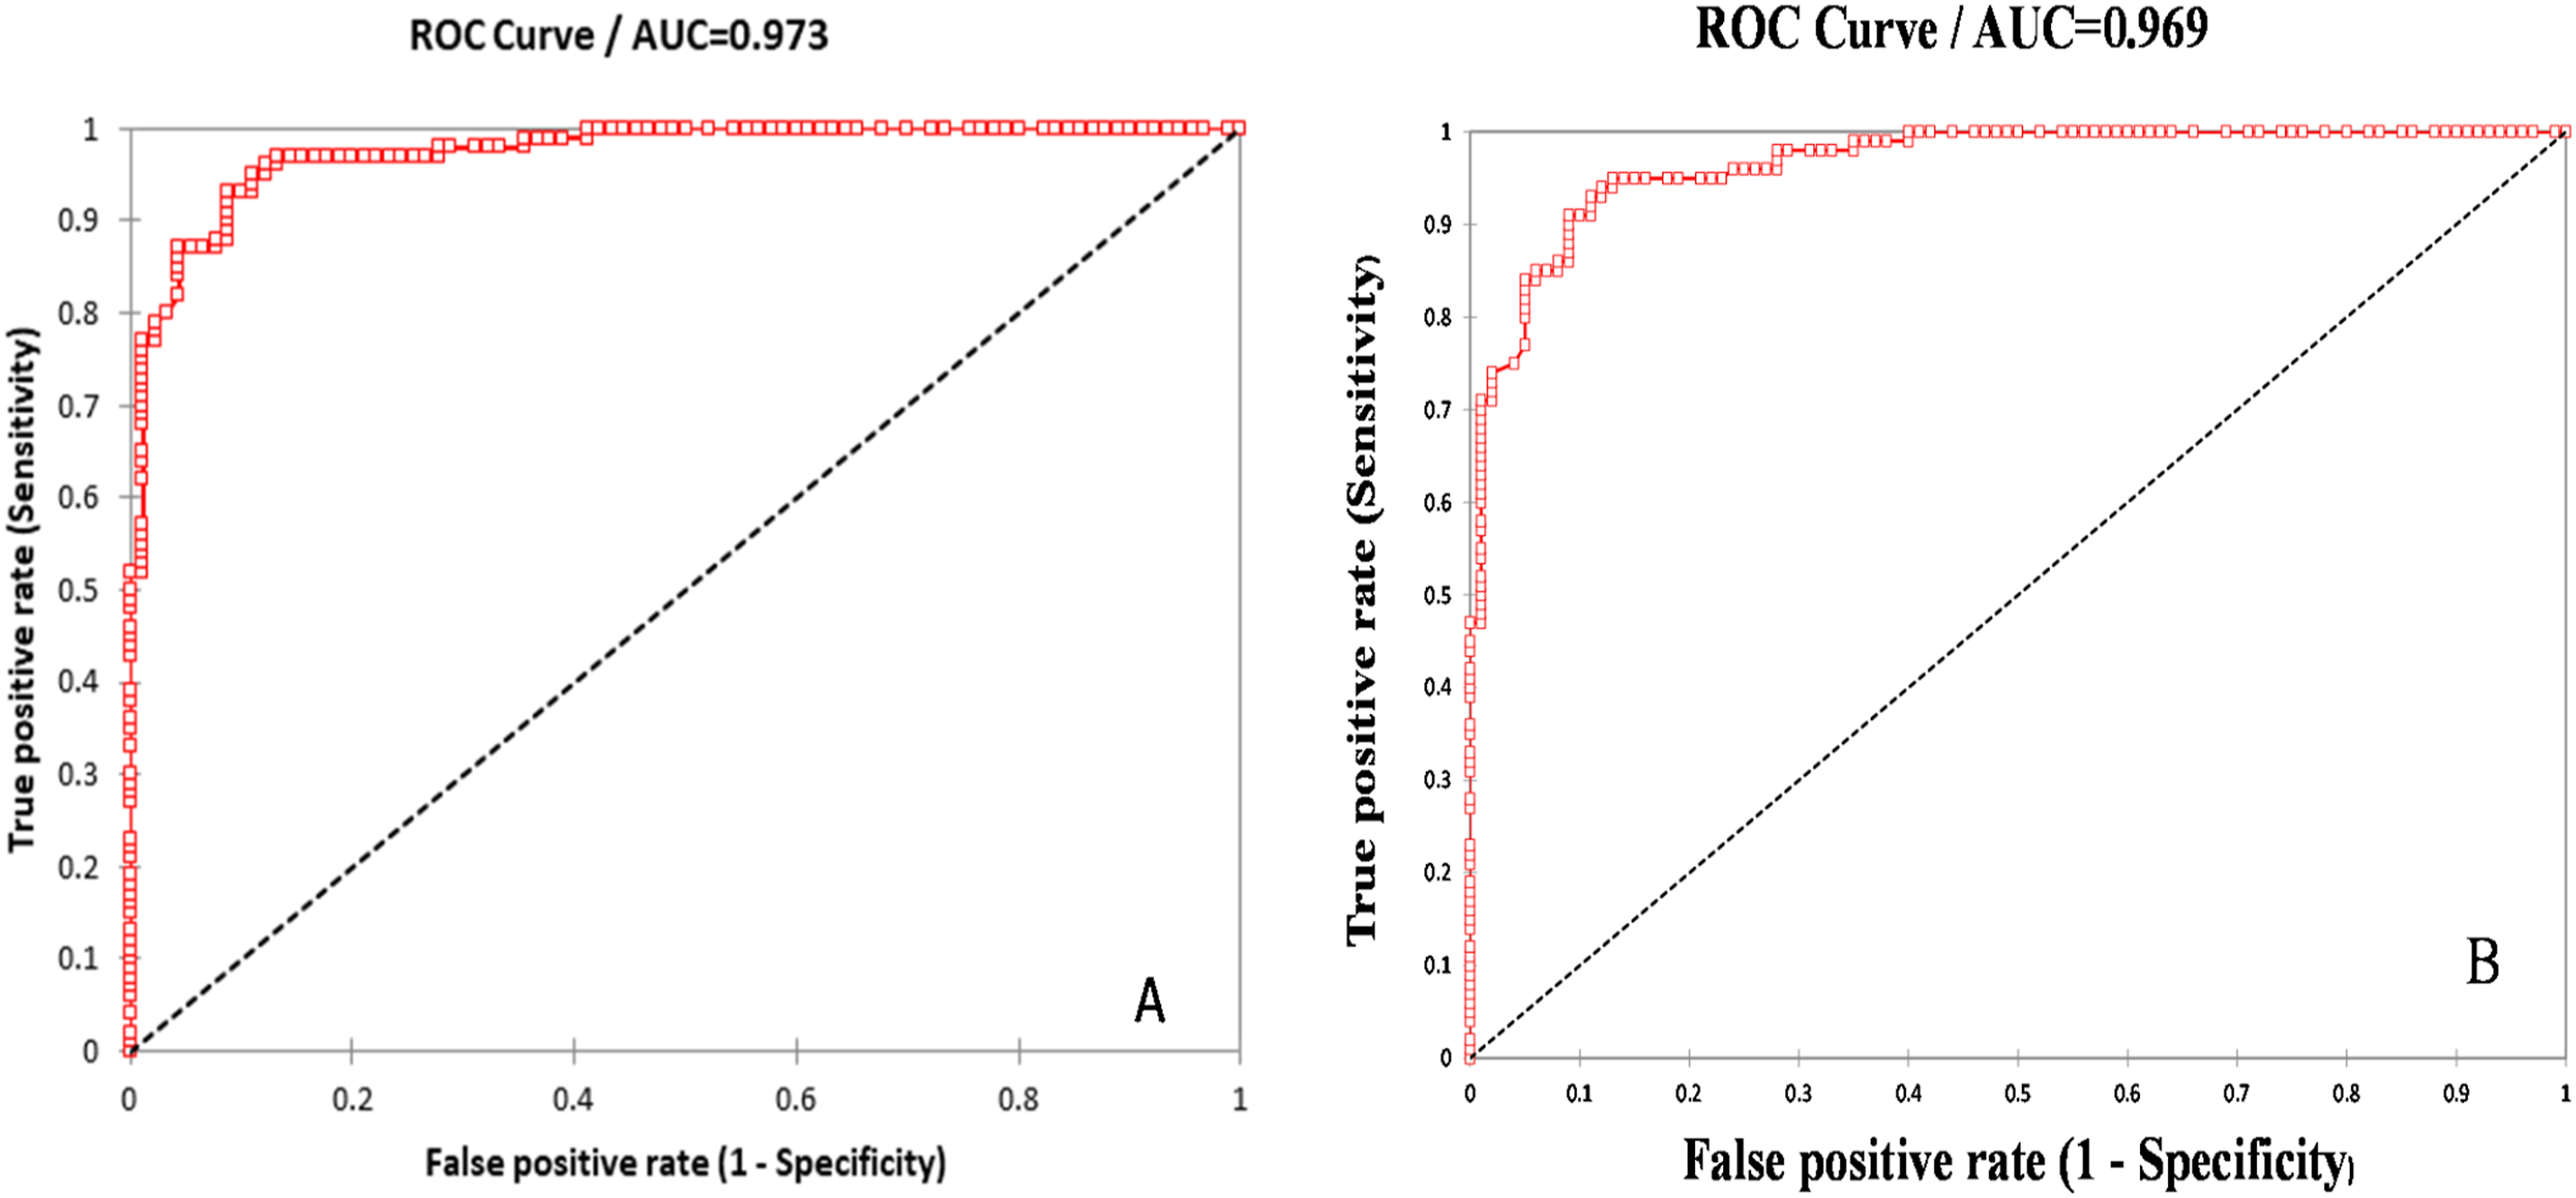
The area under curve (AUC) was 0.991 (95% CI: 0.622–0.788) for miR-1 and was 0.987 (95% CI: 0.641–0.792) for miR-133a (p < 0.001) in all patient groups (Figure 3). Moreover, group MID showed that AUC for circulating miR-1 was 0.973 (95% CI = 0.718–0.884, p < 0.001) and AUC for circulating miR-133a was 0.969 (95% CI = 0.723–0.876, p < 0.001) with high sensitivity (0.96), specificity (0.897) and accuracy (0.953) (Figure 4). ROC curve analysis of myocardial infarction biomarkers miR-1 and miR-133a to differentiate between all patient groups & healthy subjects. The receiver operating characteristic curve (ROC) demonstrated the performance of the miR-1 and miR-133a expression levels with the area under curve (AUC) (0.991) and (0.987) respectively. The ROC curve (AUC) for circulating miRNAs to differentiate between patients with diabetes & healthy subjects. The ROC analysis showed the performance of miR-1 (A) and miR-133a (B) expression levels with the AUC (0.973) and (0.969) respectively in MI patients with diabetes (group MID). These markers showed good prediction performance (AUC = 0.973 and 0.969) with high sensitivity and specificity respectively.
Discussion
Diabetes is associated with physiological changes in several organs and cardiovascular systems, characterized by narrowing, occlusion and vascular death. 13 Females with diabetes have a greater risk of developing heart disease and cardiovascular problems than males with diabetes and it is challenging to take valid biopsies of heart and pancreas tissue to assess individual health status.2,14 Several vascular changes and tissue ischemia can increase the risk of MI, particularly in patients with diabetes. Early and effective diagnosis of MI remains the biggest challenge for clinicians. After heart injury and MI, miRNAs are rapidly released in urine, blood circulation and saliva. The levels of miRNAs from the damaged cardiac cells are raised much faster than the troponins and other cardiac markers, whereas troponins are bound to myofibrils. 15 Evidence reveals that noninvasive small molecules and miRNAs induce mesoderm formation and their alterations or dysfunctions cause heart defects, the development and progression of cardiovascular diseases, abnormal insulin secretion and diabetes. 14 Also, vessels plaque formation can release miRNA from platelet, red and white blood cells. Some drugs and genetic polymorphisms can influence miRNAs. Metformin, the most glucose-lowering drug, can decrease MI risk, atherosclerosis and cardiovascular disease through miRNAs and target mRNAs.16,17
In particular, heart biomarkers can make better discriminative capacity when differentiating the leading causes of infarction. 18 Previous studies revealed that diabetes and MI were associated with the altered expression of miRNAs. These changes in miRNAs can be perceived in biofluids, making them informative and valuable biomarkers in every stage of diseases. This association helps predict cardiovascular diseases in at-risk patients.12,19–21
In the present study, we assumed that the up-regulation /down-regulation of miRNAs might vary between metformin users and non-users with cardiovascular disease risk. Compared with the control group, 16 miRNAs were detected in all patient groups, including 10 up-regulated and 6 down-regulated miRNAs. After adjusting for clinical factors, the fold changes of miR-1 and miR-133a were evaluated using real-time polymerase chain reaction (RT-PCR) in enrolled individuals. The RT-PCR data analysis revealed significant differences in fold changes in MI patients compared to healthy individuals. Also, the relative expression validated decreased miR-1 and miR-133a in patients with diabetes compared to pre-diabetes patients. MiRNAs, as small markers, can potentially predict coronary artery stenosis, MI risk, and insulin secretion regulation. Therefore, vital markers must be used to evaluate and identify patients with diabetes at risk of MI. Previous studies have shown that miRNA-133a-3p levels are significantly linked to microvascular obstruction, infarction size and salvage.22,23 Cardiac hypertrophy and cardiomyopathy are the most common features in patients with diabetes. Moreover, over-expression of miR-133a, miR-1, and miR-21 has been reported in cardiac infarction and cardiomyopathy, which is consistent with this research. 24 The dysregulated miR-1 and miR-133a are closely related to the negative regulation of mRNA targets, including Iroquois homeobox 5 (Irx5), twinfilin-1, transgelin-2, and exportin 6 (XPO6).23,25 Cheng et al. observed up-regulation of miR-1 and a positive correlation with infarct size in rat models with acute MI (AMI).25–27 Up-regulation of miR-1 in ST-elevation myocardial infarction (STEMI) patients has been indicated in previous studies.18,28 MiR-1 enhances arrhythmia by suppressing the protein phosphatase 2A (PP2A) regulatory subunit B56α, which is involved in the activity of RyR2 channels, cardiac excitation-contraction, sarcoplasmic reticulum Ca2+ content and Ca2+ cycling in myocytes. Also, phosphorylated protein kinase B (p-AKT), cyclin-dependent kinase inhibitor (p27kip), caspase-3, phosphatase and superoxide production have been revealed as the target genes of miR-1 in previous research.25,29
Irx5, a transcription factor in cardiac cells, has been identified as a primary target gene for miR-1 because the dysregulation of miR-1 through up-regulation of Irx5 can regulate cardiac repolarization by repressing the potassium voltage-gated channel subfamily D member 2 (Kcnd2) potassium channel. 30
The current study demonstrated that the expression levels of miRNAs decreased in diabetes metformin users as compared to non-users. In addition, the present research revealed the real benefits of metformin in metformin users compared to individuals with pre-diabetes and non-diabetes. The benefits revealed in the metformin medication group can be attributed to decreased heart infarction. It is worth mentioning that metformin can reduce myocardial infarct size by impacting pro-inflammatory cytokines of tumor necrosis factor-alpha (TNF-α), interleukin-6 (IL-6), and interleukin-1 beta (IL-1β). Moreover, the anti-inflammatory properties of metformin have been identified in the kidneys, heart and brain. Due to long-term safety, effectiveness, and substantial cost advantage, metformin is the most commonly prescribed drug for lowering glucose levels, alone or in combination with other antihyperglycemic drugs for most patients with diabetes. 13 These properties of metformin can be used to decrease MI risk and sudden death. Metformin can decrease MI risk, atherosclerosis and cardiovascular disease through miRNAs and target mRNAs. 31 Recently, it has been found that metformin can also be used as fundamental/initial therapy in individuals to reduce inflammatory responses in vessels, tissue inflammation, accumulation of lymphocytes, proliferation of vascular smooth muscle cells and atrial stenosis progression.32–34 Zhang et al. showed that metformin could reduce cardiomyocyte injury induced by H2O2 by inhibiting the expression of the miR-1a-3p/GRP94 pathway. 35 Also, metformin has a cardioprotective effect by down-regulating miR-221, miR-19a, and miR-21a. 16 These results indicate that metformin has a protective role in cardiovascular function by up-regulating/down-regulating miRNAs and target genes. 34 Various miRNAs are carried by transporter molecules, such as high-density lipoprotein (HDL-miRNA), Argonaute2 (Ago2-miRNA) and exosome/microvesicles to prevent their degradation in biofluids.21,36,37 Previous studies have revealed that metformin exerts cardioprotective effects by increasing cellular viability, decreasing LDH activity, inhibiting cellular apoptosis and inflammation.13,38 Metformin can inhibit cardiac injury by inhibiting pyroptosis through multiple signaling pathways such as an adenosine monophosphate-activated protein kinase (AMPK) and decreasing pro-inflammatory cytokines. These results can be associated with decreased MI and mortality rates.31,38
Generally, the measurement of miRNAs and other small RNAs may provide a new strategy in medical treatments for patients monitoring and follow-up.12,39 MiRNAs can facilitate pre-inflammation and proliferation niche formation by mediating communication between cells, microenvironment and extracellular matrix, or by transferring into other cells.18,28,40 Therefore, exploration of miRNAs and noninvasive biomarkers can help find the effects of metformin on the pathogenesis and development of vessel stenosis, tissue injury of cardiovascular and complications.
Conclusions
It is necessary to find effective drugs and predictive biomarkers due to increasing diabetes and its complications worldwide. These results are clinically valuable. In this regard, some miRNAs are appropriate and critical candidates for the predicted susceptibility to vessel stenosis and therapeutic targets for patients. Metformin has many advantages and positive effects in patients with diabetes, such as reducing the incidence of MI risk, atherosclerosis, and cardiovascular disease through miRNAs and target mRNAs. Therefore, reducing specific cardiac miRNAs in response to metformin can be considered a cardioprotective approach.
Footnotes
Ethical approval
This study was performed by the WMA Declaration of Helsinki–Ethical Principles for Medical and approved by the Committee for Ethical Consent of Urmia University of Medical Sciences under the number IR.UMSU.REC.1401.283.
Informed consent
Written informed consent was obtained from all individuals.
Funding
The author(s) disclosed receipt of the following financial support for the research, authorship, and/or publication of this article: This study has been funded by Urmia University of Medical Sciences, Urmia, Iran (3102).
Declaration of conflicting interests
The author(s) declared no potential conflicts of interest with respect to the research, authorship, and/or publication of this article.