
Abstract
Objective
Impairment of pancreatic β cells is a pathophysiological feature of type 2 diabetes mellitus (T2DM). However, whether abnormally dysregulated miR-454-3p in T2DM is related to the dysfunction of pancreatic β cell remains to be further investigated.
Methods
First, T2DM patients and healthy subjects were recruited to measure miR-454-3p. Subsequently, pancreatic β cells were cultured with high glucose. The role of miR-454-3p in insulin synthesis, secretion, cell proliferation, and apoptosis were investigated by RT-qPCR, Glucose-stimulated insulin secretion determination, cell counting kit-8, and flow cytometry assays. The target mRNA of miR-454-3p was predicted using bioinformatics software. Then, the targeted binding relationships between the above two factors were verified through RNA Immunoprecipitation and Dual-Luciferase Reporter assays.
Results
The expression of miR-454-3p was increased in T2DM patients and pancreatic β cells cultured with high glucose. Moreover, miR-454-3p was positively correlated with FPG and HbA1c levels in patients. In cell experiments, miR-454-3p inhibitors significantly improved the function of pancreatic β cells, including increased insulin synthesis and secretion, and promoted proliferation. Moreover, silencing Yy1 reversed the protective effect of miR-454-3p inhibitors on pancreatic β cells.
Conclusion
miR-454-3p, which is dysregulated in T2DM, promotes the damage of pancreatic β cells by regulating Yy1, thus aggravating T2DM.
Introduction
Diabetes mellitus (DM) is a metabolic disease with hyperglycemia as its main manifestation, which is caused by insulin deficiency or resistance. 1 The incidence of DM has shown a rapid growth trend. And the number of people with DM is growing. 2 Because of this, DM is considered to be a disease type second only to cancer and cardiovascular and cerebrovascular diseases, seriously affecting the quality of human life and life safety. 3 Type 2 diabetes mellitus (T2DM) accounts for about 90% of DM. 4 It is reported that by 2045, 700 million people worldwide will be affected by T2DM. 5
Pancreatic β cell failure (decreased numbers and dysfunction) is the main cause of T2DM. 6 When tissues and organs involved in glucose metabolism become less sensitive to insulin, pancreatic β cells initially compensate by increasing insulin synthesis and secretion. However, long-term insulin resistance and inflammation can gradually cause damage and failure of pancreatic β cells. 7 Therefore, the ideal treatment strategy for T2DM is to protect and restore the function of pancreatic β cells while lowering blood glucose. As a class of non-coding RNAs with regulatory functions, miRNA has opened up new dimensions for understanding the function and development of organisms.
It has been found that during the progression of T2DM, many miRNA molecules are out of control and directly or indirectly cause or aggravate islet injury. For example, miR-299-5p is significantly down-regulated in human islets with glycolipid poisoning, and the inhibition of miR-299-5p induces severe β-cell dysfunction and apoptosis. 8 miR-184 is richly expressed in β cells and regulates compensatory insulin secretion during insulin resistance. 9 In T2DM, there are still many miRNA molecules with unknown functions that may be involved in the damage of pancreatic β cells in a high glucose environment. Here, we focused on miR-454-3p in T2DM. Several researchers have analyzed miRNA expression profiles in patients with T1DM and T2DM. miR-454-3p was abnormally elevated in DM patients. However, the specific role is unknown.10,11 In addition, it is not clear whether dysregulated miR-454-3p causes dysfunction of pancreatic β cells under high glucose conditions.
Based on the above research background, we speculate that abnormally expressed miR-454-3p aggravates the severity of T2DM. Moreover, miR-454-3p may induces and exacerbates T2DM by damaging pancreatic β cells.
Materials and methods
Participants
The study was performed in line with the principles of the Declaration of Helsinki. Approval was granted by the Ethics Committee of Cangzhou Medical College before the study began. The written informed consent has been obtained from the participants involved.
From September 2022 to November 2023, we recruited 48 T2DM patients from Cangzhou Medical College and included them in the T2DM group. Inclusion criteria: Meeting the diagnostic criteria for T2DM: having typical diabetes symptoms (polydipsia, polyuria, unexplained weight loss), fast plasma glucose (FPG) ≥ 7.0 mmol/L, glycated hemoglobin (HbA1c) ≥ 6.5%; Age ≥18; Course of T2DM ≥ 1 year; Volunteer for this study. Exclusion criteria: other types of diabetes mellitus; people with a history of mental illness and substance abuse; malignant tumor; autoimmune diseases; severe liver or kidney disease. Additionally, we recruited 48 healthy volunteers as a control group. After fasting for at least 8 h, blood samples were collected from all subjects for biochemical testing.
Cell culture
MIN6 (ATCC, USA) was cultured in DMEM medium at 37°C and 5% CO2. Cell density and growth were observed every other day. When the cell density reached 80–90%, cell passage or follow-up experiments were performed. To simulate the status of health and T2DM, MIN6 was cultured in DMEM medium containing 5.5 mM (Low-glucose) and 25 mM (High-glucose) glucose, respectively, as previously described. 12
Cell transfection
When MIN6 cells were growing logarithmically, they were removed from the cell incubator and digested with a trypsin digestion solution (Thermo Fisher Scientific, USA). Subsequently, appropriate amount of cells were inoculated into the 6-well plate. MIN6 cells were then transfected with miR-454-3p inhibitor or si-Yy1 (RIBOBIO, China) according to the instructions of Lipofectamine 2000 (Thermo Fisher Scientific, USA).
RT-qPCR
First, total RNA was extracted from serum and cells. The purity of total RNA should be detected immediately using an ultramicro spectrophotometer (HACH, USA). When A260/A280 is between 1.8 and 2.2, it indicates that the RNA can be used for follow-up experiments. Subsequently, cDNA was amplified and synthesized according to the guidance of miRcute Plus miRNA First-Strand cDNA Kit or FastKing gDNA Dispelling RT SuperMix. Finally, fluorescent dyes from miRcute Plus miRNA qPCR Kit or SuperReal PreMix Plus kit were mixed with cDNA, primers, and H2O. The above mixture was then placed on the LightCycler 480 Roche qPCR instrument (Roche Diagnostics, France) to specifically amplify the target gene. After amplification, the relative expression of the gene was calculated by the 2−ΔΔCT method. In this study, U6 and β-actin were used to normalize miRNA and mRNA, respectively. All the kits were sourced from TIANGEN BIOTECH (China).
Glucose-stimulated insulin secretion determination (GSIS)
First, the cells in each group were cultured again for 24 h. The cells were then pre-incubated with Krebs-Ringer bicarbonate HEPES (KRBH, mIbio, China) buffer for 1 h. Subsequently, the cells were incubated again for 1 h with KRBH buffers containing 3.3 mM glucose or 16.7 mM glucose. After incubation, the insulin content in the supernatant was determined by an insulin ELISA kit (Abcam, UK).
Cell viability detection
When the cell density reached 80–90%, the cells were inoculated on the 96-well plate (1 × 10⁴ cells). The inoculation volume of each well was 100 μL. When the cells were attached to the wall, they are treated with high glucose and cell transfection. After the intervention, 10 μL CCK-8 solution was added. After incubation for 2 h, the optical density of the sample at 450 nm was measured by a microplate reader (BioTek, USA).
Cell apoptosis detection
Annexin V-FITC/PI Apoptosis Kit (Elabscience, China) was used to detect the apoptosis rate of cells. First, cell transfection and high glucose treatment were performed. After 48 h, the cells were washed 1-2 times with pre-cooled PBS. Subsequently, the cells were then re-suspended with 500 μL of 1 × Annexin V Binding Buffer and added with 5 μL of Annexin V-FITC Reagent and PI Reagent. After gentle mixing, the sample was incubated at room temperature for 20 min away from light. After incubation, the sample was placed on a flow cytometer (Beckman Coulter, USA) to detect the number of apoptotic cells.
Bioinformatics analysis
On the one hand, we used three online databases, miRWalk, miRDB and ENCORI, to predict the target mRNA of miR-454-3p. On the other hand, we downloaded two GEO datasets (GSE76895 and GSE25724) from the Genomics Expression Omnibus Database and analyzed abnormally down-regulated mRNA molecules in islet tissues of T2DM patients. Using Venn diagrams, we intersected the predicted target mRNA with the anomalously expressed mRNA in the GEO datasets.
RNA immunoprecipitation (RIP)
According to the Magna RIP™ RNA-Binding Protein Immunoprecipitation Kit (Millipore, USA), RIP experiments were conducted. Briefly, the magnetic beads were incubated with anti-Ago2 antibody (Abcam, UK) or anti-IgG antibody (Abcam, UK) for 30 min. Subsequently, the cells were lysed with RIP lysis buffer to obtain cell lysate. Then, the magnetic bead-antibody complex and cell lysate were incubated at 4°C for 3 h. After incubation, the levels of related factors in complex were detected.
RNA pull-down
First, cultured MIN6 cells as described in the previous steps. When the growth of the cells was good, the cells were collected and RNA was extracted from the cells. Subsequently, magnetic beads in the RNA pull-down kit (GENE CREATE, China) were incubated with 1 × RNA binding buffer and biotin-labeled miR-454-5p at room temperature for 2 h. After incubation, the magnetic bead-probe complex was washed 3 times with Wash Buffer. Then, 300 μL 1× RNA binding buffer and 20 μg RNA were added to the magnetic bead-probe complex and incubated at 4°C overnight. Finally, the RNA in the complex was extracted and the level of Yy1 was detected.
Dual-luciferase reporter (DLR) assay
First, we commissioned GenePharma company (China) to construct a dual luciferase reporter plasmid containing wild-type Yy1 sequence (Yy1-WT) and mutant Yy1 sequence (Yy1-MUT). Subsequently, cells were co-transfected with a dual luciferase reporter plasmid and a miR-454-3p mimic according to the cell transfection procedure described above. After 48 h, luciferase activity was measured.
Statistical analysis
SPSS 23.0 was used for data statistics. In this study, data were expressed as mean ± standard deviation or number (percentage). Differences between groups were compared using student’s t-test, one-way ANOVA, or Chi-square test. The correlation between miRNA and biochemical indicators in T2DM patients was analyzed by Pearson correlation analysis. P<0.05 was considered as significant difference.
Results
Clinical characteristics of study subjects
Clinical characteristics of study subjects.
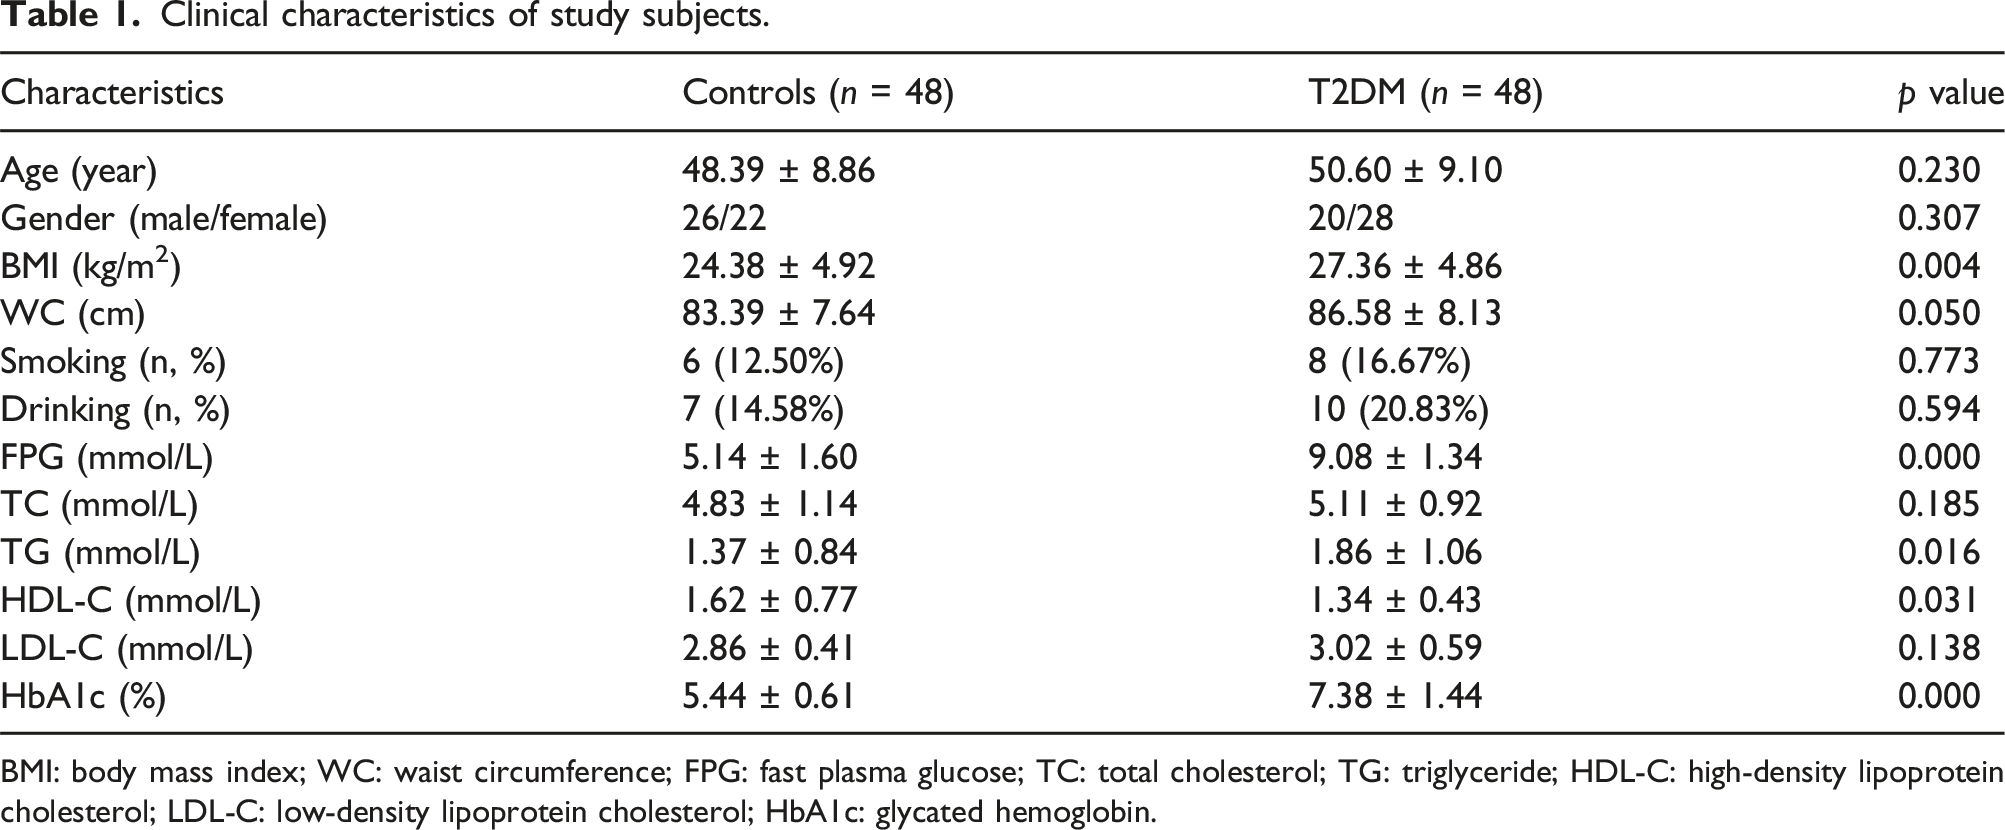
BMI: body mass index; WC: waist circumference; FPG: fast plasma glucose; TC: total cholesterol; TG: triglyceride; HDL-C: high‐density lipoprotein cholesterol; LDL-C: low‐density lipoprotein cholesterol; HbA1c: glycated hemoglobin.
Expression level of miR-454-3p in T2DM patients
The serum level of miR-454-3p in T2DM patients was significantly increased (P<0.001, Figure 1A). miR-454-3p showed excellent diagnostic performance in T2DM (Figure 1B). The AUC value of miR-454-3p in the diagnosis of T2DM was 0.859 (specificity = 85.4, sensitivity = 77.1). There is a certain relationship between miR-454-3p level and blood glucose level in T2DM patients. Specifically, miR-454-3p were significantly positively correlated with FPG (P<0.001, Figure 2A) and HbA1c (P<0.001, Figure 2B). miR-454-3p is a diagnostic marker of T2DM. (A) RT-qPCR demonstrated that miR-454-3p was up-regulated in serum of T2DM patients. (B) ROC curve demonstrated that T2DM patients and healthy subjects could be distinguished according to miR-454-3p levels. T2DM: Type 2 Diabetes Mellitus; RT-qPCR: Real-time quantitative reverse transcription PCR; ROC curve: Receiver Operating Characteristic Curve. ***P < 0.001. N = 48. The level of miR-454-3p in T2DM patients was positively correlated with FPG or HbA1c. T2DM: Type 2 Diabetes Mellitus; FPG: fast plasma glucose; HbA1c: glycosylated hemoglobin. N = 48.

Inhibition of miR-454-3p protects pancreatic β cells from high glucose damage
miR-454-3p levels were increased in pancreatic β cells cultured with high glucose compared to those cultured with low glucose (P<0.01, Figure 3A). Moreover, with the extension of induction time, the level of miR-454-3p gradually increased (P<0.001, Figure 3A). By transfecting inhibitors, we significantly inhibited the level of miR-454-3p (P<0.01, Figure 3B). Down-regulation of miR-454-3p caused a significant increase in the levels of insulin synthesis genes Ins1 and Ins2 (P<0.05, Figure 3C). Moreover, down-regulation of miR-454-3p increased insulin secretion in pancreatic β cells stimulated by glucose (P<0.001, Figure 3D). In addition, decreased levels of miR-454-3p significantly improved the level of cell proliferation (P<0.01, Figure 3E) and survival (P<0.05, Figure 3F). Down-regulation of miR-454-3p protects pancreatic β cells from high glucose damage. (A) High glucose stimulates the expression of miR-454-3p in pancreatic β cells (RT-qPCR). (B) The inhibitor significantly interfered with the expression of miR-454-3p in pancreatic β cells (RT-qPCR). (C) Down-regulation of miR-454-3p caused the increase of Ins1 and Ins2 (RT-qPCR). (D) Down-regulation of miR-454-3p stimulates insulin secretion (GSIS assay). (E and F) Inhibition of miR-454-3p increased cell viability, including increased cell proliferation rate (CCK-8 assay) and decreased cell apoptosis rate (Flow cytometry). RT-qPCR: Real-time quantitative reverse transcription PCR; GSIS assay: Glucose-stimulated insulin secretion determination assay; CCK-8 assay: Cell Counting Kit-8. *P < 0.05, **P < 0.01, ***P < 0.001. N = 5.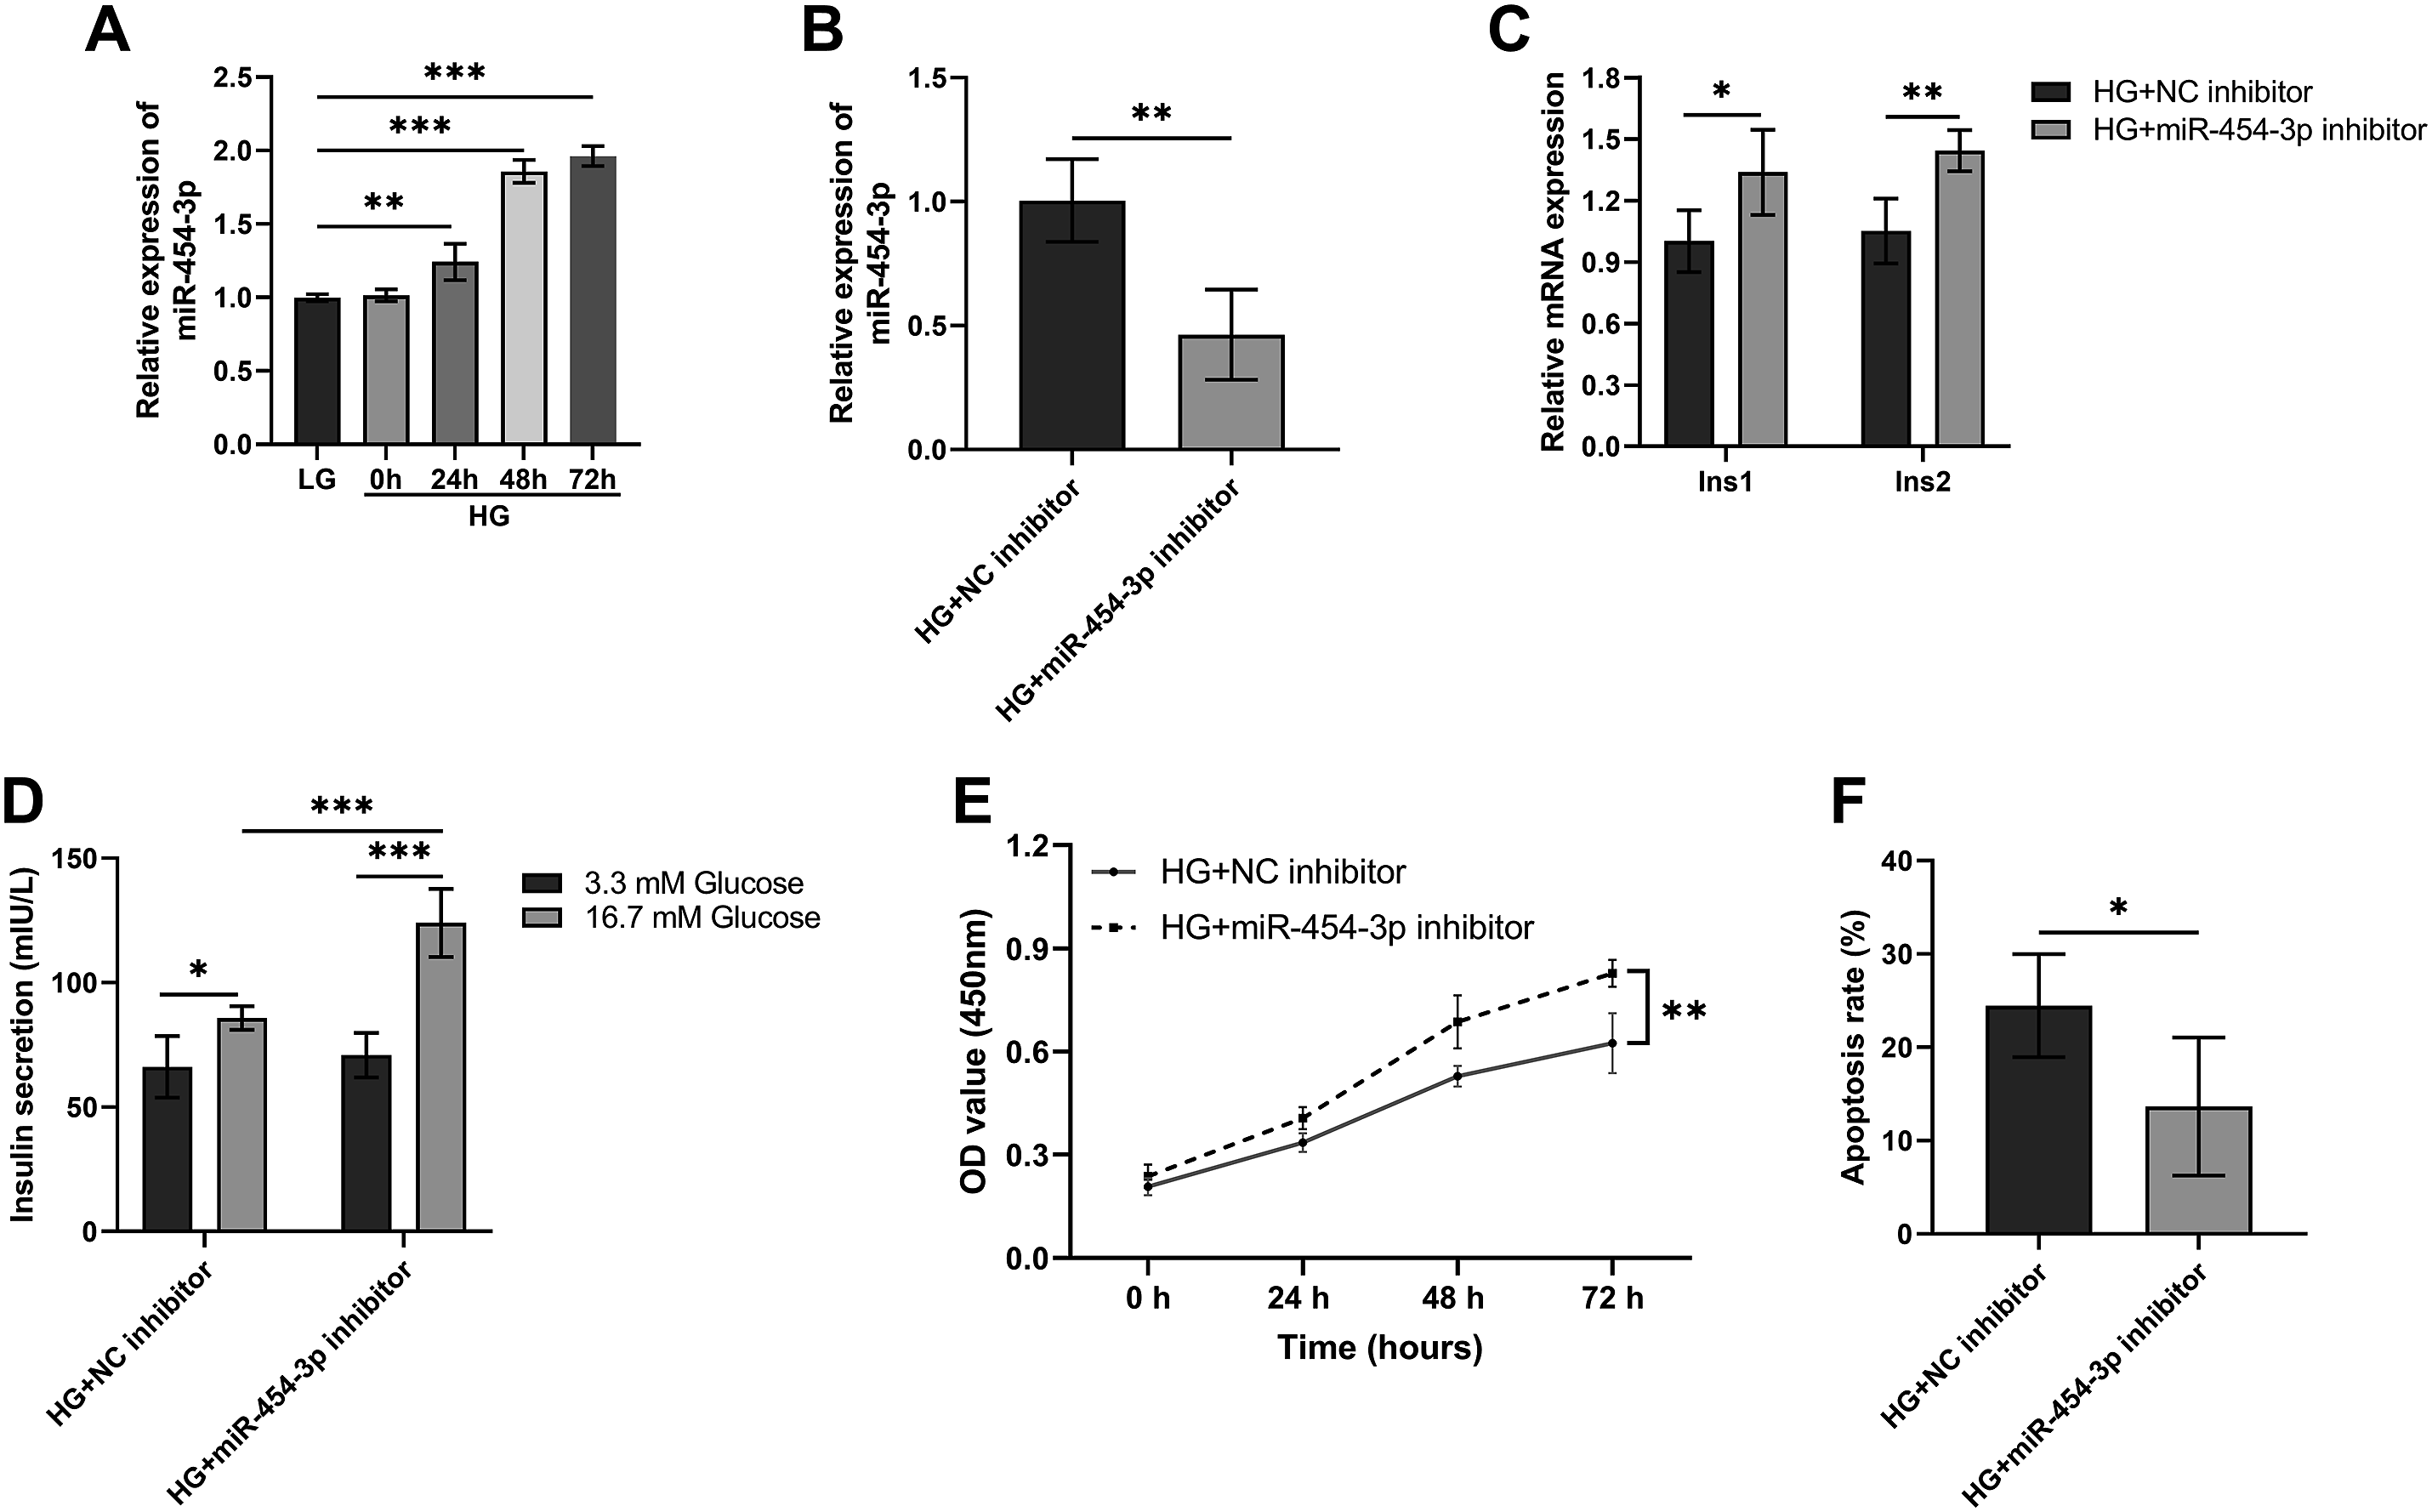
miR-454-3p targets Yy1 and inhibits it
In order to further explore the molecular mechanism of miR-454-3p involved in regulation, we preliminarily predicted the mRNA molecules that may be regulated by miR-454-3p. As shown in Figure 4A, Yy1 was not only simultaneously predicted by miRDB, miRWalk, and ENCORI to be the target molecule of miR-454-3p, but also down-regulated in the samples of T2DM patients included in the GEO dataset. RIP results showed that when Ago2 was enriched with anti-Ago2 antibody, miR-454-3p and Yy1 could be enriched simultaneously (P<0.001, Figure 4B). This suggests that miR-454-3p and Yy1 may bind to each other. The results of RNA pull-down showed that Yy1 could be enriched by biotin-labeled miR-454-3p (P<0.001, Figure 4C). Moreover, the results of DLR experiment showed that miR-454-3p mimic significantly inhibited the transcriptional activity of luciferase of Yy1-WT (P<0.01, Figure 4D and E). Yy1 is the downstream target of miR-454-3p. (A) Intersection of miR-454-3p target mRNA predicted by bioinformatics software and down-regulated mRNA in GEO dataset. (B) Both miR-454-3p and Yy1 are present in the silencing complex containing Ago2 protein (RNA Binding Protein Immunoprecipitation assay). (C) Yy1 can be enriched by biotin-labeled miR-454-3p (RNA pull-down assay). (D) Binding site of miR-454-3p to Yy1 sequence. (E) miR-454-3p mimics decreased the luciferase activity of Yy1-WT (Wild type) plasmid (Double luciferase reporting assay). *P < 0.05, **P < 0.01, ***P < 0.001. N = 5.
In the subjects we recruited, Yy1 was down-regulated in T2DM patients (P<0.01, Figure 5A). Moreover, Yy1 levels in T2DM patients were negatively correlated with miR-454-3p (P<0.001, Figure 5B). In addition, Yy1 levels in high glucose cultured pancreatic β cells were significantly lower than those in pancreatic β cells cultured with low glucose (P<0.001, Figure 5C). Yy1 is down-regulated in T2DM patients and pancreatic β cells cultured with high glucose. (A) The expression level of Yy1 in T2DM patients (N = 48). (B) Yy1 levels in T2DM patients were negatively correlated with miR-454-3p (N = 48). (C) Yy1 was decreased in pancreatic β cells cultured with high glucose (N = 5). T2DM: Type 2 Diabetes Mellitus. **P < 0.01, ***P < 0.001.
Silencing Yy1 reversed the protective effect of the miR-454-3p inhibitor on pancreatic β cells
Yy1 levels increased after transfection of pancreatic β cells with miR-454-3p inhibitors (P<0.001, Figure 6A). By co-transfecting miR-454-3p inhibitors and small interfering RNAs specifically targeting Yy1 (si-Yy1), we explored the role of miR-454-3p and Yy1 in co-regulating β cell function. Co-transfection of miR-454-3p inhibitors and si-Yy1 reversed the increase in insulin synthesis caused by down-regulation of miR-454-3p (P<0.05, Figure 6B). In addition, miR-454-3p inhibitors lead to increased insulin secretion. The silencing of Yy1 caused the insulin secretion of pancreatic β cells to decrease again under the stimulation of high glucose (P<0.01, Figure 6C). Silencing Yy1 also reversed increased proliferation (P<0.05, Figure 6D) and decreased apoptosis (P<0.05, Figure 6E) of pancreatic β cells induced by miR-454-3p inhibitors. Silencing Yy1 reversed the protective effect of miR-454-3p inhibitors on pancreatic β cells. (A) The expression level of Yy1. (B and C) Silencing Yy1 reversed the increase in insulin synthesis (reflect by Ins1 and Ins2) and secretion (reflect by insulin content in cellular supernatant) caused by the decline of miR-454-3p. (D and E) Silencing Yy1 reversed the increase in cell viability caused by down-regulation of miR-454-3p. *P < 0.05, **P < 0.01, ***P < 0.001. N = 5.
Discussion
MiRNAs are short, non-coding RNA molecules encoded by endogenous genes. 13 After more than two decades of research, miRNAs have been identified as key regulators related to normal physiology or the pathogenesis of disease (diabetes mellitus, 14 malignant tumor, 15 cardiovascular disease, 16 neurological disease, 17 etc.). More importantly, miRNAs can be stable for a long time in biological fluids such as blood. 18 Therefore, detection can be carried out in a non-invasive way. This greatly improves the convenience of testing while reducing the pain of patients. Additionally, there are different expression patterns of miRNAs in different disease stages, 19 which provides unique and accurate molecular information for evaluating disease stage, treatment effect, and patient prognosis. These important properties of miRNAs make miRNAs show great potential in the application of biomarkers.
In our study, miR-454-3p was abnormally increased in T2DM patients. Moreover, miR-454-3p had high diagnostic performance in T2DM. High levels of miR-454-3p indicate a certain risk of T2DM. Indeed, serum miR-454-3p levels in T2DM patients were positively correlated with FPG and HbA1c. This means that elevated levels of miR-454-3p may be detrimental to blood glucose control in T2DM patients.
T2DM is a common endocrine disease. The main pathological features of T2DM are β cell dysfunction and insulin resistance. 20 Studies have shown that the loss of pancreatic β cell mass becomes more severe in patients with T2DM as the course of the disease is prolonged. 21 Compared with normal islets, the mass of β cells in T2DM islets was reduced by 40% and was accompanied by a decrease in insulin levels.21,22 It is estimated that the function of pancreatic β cells in T2DM patients is reduced by 80% at the onset of T2DM.23,24 Therefore, it is of great significance to protect and restore the function of β cells and avoid the function failure of β cells. In our study, high glucose stimulated the high expression of miR-454-3p in pancreatic β cells. This implies that miR-454-3p may regulate the function of pancreatic β cells by responding to hyperglycemic stimulation. Further studies confirmed that inhibiting miR-454-3p can improve the function of pancreatic β cells, including promoting insulin synthesis and secretion. Our study suggests that miR-454-3p severely damages the function of pancreatic β cells and may lead to pancreatic β cell failure.
Studies have shown that mature miRNAs cause the degradation of target mRNA or prevent the translation of target mRNA by binding to the 3 'UTR of mRNA. 25 Relevant results from the bioinformatics website showed that the 3 ‘UTR region of Yy1 was complementary to miR-454-3p. Yy1 is a transcription factor commonly expressed in mammalian cells and is associated with transcriptional activation or transcriptional inhibition events of multiple genes. 26 Studies have shown that mice specifically knocked out Yy1 exhibit a range of phenotypes associated with pancreatic β cell damage, including decreased insulin levels and impaired glucose tolerance. 27 More studies have shown that Yy1 can promote insulin synthesis and promote the development and maturation of pancreatic β cells. 28 Therefore, we hypothesized that miR-454-3p might induce dysfunction of pancreatic β cells by binding and inhibiting Yy1. Studies have shown that the inhibitory effect of miRNA on mRNA is mediated by miRNA-induced silencing complex (miRISC). 29 Through complementary sequences, miRNA guides mRNA into miRISC. Subsequently, the mRNA is silenced by miRISC. Notably, Ago2 protein is a core component of miRISC. Therefore, by detecting the expression level of the target gene in the complex containing Ago2 protein, it can indirectly reflect whether there is a regulatory effect between the two genes. Our results show that miR-454-3p and Yy1 can simultaneously be enriched by anti-Ago2 antibodies. This suggests that miR-454-3p and Yy1 co-exist in miRISC, and miR-454-3p may induce the silencing of Yy1. A series of subsequent experiments confirmed our hypothesis. The level of Yy1 in T2DM patients was negatively correlated with miR-454-3p. Moreover, inhibition of the expression of miR-454-3p in pancreatic β cells caused the rise of Yy1. More importantly, our experiments confirmed that silencing Yy1 in pancreatic β cells attenuates increased insulin secretion and elevated cell viability induced by downregulation of miR-454-3p. Therefore, we hypothesized that miR-454-3p promotes functional damage of pancreatic β cells by targeting Yy1.
Our study partially explains the mechanism of miRNA involvement in T2DM. Therefore, our study provides a new target for clinical diagnosis and treatment of T2DM. In the future, we still need to explore the role of miR-454-3p/Yy1 axis in T2DM more deeply and comprehensively. For example, we need to explore the diagnostic value of miR-454-3p in a larger population. In addition, we need to further explore the therapeutic effect of regulating miR-454-3p/Yy1 axis on improving T2DM in animal models.
In conclusion, our study suggests that miRNAs are abnormally expressed in the pathogenesis of T2DM. The relative level of miR-454-3p in patients with T2DM is increased, and miR-454-3p has the potential to be a diagnostic marker for T2DM. More importantly, our study confirmed that abnormally expressed miR-454-3p is involved in the dysfunction of pancreatic β cells under high glucose by regulating Yy1, including dysplasia of proliferation and insulin secretion.
ORCID iD
Jian-zhong Zhu https://orcid.org/0009-0004-4765-2126
Statements and declarations
Ethical approval
The study was performed in line with the principles of the Declaration of Helsinki. Approval was granted by the Ethics Committee of Cangzhou Medical College before the study began. The written informed consent has been obtained from the participants involved.
Consent to participate
The written informed consent has been obtained from the participants involved.
Footnotes
Author contributions
Conceptualization, M.L. and J.Z.; Data curation, M.L., T.L. and J.L.; Formal analysis, J.L.; Funding acquisition, J.Z.; Investigation, M.L., J.L.; Methodology, M.L., H.Z. and J.Z.; Project administration, J.Z.; Resources, J.L., L.Z.; Software, J.L., L.Z.; Supervision, J.Z.; Validation, J.L.; Visualization, M.L.; Roles/Writing - original draft, M.L.; Writing - review & editing, T.L., L.Z., J.Z.
Funding
The authors received no financial support for the research, authorship, and/or publication of this article.
Conflicting interests
The authors declared no potential conflicts of interest with respect to the research, authorship, and/or publication of this article.
Data Availability Statement
The datasets used and/or analysed during the current study are available from the corresponding author on reasonable request.