
Abstract
Aims
To evaluate the potential causal role of sleep traits (STs) on diabetic retinopathy (DR).
Methods
The cross-sectional study included 23,851 patients with type 2 diabetes from the UK Biobank and used multivariate logistic models to investigate the observational association between STs and DR. Genetic correlation analysis and two-sample Mendelian randomization (MR) were conducted using ST data from the UK Biobank and DR data from the FinnGen consortium to investigate the genetic and causal associations between STs and DR.
Results
Patients who experienced daytime sleepiness often/all of the time had a higher risk for DR (OR: 1.40; 95% CI, 1.09–1.79; p = .008) compared with those who sometimes/never/rarely experienced daytime sleepiness. Genetic correlations between several STs and DR were detected by cross-trait linkage disequilibrium score regression. MR suggested a causal effect of self-reported daytime sleepiness (OR: 4.08; 95% CI, 1.44–11.61; p = .008), and accelerator-derived sleep duration (OR: 0.73; 95% CI, 0.54–0.98; p = .036) and sleep efficiency (OR: 0.54; 95% CI, 0.36–0.80; p = .002) on DR.
Conclusions
STs may have a potential causal role for DR. Attention should be paid to the STs of patients for better prevention and treatment of DR.
Keywords
Introduction
Diabetic retinopathy (DR) is a chronic microvascular complication of diabetes and the primary cause of vision loss in the working-age population. 1 Approximately one-third of people with diabetes show signs of retinopathy, making it a growing public health concern with the increasing prevalence of diabetes worldwide.1,2 Although several risk factors for DR have been identified, such as poor glycemic control, hypertension, and dyslipidemia, they altogether account for only 9% to 10% of the risk for DR. 3 Therefore, it is crucial to identify other modifiable risk factors to manage DR effectively.
Sleep-related traits, including sleep duration, insomnia, daytime sleepiness, daytime napping, and chronotype have been attracting increasing attention. These traits are important contributors to health because they not only negatively affect short-term work function and quality of life, but also increase the long-term risk of various cardiovascular and neurodegenerative diseases, such as coronary heart disease, stroke, and Alzheimer’s disease.4–8 Recent research has also revealed a direct link between sleep traits and type 2 diabetes (T2D),9–11 possibly through changes in insulin resistance and glycosylated hemoglobin (HbA1c) levels.12–14 Furthermore, some studies have discovered that sleep disorders can cause endothelial dysfunction, leading to microvascular diseases. 15 Given the strong connection between sleep traits, glucose metabolism, and endothelial function, it’s hypothesized that these traits may also be associated with an increased risk of DR. However, most of the existing studies are cross-sectional, and often suffer from small sample sizes, residual confounding, and reverse causality, resulting in conflicting results. 16 Currently, it remains to be elucidated whether sleep traits affect DR risk and whether there is a causal relationship between them.
In this study, we triangulated the evidence using observational study and Mendelian randomization (MR) analysis to assess the potential causality between sleep traits and DR. First, we conducted an observational study based on the UK Biobank, a large population-based dataset. Next, we performed genetic correlation analysis and MR, which is an emerging epidemiologic etiologic approach that uses genetic variants (generally single nucleotide polymorphisms (SNPs)) as instrumental variables (IVs). 17 Because genetic variants are acquired through random assortment during meiosis and are not affected by environmental factors, MR is considered to overcome confounding and reverse causality and reliably reflect the association between exposure and outcome, providing a high level of causal evidence.18,19 Since these methods have different sources of bias, the consistency of the results of the three approaches greatly increases the confidence in causal inference. 20 Our aim was to provide strong evidence for the association of sleep traits with DR.
Materials and methods
Study design
This study mainly consists of three parts: observational study, genetic correlation analysis and MR, and the flow chart of the study and the assumptions for MR are shown in Figure 1. In this study, sleep traits were used as the exposure and DR as the outcome. See Supplemental Text for specific information on study design and ethical approval. This article was reported according to recommendations by the STROBE and STROBE-MR guidelines. Flowchart of the study design. The flow chart shows the design and main methods of the study. Three approaches were adopted in this study: cross-sectional study, genetic correlation analysis and Mendelian randomization. Panel (A) shows the inclusion and exclusion criteria for the cross-sectional study. Panel (C) illustrates the three assumptions of Mendelian randomization: Assumption 1 (Relevance assumption): the genetic variants are associated with the exposure; Assumption 2 (Independence assumption): there are no unmeasured confounders between genetic variants and the outcome; Assumption 3 (Assumption of exclusion restriction): the genetic variants only affect the outcome through their effect on the exposure. LDSC: linkage disequilibrium score; SNP: single nucleotide polymorphism; HbA1c: glycated hemoglobin.
Observational analysis in the UK Biobank
We first conducted a cross-sectional study based on data from the UK Biobank in order to estimate the observational association between sleep traits and DR. Information on sleep traits were acquired from the touch-screen questionnaire during the participant’s initial Assessment Center visit. Here, we included only participants with T2D. 21 Diagnosis codes for DR were obtained from the published literature.22,23 The inclusion and exclusion process of the observational study population is detailed in Figure 1, and the definition codes used for T2D and DR are detailed in Supplemental Table 1.
Logistic regression model with 95% confidence interval (CI) was used to estimate odds ratio (OR) to reflect the observational effect of sleep traits on DR. We reported models that are (1) unadjusted with only single sleep trait included; (2) partially adjusted for age, sex, and race; and (3) fully adjusted, with additional adjustments for education, Townsend deprivation index, duration of diabetes, smoking status, alcohol drinking status, physical activity, body mass index (BMI), HbA1c, estimated glomerular filtration rate (eGFR), hypertension, dyslipidemia, and use of antihypertensive, antilipemic and antidiabetic medication (details of covariates are provided in Supplemental Table 2).
To test the robustness of our estimates, we performed a sensitivity analysis that excluded participants with a diabetes duration of less than 3 years. Considering that each sleep trait alone may be a manifestation of other sleep disorders, we additionally included all five sleep traits in the same model to verify the independent effects of each sleep trait on DR. Moreover, subgroup analyses were performed based on age, gender, race, prevalent sleep apnea (SA) and night-shift work, and likelihood ratio tests were used to assess multiplicative scale interactions.
A two-sided p value of less than .05 were considered to indicate statistical significance. We used Stata (version 13; StataCorp LLC, College Station, Texas USA) to perform all data analyses described above.
Summary-level GWAS data sources
The specific information of all the summary-level genome-wide association study (GWAS) data used in this study is presented in Supplemental Table 6 and Supplemental Text. Our MR study was limited to subjects of European ancestry to minimize confounding caused by population stratification. We selected exposure GWAS and outcome GWAS with no sample overlap to minimize the risk of bias due to sample overlap in the two-sample MR. 24
Data on sleep traits were extracted from the UK Biobank, including five self-reported sleep traits (self-reported sleep duration [n = 446,118], 25 insomnia [n = 453,379], 26 daytime sleepiness [n = 452,071], 27 daytime napping [n = 452,633] 28 and chronotype [n = 449,734] 29 ) and two accelerometer-derived sleep traits 30 (accelerometer-derived sleep duration [n = 85,449] and sleep efficiency [n = 84,810]). Summary data on DR were extracted from the R9 release of the FinnGen consortium, and contained 319,046 individuals of European ancestry with 10,413 cases and 308,633 controls. 31
LDSC regression analysis
Cross-trait linkage disequilibrium score (LDSC) regression analysis can effectively identify the common genetic structure of human traits and determine the genetic correlation between complex traits and diseases based on GWAS summary data. 32 We used R package “ldscr” (version 0.1.0) in R software (version 4.2.1; the R Foundation for Statistical Computing, Vienna, Austria) to conduct the LDSC regression analysis.
Two-sample MR analysis
The selection criteria for IVs and specific descriptions for MR methods are detailed in the Supplemental text. We first performed univariable Mendelian randomization (UVMR) to determine the overall causal effect of genetically predicted sleep traits on the risk of DR. We used inverse variance weighted (IVW) with multiplicative random-effects as the main method. To account for horizontal pleiotropy and ensure result robustness, we applied three methods using IVs assumptions with relaxation, including MR Egger, 33 weighted median 34 and Mendelian randomization pleiotropy residual sum and outlier (MR-PRESSO) 35 methods. Moreover, heterogeneity among IVs estimates was assessed with the use of the Q statistic, 36 leave-one-out analysis 37 and funnel plot. 37 We also applied the MR Steiger directionality test 38 and bidirectional MR methods 39 to rule out possible bias due to reverse causality. Furthermore, we used multivariable Mendelian randomization (MVMR) to estimate the direct causal effect of self-reported daytime sleepiness on DR risk independent of BMI, HbA1c concentration, hypertension status and triglyceride levels, as it obtained positive results in UVMR. Similarly, we used IVW as the primary MVMR analysis method and applied the MVMR Egger and MVMR weighted median method as sensitivity analysis.
We used ORs and corresponding 95% CIs to assess the strength of causal associations. All p values are two-sided, and conventional significance levels were used in this study (p < .05). All MR analyses were conducted using R packages “TwoSampleMR” (version 0.5.6), “MRPRESSO” (version 1.0), “Mendelian Randomization” (version 0.6.0) and “MVMR” (version 0.3).
Results
Observational evidence from the UK Biobank
Characteristics of participants from UK Biobank stratified according to the presence or absence of diabetic retinopathy.
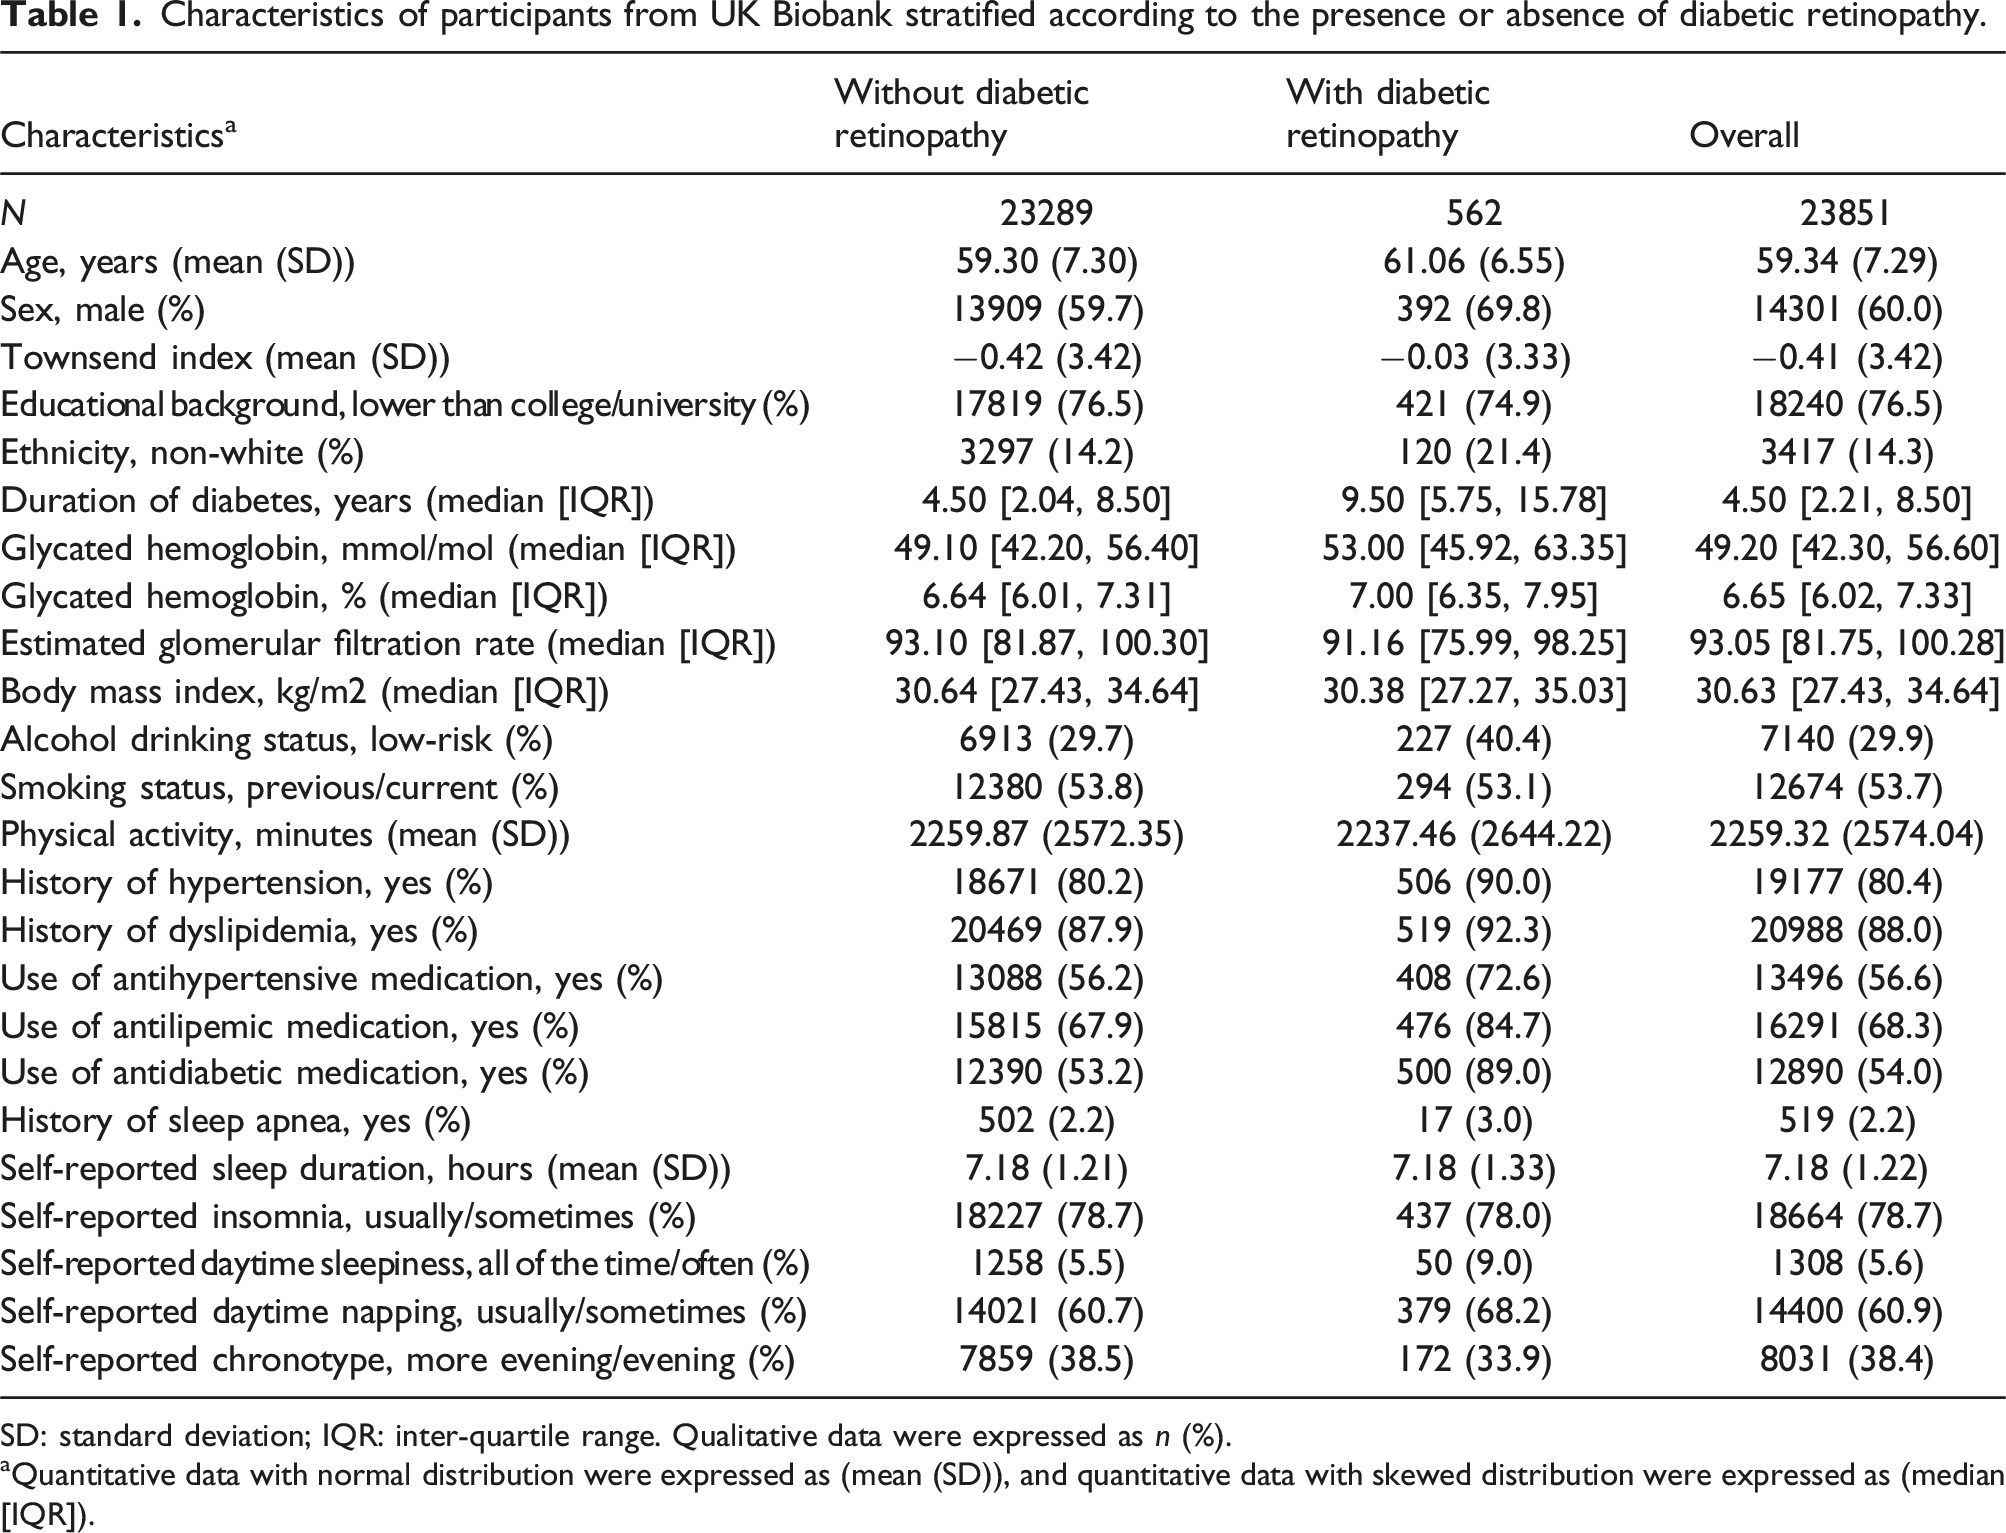
SD: standard deviation; IQR: inter-quartile range. Qualitative data were expressed as n (%).
aQuantitative data with normal distribution were expressed as (mean (SD)), and quantitative data with skewed distribution were expressed as (median [IQR]).
Observational associations between sleep traits and diabetic retinopathy.

OR: odds ratio; CI: confidence interval.
aAdjusted for age, sex and race.
bAdjusted for age, sex, race, education, Townsend deprivation index, duration of diabetes, smoking status, alcohol drinking status, physical activity, body mass index, glycated hemoglobin, estimated glomerular filtration rate, hypertension, dyslipidemia, and use of antihypertensive, antilipemic and antidiabetic medication.
Genetic correlation between sleep traits and DR
Genetic correlation between sleep traits and diabetic retinopathy.

Rg: genetic correlation.
Two-sample MR estimates
Details of the selected IVs are provided in Supplemental Tables 13–19. The F-statistics for the included SNPs ranged from 28.8 to 220.9, indicating minimal weak instrument bias. According to the IVW approach, UVMR has confirmed that there is a total causal association between self-reported daytime sleepiness, accelerometer-derived sleep duration, and accelerometer-derived sleep efficiency with DR (as shown in Figure 2 and Supplemental Table 7). Specifically, each grade increase in genetically predicted severity of self-reported daytime sleepiness was found to be associated with a 308% increase in DR risk (OR: 4.08; 95% CI, 1.44–11.61; p = .008). Similarly, each SD increase in genetically predicted accelerometer-derived sleep duration and accelerometer-derived sleep efficiency was found to be associated with a 27% (OR: 0.73; 95% CI, 0.54–0.98; p = .036) and 46% (OR: 0.54; 95% CI, 0.36–0.80; p = .002) decrease in DR risk, respectively. There were no significant associations of other sleep traits with DR. UVMR (A) and MVMR (B) IVW estimates of sleep traits on diabetic retinopathy. UVMR: univariable Mendelian randomization; MVMR: multivariable Mendelian randomization; IVW: inverse variance weighted; SNP: single nucleotide polymorphism; OR: odds ratio; CI: confidence interval; BMI: body mass index; HbA1c: glycated hemoglobin.
MR Egger, weighted median and MR-PRESSO estimates were similar to IVW, confirming the robustness of the IVW estimates (Supplemental Table 7). Although the Q statistic suggested significant heterogeneity (Q-P value <.05), the Egger intercept did not show evidence of directed pleiotropy (MR Egger intercept p value >.05), indicating that there was balanced pleiotropy in IVs (Supplemental Table 7). 33 Given that the IVW model with multiplicative random-effects can balance the heterogeneity between IVs estimates, the causal effect estimated by IVW is acceptable. 36 The funnel plot was symmetric, illustrating the reliability of the results (Supplemental Figures 1–7). Meanwhile, leave-one-out analyses revealed that most causal effects were not influenced by any single SNP, except for accelerometer-derived sleep duration (Supplemental Figures 1–7); however, this should not adversely affect our causal inference, given that no substantial pleiotropy or heterogeneity was detected. In addition, reverse MR suggested that DR had no causal effect on sleep traits (Supplemental Table 8), which is consistent with the results of the MR Steiger directionality test (Supplemental Table 7), indicating the correct causal directionality of the effect of sleep traits on DR.
Sensitivity analyses based on different instrument selection criteria further enhanced the validity of the primary outcome of UVMR. First, we repeated the analysis after excluding SNPs directly associated with possible confounders with the use of GWAS Catalog (Supplemental Tables 9 and 10), and the results remained consistent with the main findings. Second, after adjusting for the degree of linkage disequilibrium of IVs, the number of SNPs included in the analysis set increased, and the subsequent UVMR performed also provided consistent results (Supplemental Table 11).
In the MVMR analysis, the effect of daytime sleepiness on DR remained significant after adjusting for HbA1c (IVW OR: 18.34; 95% CI, 3.08–109.32; p = .001) or hypertension (OR: 3.79; 95% CI, 1.27–11.33; p = .017), whereas the effect was attenuated after adjustment for BMI (OR: 0.86; 95% CI, 0.31–2.38; p = .779) or triglyceride (OR: 1.67; 95% CI, 0.40–6.92; p = .478) (Figure 2 and Supplemental Table 12). The results of MVMR Egger and MVMR median were similar to those of MVMR IVW. In addition, the p values of MVMR-Egger intercept were all >.05. These findings suggest a low risk of bias due to directional pleiotropy.
Discussion
Sleep deprivation and irregular sleep are a growing health concern in modern society. Long-term insufficient sleep and sleep disorders are associated with harmful health consequences such as hypertension, obesity, and glucose metabolism disorders, and these conditions are important risk factors for DR.3,40 However, the exact association between sleep and DR is not fully understood, as previous observational studies have shown inconsistent results and the type of these studies limits their ability to infer a causal relationship. 16 In this study, we combined observational evidence from the UK Biobank cohort and MR results based on genetic data to explore the potential causal role of common sleep traits in DR.
Our observational study first explored the association of five self-reported sleep traits with DR and found that excessive daytime sleepiness (EDS) was significantly associated with an increased risk of DR. The results of genetic correlation analysis and MR analysis were consistent with the observational study, which greatly increased the strength of evidence. EDS is a common feature of sleep disorders, characterized by the inability to stay awake and alert during daytime work hours. 41 According to epidemiological surveys, up to 33% of U.S. adults experience EDS, and its prevalence has been increasing in recent years.42,43 EDS may be caused by sleep disorders like SA or lifestyle and work habits that disrupt sleep such as night-shifts, and may also be affected by other sleep traits such as insufficient sleep duration and insomnia. 41 To determine the independent effect of EDS on DR, we further adjusted for other sleep traits and performed subgroup analyses based on SA and night-shift work status. Even after taking other sleep traits into account, the association between EDS and DR remained significant, and no interaction was found between SA or night-shift work and daytime sleepiness. Additionally, our MVMR analysis showed that daytime sleepiness increases the risk of DR, even after adjusting for common DR risk factors such as HbA1c level and hypertension. However, the impact of daytime sleepiness on DR risk was attenuated after adjusting for BMI or triglyceride, suggesting that the effect may be driven by obesity and lipid metabolism disorders. It is important to interpret these findings with caution, as the sample size of the GWASs and number of IVs included may have limited the strength of the IVs. To date, only two observational studies have attempted to explore this link. One study with 1,231 Asian diabetes patients found that EDS was linked to a higher risk of vision-threatening DR. 44 However, another study from India did not find any association between EDS and DR. 45 Both studies had limitations, such as small sample sizes and cross-sectional designs, making it hard to establish causality and direction. Our study overcame these limitations through triangulation of evidence and suggested that EDS may be a potential causal risk factor for DR.
To avoid bias from self-reported sleep data, we used accelerometer-based sleep duration and sleep efficiency in our MR analysis. The accelerometer data was processed using a validated algorithm by polysomnography (PSG) data, which is considered the “gold standard” of sleep monitoring, and subjected to a rigorous quality control process.30,46 Thus, these accelerometer-derived objective sleep data largely avoided the bias caused by subjective recall and reflected true sleep conditions. Sleep duration and sleep efficiency reflect the two key attributes of good or bad sleep - sleep quantity and sleep quality, respectively - with the latter helping to distinguish self-reported true sleep duration from “time in bed”. 47 Our study found that sleep quality is a better indicator of the risk of DR than sleep duration. Higher sleep quality is more protective against DR than longer sleep duration, with OR for a protective effect of 0.54 versus 0.73, respectively. While objective sleep data is more reliable, self-reported sleep information still has value. In clinical settings, it may not be practical for patients to undergo PSG testing to check DR risk due to the inconvenience of such tests. In these cases, asking about self-reported sleep traits, particularly daytime sleepiness, can be more efficient and cost-effective. However, further studies are needed to quantify self-reported daytime sleepiness and explore its dose-response relationship with the risk of DR. Moreover, a corresponding standardized questionnaire should be made to improve its clinical application value.
It was discovered that only daytime sleepiness had a significant impact on DR, while other sleep traits had no notable effect. From a clinical perspective, daytime sleepiness may reflect individual sleep quality more accurately than other sleep traits. While short sleep duration and insomnia are linked to EDS, individual sleep needs vary—more sleep doesn’t necessarily mean better sleep. Studies indicate certain genes affect sleep quality and duration. For example, the DEC2-P384R mutation results in a 1.5-h lower sleep requirement without increased daytime sleepiness or risk for DR. Considering the pathophysiological mechanisms, the strong correlation between daytime sleepiness and DR may be more closely related to how daytime sleepiness affects the body’s circulation, metabolism, and inflammatory state, compared to other sleep traits. EDS is often linked to sedentary behavior and physical inactivity, which can slow blood circulation and suppress exercise-induced hemodynamic vascular responses. 48 This includes reduced shear forces and vasodilators, which may contribute to DR by decreasing retinal oxygen supply and triggering vascular inflammation.48,49 Additionally, prolonged daytime sleepiness may lower the body’s metabolic rate, resulting in a slower breakdown of body fat and cholesterol.50,51 This can increase the risk of obesity and hyperlipidemia, both of which have been associated with a heightened risk of developing DR. 1 Moreover, EDS may adversely affect DR by inducing systemic and retinal inflammation, supported by increased circulating inflammatory markers (such as IL-1β, IL-6, and TNF-α) found in individuals experiencing EDS.52,53 However, the exact mechanisms by which sleep traits influence DR and the differences among these traits require further investigation.
Our research is significant because it is the first study to investigate the link between sleep traits and DR using triangular evidence from different sources of bias, including MR. The consistency of the results greatly strengthens the causal inference. However, there are some limitations to the study that need to be acknowledged. First, our research primarily focused on the Caucasian population due to the limitations of the UK Biobank data and the currently available GWAS resources. This focus restricts the generalizability of our findings. While our cross-sectional study included a small number of non-Caucasian participants from the UK Biobank for subgroup analyses and found no interactions, there remains a need for larger population-based studies, as well as GWAS and MR analyses in other regions, such as Asia and Africa to further validate the impact of sleep traits on DR, especially considering the regional differences in the global diabetes epidemic. Second, due to the limited sample size and data availability, we were unable to explore the relationship between sleep traits and DR of different severity, and this warrants further investigation in the future. Third, the genetic variants used in the MR analyses represent lifelong exposure, which may result in overestimated effect sizes and may not accurately reflect actual occurrences. 54 Despite the apparent plausibility of larger effect sizes in the MR study compared to observational results, caution should be exercised when interpreting causal effect sizes in the MR study.
In summary, our study supports that sleep traits may have a potential causal role for DR, with EDS, insufficient sleep duration, and poor sleep quality significantly increasing the risk of DR. Physicians should pay attention to the sleep traits of patients, especially those with EDS, in order to better prevent and treat DR.
Supplemental Material
Supplemental Material - Unraveling the causal role of sleep traits in development of diabetic retinopathy: A UK Biobank observational study and Mendelian randomization
Supplemental Material for Unraveling the causal role of sleep traits in development of diabetic retinopathy: A UK Biobank observational study and Mendelian randomization by Yikeng Huang, Xiaoyin Xu, Xinyu Zhang, Xinyu Zhu, Bo Li, Mingming Ma, Chuandi Zhou, Chufeng Gu, Yujin Jiang, Yanlin Wu, Zhi Zheng and Shuzhi Zhao in Journal of Diabetes & Vascular Disease Research.
Footnotes
Acknowledgements
This research was conducted using the UK Biobank resource under application number 88982. We would like to thank the participants and investigators of the FinnGen study and acknowledge the authors and participants of all GWASs from which we used summary statistics data.
Author contributions
Y.H., X.X. and X.Zhang: Data curation, formal analysis, investigation, methodology, software, validation, visualization and writing – original draft. X.Zhu, B.L., M.M., C.Z., C.G. and Y.J.: Formal analysis, investigation and writing – review & editing. L.W., Z.Z. and S.Z.: Conceptualization, funding acquisition, project administration, resources, supervision and writing – review & editing.
Declaration of conflicting interests
The author(s) declared no potential conflicts of interest with respect to the research, authorship, and/or publication of this article.
Funding
The author(s) disclosed receipt of the following financial support for the research, authorship, and/or publication of this article: This study was supported by grants from the National Natural Science Foundation of China (No. 82271111).
Ethics statement
Supplemental Material
Supplemental material for this article is available online.
Appendix
References
Supplementary Material
Please find the following supplemental material available below.
For Open Access articles published under a Creative Commons License, all supplemental material carries the same license as the article it is associated with.
For non-Open Access articles published, all supplemental material carries a non-exclusive license, and permission requests for re-use of supplemental material or any part of supplemental material shall be sent directly to the copyright owner as specified in the copyright notice associated with the article.