
Abstract
Objective:
Arterial stiffness has been associated with diabetic retinopathy; however, the information is limited in Asians. We aim to examine the association of central arterial stiffness with the presence and severity of diabetic retinopathy in type 2 diabetes mellitus patients in Singapore.
Methods:
Arterial stiffness was estimated by carotid-femoral pulse wave velocity and augmentation index using applanation tonometry method. Digital colour fundus photographs from 1,203 patients were assessed for diabetic retinopathy. Diabetic retinopathy severity was categorized into non-proliferative diabetic retinopathy and proliferative diabetic retinopathy. Logistic regression model was used to evaluate the associations of diabetic retinopathy with pulse wave velocity and augmentation index.
Results:
Diabetic retinopathy was diagnosed in 391 (32.5%) patients, including 271 non-proliferative diabetic retinopathy and 108 proliferative diabetic retinopathy. Diabetic retinopathy have higher pulse wave velocity (11.2 ± 3.3 vs 9.5 ± 2.6 m/s, p < 0.001) and augmentation index (28.4 ± 9.4 vs 26.1 ± 10.6%, p < 0.001) than non-diabetic retinopathy. After multivariable adjustment, pulse wave velocity [odds ratio = 1.11 (95% confidence interval = 1.05–1.17), p < 0.001] and augmentation index [odds ratio = 1.03 (95% confidence interval = 1.01–1.04), p = 0.009] was associated with diabetic retinopathy. In severity analyses, pulse wave velocity was associated with non-proliferative diabetic retinopathy [odds ratio = 1.10 (95% confidence interval = 1.03–1.17), p = 0.002] and proliferative diabetic retinopathy [odds ratio = 1.15 (95% confidence interval = 1.06–1.25), p = 0.001] (p-trend < 0.001). Augmentation index showed significant associations with non-proliferative diabetic retinopathy [odds ratio = 1.02 (95% confidence interval = 1.01–1.04), p = 0.008], but not with proliferative diabetic retinopathy [odds ratio = 1.01 (95% confidence interval = 0.98–1.04), p = 0.36] (p-trend = 0.03).
Conclusion:
Central arterial stiffness was associated with the presence and severity of diabetic retinopathy in type 2 diabetes mellitus patients, suggesting its etiologic implication in diabetic retinopathy.
Introduction
Type 2 diabetes mellitus (T2DM) is a rapidly evolving global health issue, and Asia is the epicentre of this worldwide epidemic. 1 T2DM prevalence has been predicted to double from 7.3% in 1990 to 15% in 2050 in Singapore, a multi-ethnic city-state composed of three major ethnic groups (Chinese, Malays and Indians). 2 Diabetic retinopathy (DR) is one of the most important diabetic microvascular complications and a leading cause of irreversible blindness among working-age individuals around the world. 3 The overall prevalence of DR is lower in Asians compared with Western population. 4 However, prevalence of DR in Singapore is higher than other Asian countries, reaching close approximation with Western countries. 5
Arterial stiffness is a progressive age-related process that is shared consequence of numerous systemic diseases and is a well-established biomarker of vasculopathy. Existing evidence suggests that arterial stiffness is a key component in the pathogenesis of T2DM and has independent predictive value for vascular complications associated with T2DM. 6 Pulse wave velocity (PWV) and augmentation index (AI) are two well-known non-invasive measures of arterial stiffness that are being widely used in clinical setting. PWV is considered the ‘gold-standard’ measurement for arterial stiffness and can be determined through regional arterial segments, including central (e.g. heart-femoral, carotid-femoral) and peripheral (e.g. brachial-ankle and femoral-ankle) segments. 7 AI is a surrogate measurement of arterial stiffness that is assessed from central arterial pressure waveform in the form of wave reflection. 8
Recently, scientific evidence on arterial stiffness in DR has begun to accumulate. Five studies have consistently demonstrated a positive relationship between peripheral arterial stiffness (brachial-ankle PWV) and the presence of DR.9–13 And, of these, only one study has further demonstrated the association of peripheral arterial stiffness with severity of DR. 9 To date, three studies have reported associations of central arterial stiffness with the presence of DR, but none of these have examined central arterial stiffness with respect to severity of DR.7,14,15 Furthermore, three studies have examined the association of AI with the presence and severity of DR, but the results have been inconclusive, with null 12 or positive association.14,16 Of note, to our knowledge, no study has examined the association between central arterial stiffness and DR in Singapore.
In this study, we aim to evaluate the association of central arterial stiffness, measured using carotid-femoral PWV and AI, with respect to the presence and severity of DR in a multi-ethnic T2DM Asian cohort in Singapore.
Materials and methods
Study population and design
The Singapore Study of Macro-angiopathy and Micro-vascular Reactivity in Type 2 Diabetes (SMART2D) is a completed cross-sectional study conducted between August 2011 and February 2014 including a total of 2,057 adults aged 21–90 years with T2DM. 17 Inclusion and exclusion criteria of SMART2D have been previously described. 17 DR were assessed in the ongoing follow-up study from September 2014. In our study, a total of 1,203 patients were included. Compared to unselected patients, these selected patients were younger and have shorter diabetes duration. Generally, they have similar baseline profile, including gender, haemoglobin A1C (HbA1c) level, body mass index (BMI), smoking and usage of insulin (Supplemental Table S1). This study has been approved by the National Healthcare Group Domain Specific Review Board (NHG-DSRB). Written informed consent was obtained from all subjects prior to enrolment in the study.
Assessment of DR
Single-field photos of 45°, centred on the macula, were taken using non-mydriatic camera (pupils were not dilated) for both eyes in all study subjects (TRC-NW 200, Topcon Co., Japan) at follow-up visit. For each eligible eye, two digital colour fundus photographs were captured and assessed by a fellowship trained retina specialist in a masked fashion to minimize any possible bias. The photographs were not graded and labelled as ungradable if more than 50% of the retinal photographs were not clearly visible. DR was considered present if any characteristic lesions as defined by Early Treatment Diabetic Retinopathy Study were present. The minimum criterion for diagnoses of DR was presence of at least one definite micro aneurysm and/or retinal haemorrhage. DR severity was further categorized into mild, moderate and severe non-proliferative DR (NPDR) and proliferative DR (PDR). 18 DR was classified as NPDR based on the presence of one or more of the following features: micro aneurysms, haemorrhages, hard or soft exudates, venous beading and intraretinal microvascular abnormalities. DR was classified as PDR if there was neovascularization, pre-retinal haemorrhages, vitreous haemorrhage or panretinal laser photocoagulation scars. The severity of DR in the worse-affected eye was used for retinopathy grading. Intra-rater reliability was excellent with an observed percentage agreement of 92.4% for presence of DR (kappa = 0.79) and 89.9% for severity of DR (kappa = 0.74).
Measurement of central arterial stiffness
Carotid-femoral pulse wave velocity
Arterial stiffness was assessed using SphygmoCor® (AtCor Medical, Sydney, Australia), a validated device that has been shown to have a high level of intra-observer (0.1 ± 1.8 m/s for carotid-femoral PWV; 0.49 ± 0.93% for AI) and inter-observer reproducibility (0.3 ± 1.6 m/s for carotid-femoral PWV; 0.23 ± 0.66% for AI) in different populations, including diabetic patients. 19 Carotid-femoral PWV was measured by the foot-to-foot method as described previously. 20 Briefly, the pulse waveform was captured using a high-fidelity applanation tonometer at the carotid and subsequently at the femoral artery. Consecutive waves were gated by electrocardiogram, and the transit time of the waves between carotid and femoral sites was calculated. The average of transit time was calculated based on 9–10 pulse waves in each assessment. Surface distances between carotid and femoral were measured by means of a tape ruler over the body surface. PWV was expressed as the distance between the two recording sites (metres) divided by transit time (seconds). In order to ensure a reliable measurement of PWV, the standard deviation (SD) of measurements should be equal to or less than 10%.
Augmentation index
The first and second systolic peaks of the radial and the derived aortic pressure waveforms were identified automatically by the SphygmoCor software. AI was calculated from aortic pressure waveform as (second systolic peak–first systolic peak)/pulse pressure × 100. 6 Only results passing the quality control algorithm by the manufacturer were used for analysis.
Measurement of clinical and biochemical variables
Blood pressure was measured after 5 min of seated rest using a mercury sphygmomanometer on the right arm using appropriate cuff sizes. Systolic blood pressure (SBP) and diastolic blood pressure (DBP) were calculated from the average of three most consistent readings. Hypertension was defined as SBP ⩾ 140 mmHg or DBP ⩾ 90 mmHg or currently taking antihypertensive medications (i.e. angiotensin-converting enzyme, angiotensin receptor blockers). HbA1c was measured based on monoclonal antibody agglutination reaction using a point-of-care immunoassay analyzer (DCA Vantage Analyzer; Siemens, Erlangen, Germany) certified by National Glycohemoglobin Standardization Program. Serum total cholesterol (TC), high-density lipoprotein cholesterol (HDL-C) and low-density lipoprotein cholesterol (LDL-C) were quantified by enzymatic method using Kodak Ektachem chemistry slides. Total triglycerides was quantified by enzymatic colorimetric method on Roche/Hitachi cobas c system. Urinary albumin-to-creatinine ratio (ACR) was determined by urinary creatinine measured by enzymatic method on Roche/Hitachi cobas c system (Roche Diagnostic GmbH, Mannheim, Germany) and albumin measured by a solid-phase competitive chemiluminescent enzymatic immunoassay with a lower detection limit of 2.5 µg/ml (Immulite; DPC, Gwynedd, UK). Estimated glomerular filtration rate (eGFR) was calculated based on a widely used Chronic Kidney Disease Epidemiology Collaboration (CKD-EPI) equation in patients with diabetes. 21 Chronic kidney disease (CKD) was defined by the presence of eGFR < 60 ml/min/1.73 m2 or kidney damage as indicated by ACR ⩾ 30 mg/g. 22 Assessment for neuropathy was performed by a neurothesiometer (Horwell Scientific, Wilford, Nottingham, UK) for vibration and with a 10 g monofilament for light touch as described previously. 23 Neuropathy was present if an abnormal finding in monofilament (inability to detect at least 8 of 10 points on either foot) or neurothesiometer testing of ⩾ 25 V was detected. 23 Visceral fat area (VFA) was determined by tetrapolar bioelectrical impedance analysis (InBody-S20; BioSpace, Los Angeles, CA, USA).
Statistical analysis
Standard descriptive statistics were used to describe the characteristics of patients with T2DM. Normally distributed continuous data were expressed as means and SDs. Skewed variables were expressed as median and inter-quartile range and nature log (ln)-transformed before data analysis. Differences among patients without DR and with different stages of DR were compared by t-test, one-way analysis of variance (ANOVA) or χ2 tests where appropriate. Variables that were statistically significant in univariate analysis (Supplemental Table S2) or with putative roles in the pathobiology of DR were added for adjustment. Logistic regression was used to examine the associations of PWV or AI with the presence of DR. Multinomial logistic regression was used to examine the association of PWV or AI with the severity of DR. Ordinal logistic regression models were used to estimate the overall trend of the above associations. All statistical analysis was performed using STATA version 14.0 (STATA Corporation, College Station, Texas, USA). A two-tailed p value of less than 0.05 was considered as statistically significant.
Results
In this study, the presence of DR was found in 391 (32.5%) of the 1,203 patients, including 271 NPDR and 108 PDR (12 ungradable). Table 1 summarizes the clinical and biochemical characteristics of T2DM patients stratified by the presence of DR. DR patients have longer duration of diabetes, higher HbA1c, SBP and triglycerides and lower HDL-C when compared with patients without DR. The percentage of hypertension, high VFA (⩾100 cm2), CKD, neuropathy and commonly used medications in diabetes [e.g. insulin, renin–angiotensin system (RAS) medication] were significantly higher in patients with DR than those without DR (p < 0.001).
Clinical and biochemical characteristics of individuals with T2DM stratified by presence of DR.
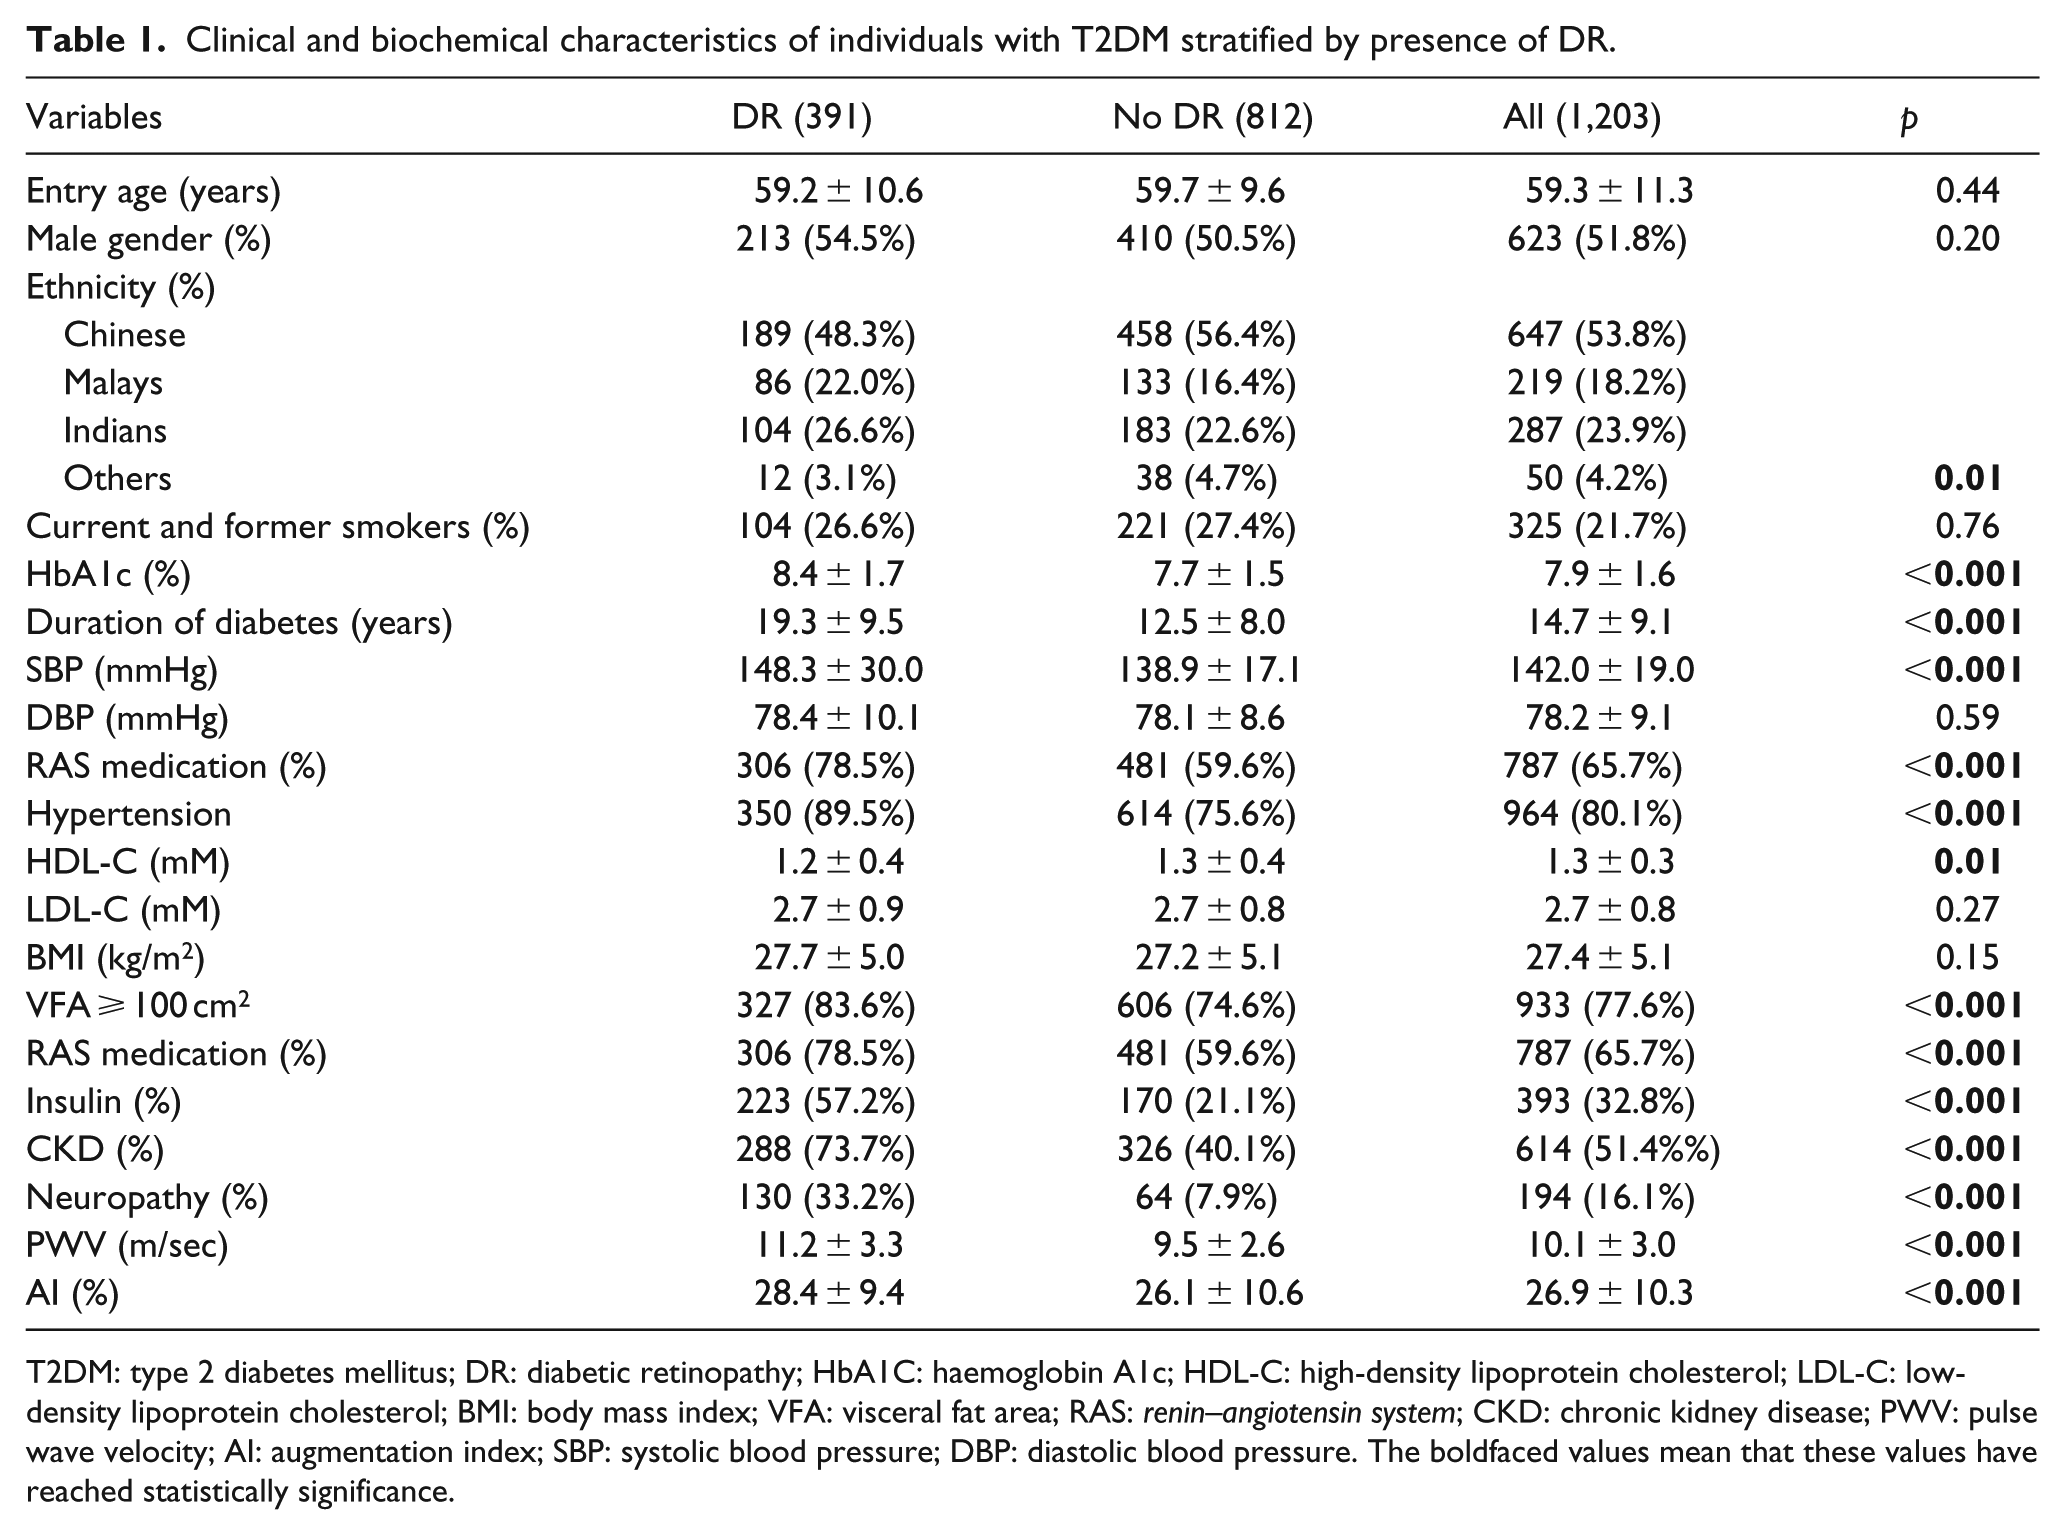
T2DM: type 2 diabetes mellitus; DR: diabetic retinopathy; HbA1C: haemoglobin A1c; HDL-C: high-density lipoprotein cholesterol; LDL-C: low-density lipoprotein cholesterol; BMI: body mass index; VFA: visceral fat area; RAS: renin–angiotensin system; CKD: chronic kidney disease; PWV: pulse wave velocity; AI: augmentation index; SBP: systolic blood pressure; DBP: diastolic blood pressure. The boldfaced values mean that these values have reached statistically significance.
Central arterial stiffness and the presence of DR
PWV (m/s) and AI (%) levels were significantly higher in DR than in those without DR (PWV: 11.2 ± 3.3 vs 9.5 ± 2.6 m/sec, p < 0.001; AI: 28.4% ± 9.4% vs 26.1% ± 10.6%, p < 0.001). In univariate analysis, one unit increase in PWV and AI levels was associated with an increased odds of 1.22 (95% confidence interval (CI) = 1.17–1.27, p < 0.001) and 1.02 (95% CI = 1.01–1.03, p < 0.001) for the presence of DR, respectively. In multivariable regression model, the associations of PWV and AI with the presence of DR remained significant after adjustment (PWV: OR = 1.11, 95% CI = 1.05–1.17, p < 0.001; AI: OR = 1.03, 95% CI = 1.01–1.04, p = 0.009, Table 2). The following variables were incorporated as covariates in multivariate logistic regression model: age, gender, ethnicity, duration of diabetes, HbA1c, hypertension, HDL-C, triglycerides, BMI, VFA, CKD, neuropathy, insulin and RAS medication (i.e. angiotensin-converting enzyme or angiotensin receptor blockers).
Association of PWV and AI with presence of DR.
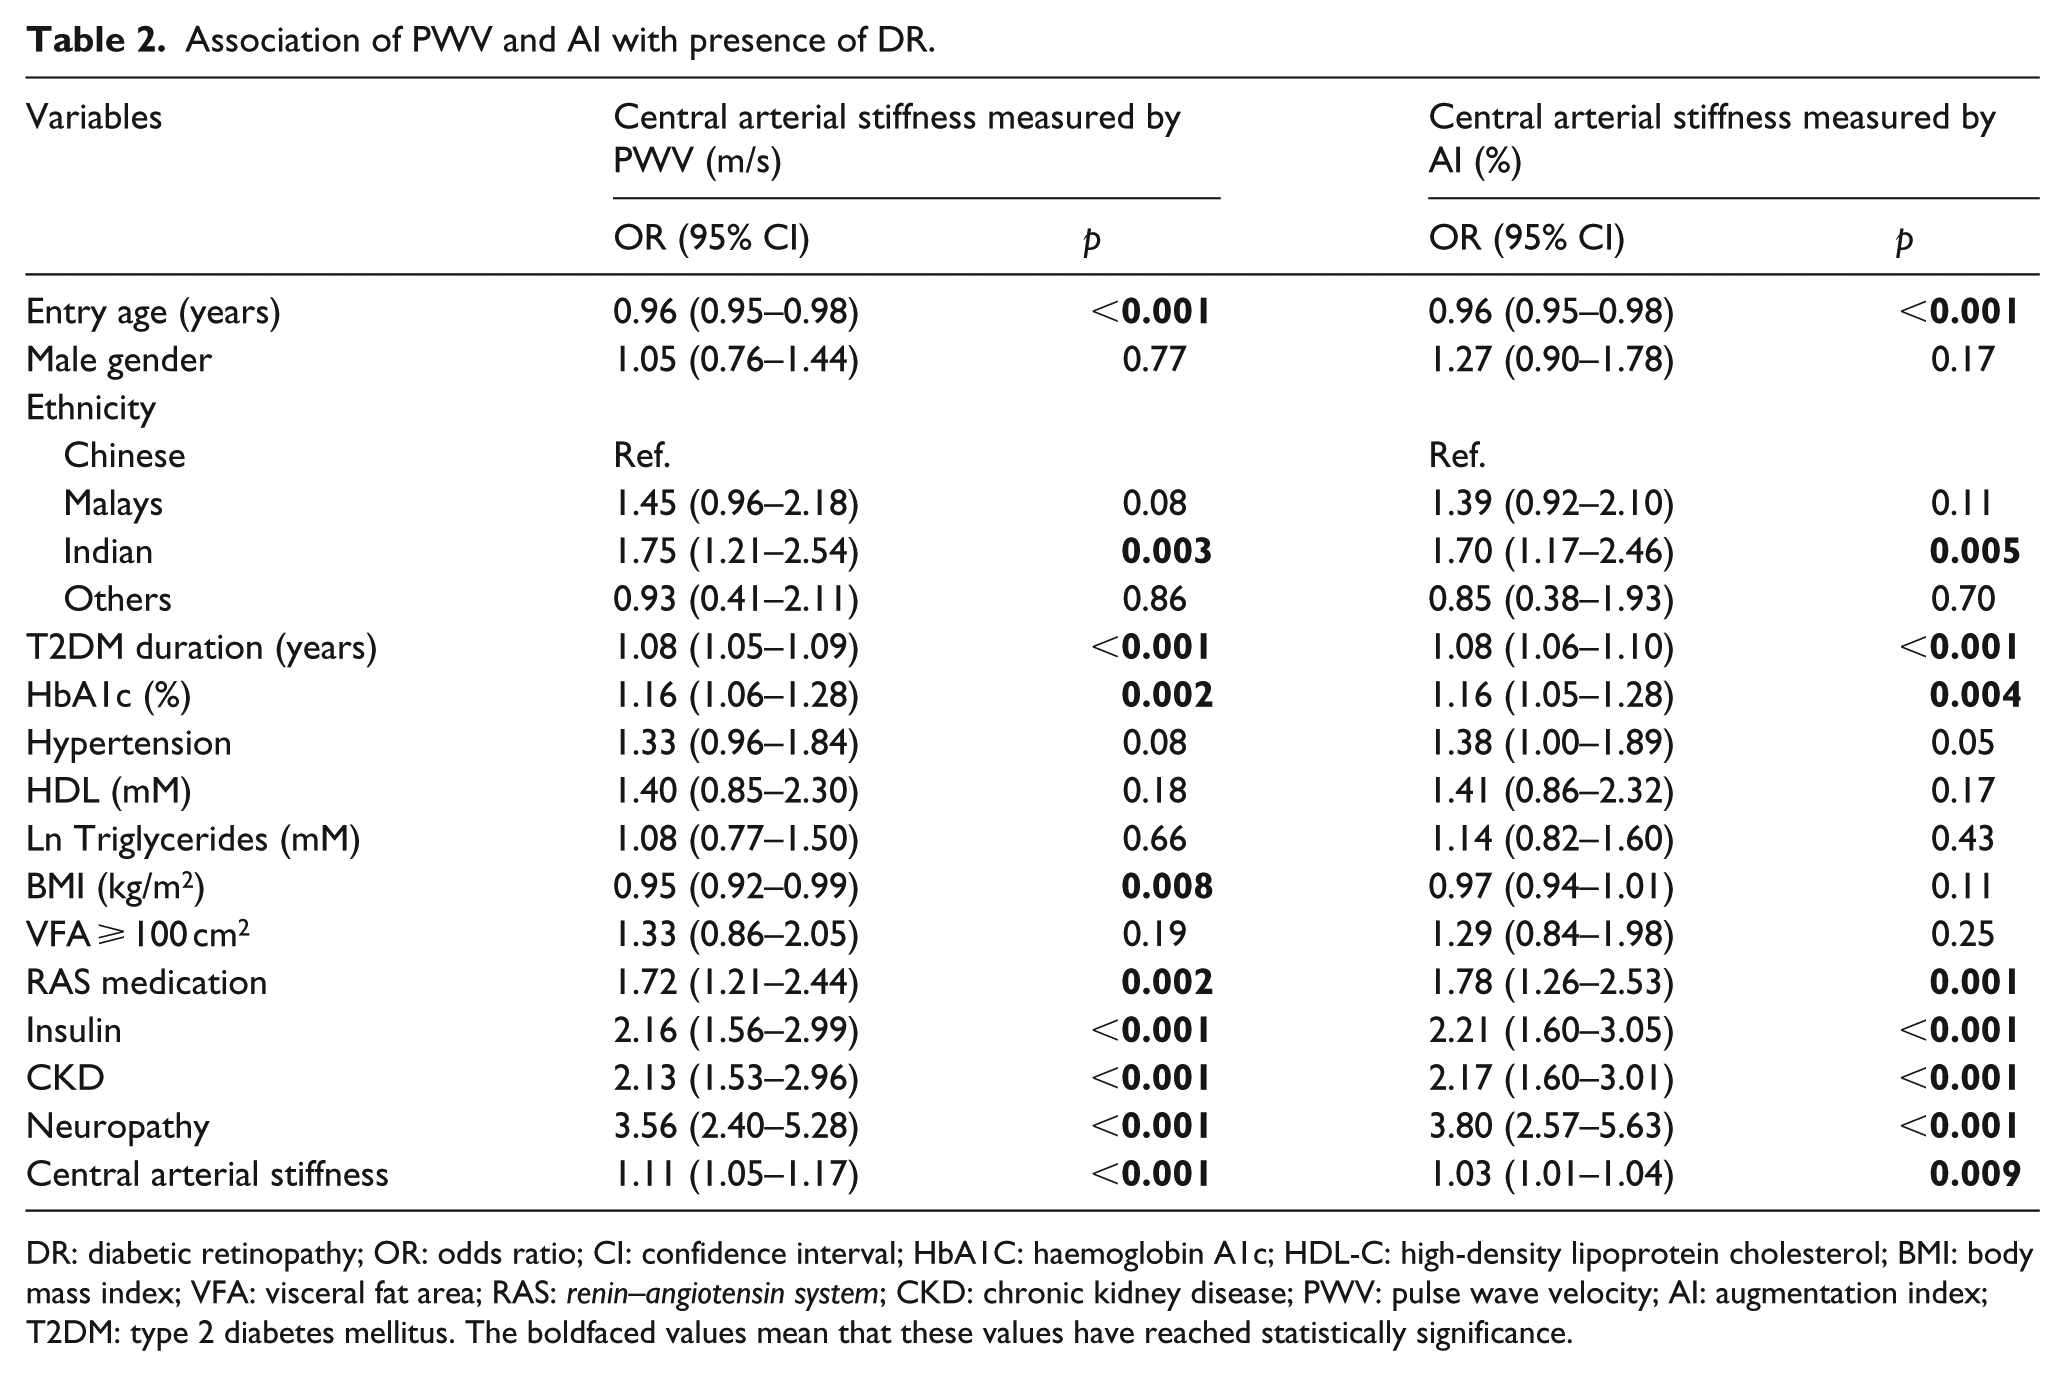
DR: diabetic retinopathy; OR: odds ratio; CI: confidence interval; HbA1C: haemoglobin A1c; HDL-C: high-density lipoprotein cholesterol; BMI: body mass index; VFA: visceral fat area; RAS: renin–angiotensin system; CKD: chronic kidney disease; PWV: pulse wave velocity; AI: augmentation index; T2DM: type 2 diabetes mellitus. The boldfaced values mean that these values have reached statistically significance.
We further analysed the associations of central arterial stiffness and DR in ethnicity-stratified analysis. In Chinese, compared with non-DR, DR have significantly higher PWV (11.6 ± 3.4 vs 9.6 ± 2.6 m/s, p < 0.001) and AI (29.2% ± 9.3% vs 26.2% ± 10.7%, p < 0.001). In Malays, there was significant difference in PWV (11.2 ± 3.1 vs 9.4 ± 2.8 m/s, p < 0.001), but not AI (27.1% ± 9.9% vs 25.2% ± 9.7%, p = 0.18) between DR and non-DR. In Indians, there was significant difference in PWV (10.8 ± 3.3 vs 9.4 ± 2.7 m/s, p < 0.001), but not AI (28.7% ± 9.3% vs 26.7% ± 10.9%, p = 0.12) between DR and non-DR (Supplemental Table S3). After adjustment for above mentioned variables, the associations of DR with PWV (OR = 1.12, 95% CI = 1.03–1.22, p = 0.006) and AI (OR = 1.03, 95% CI = 1.03–1.22, p = 0.006) remained statistically significant in Chinese. The associations of DR with PWV remained significant in Malays (OR = 1.19, 95%CI = 1.06–1.35, p = 0.004), and attenuated to non-significant level in Indians (OR = 1.01, 95% CI = 0.89–1.13, p = 0.92) (data not shown in tables).
Central arterial stiffness and the severity of DR
PWV was significantly higher in PDR (12.0 ± 3.2 m/s) than in NPDR patients (10.9 ± 3.3 m/s, p = 0.004). AI was higher in PDR (28.7% ± 9.2%) than in NPDR (28.3% ± 9.3%, p = 0.72), but the difference did not reach significant statistical level. Table 3 shows the association of PWV and AI with the severity of DR using multinomial logistic regression model. With one unit increase in PWV, the relative risk of having NPDR and PDR was 1.10 (95% CI = 1.03–1.17, p = 0.002) and 1.15 (95% CI = 1.06–1.25, p = 0.001) (p-trend < 0.001), respectively. AI was associated with NPDR (OR = 1.02, 95% CI = 1.01–1.04, p = 0.008), but not with PDR (OR = 1.01, 95% CI = 0.98–1.04, p = 0.36) (p-trend = 0.03).
Association of PWV and AI with the severity of DR.
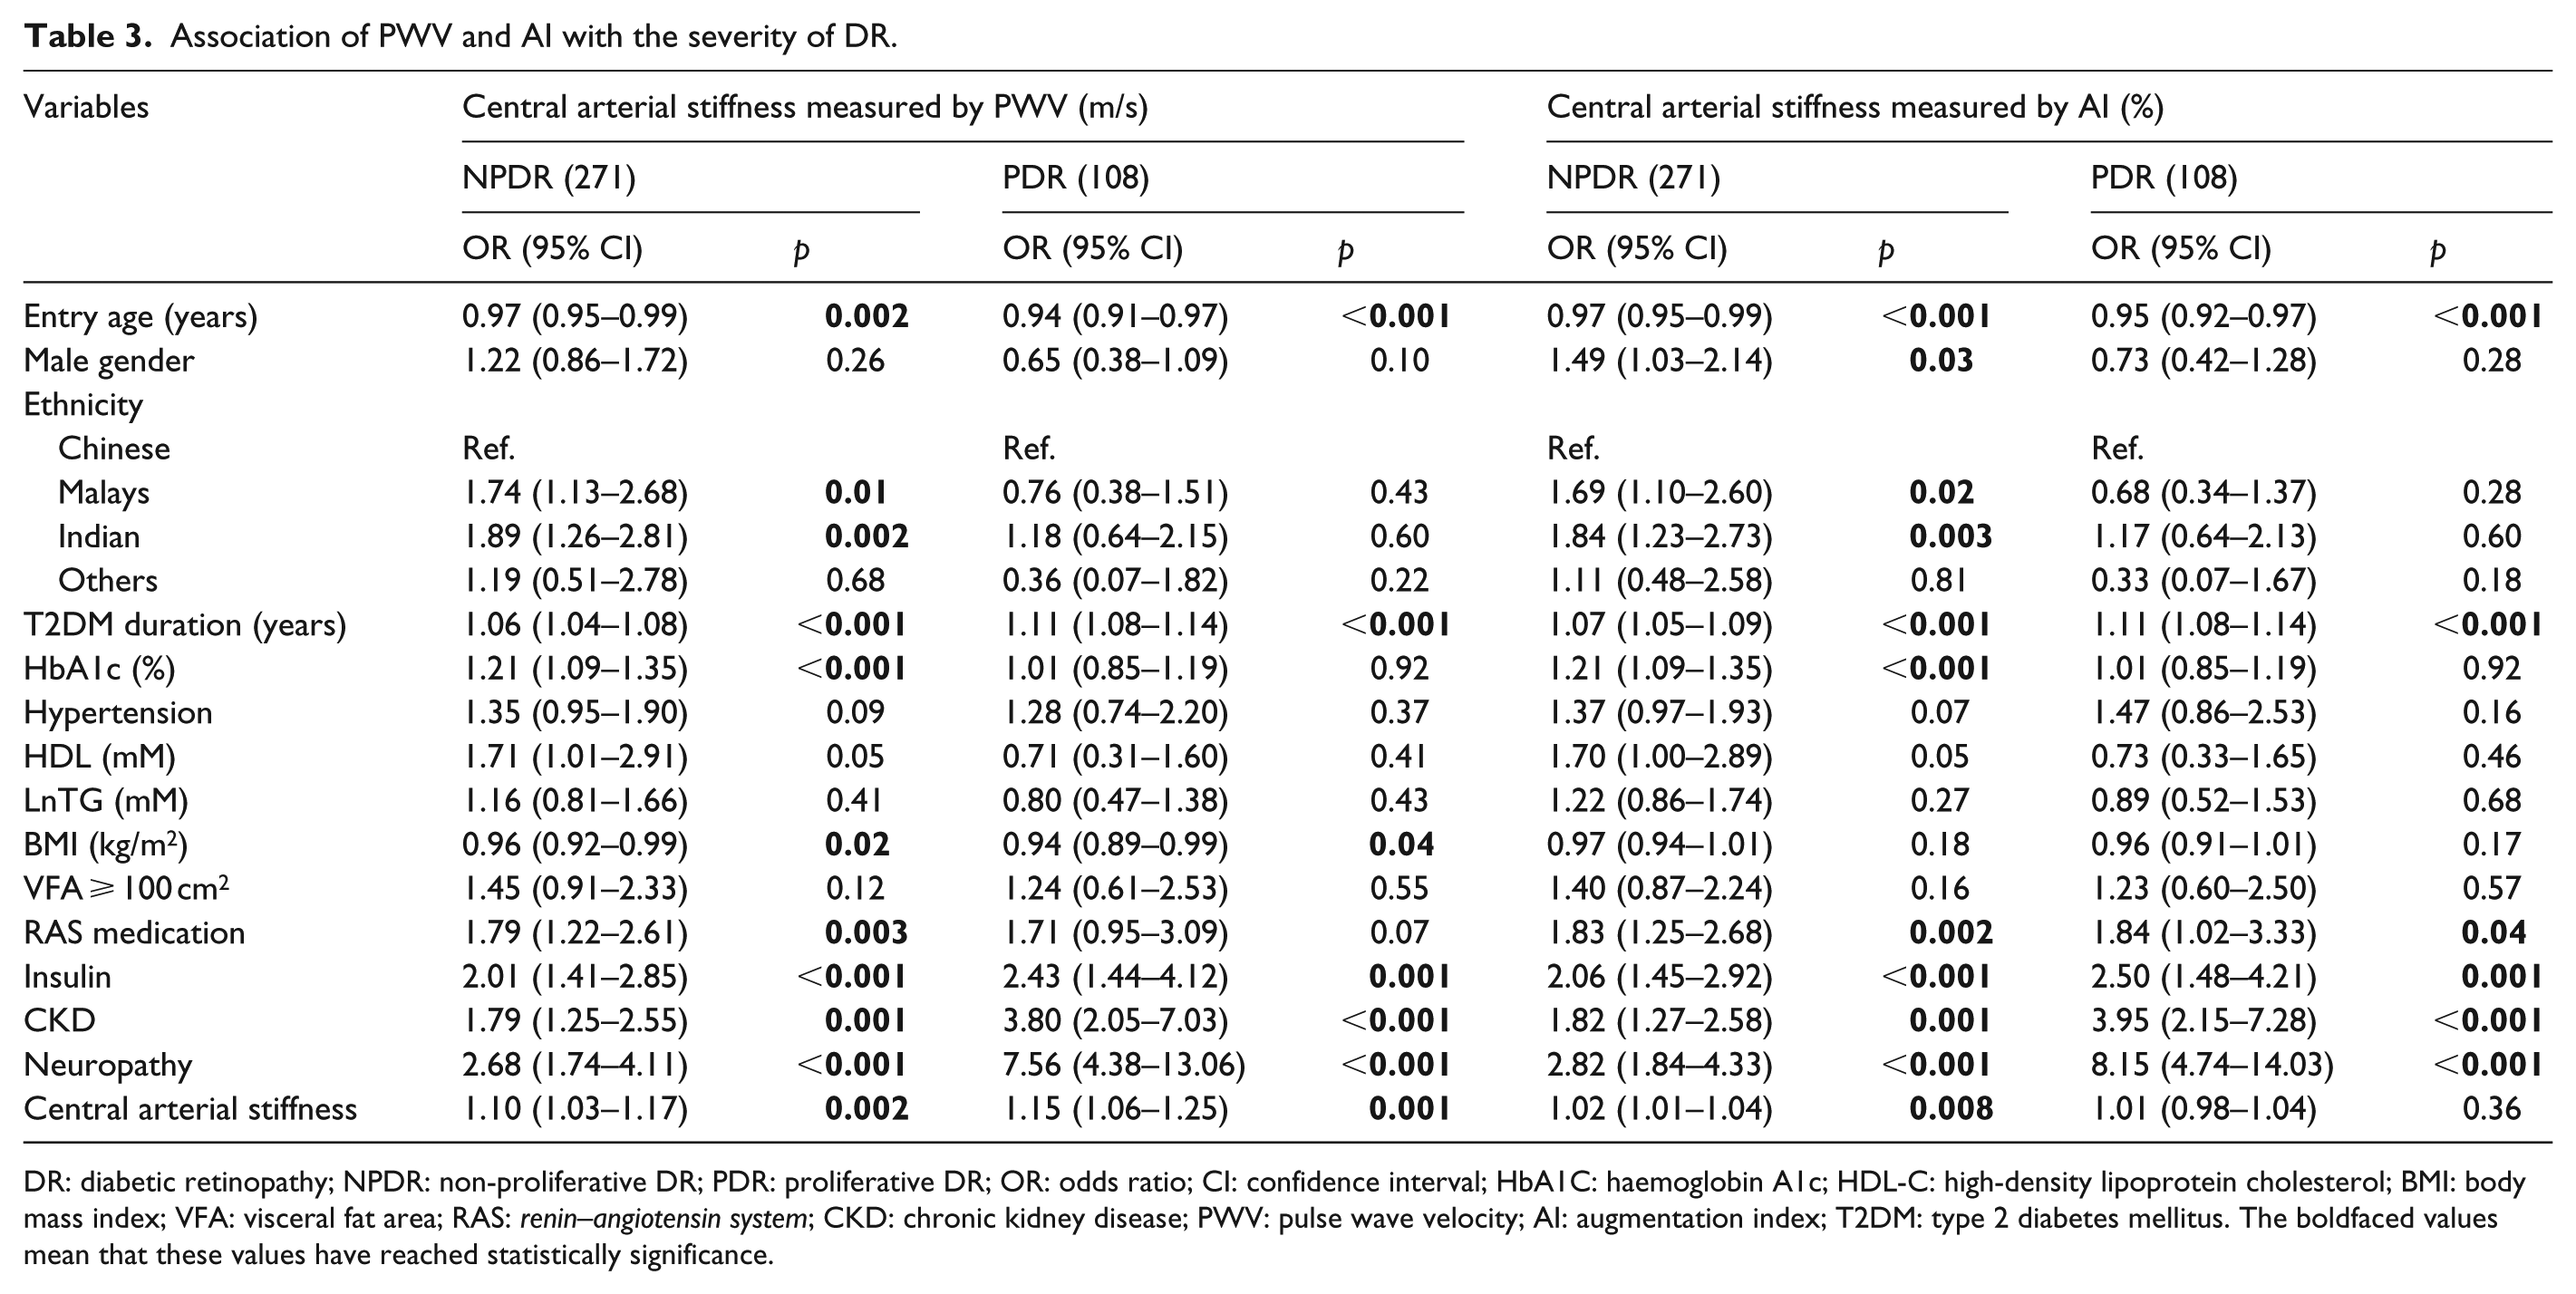
DR: diabetic retinopathy; NPDR: non-proliferative DR; PDR: proliferative DR; OR: odds ratio; CI: confidence interval; HbA1C: haemoglobin A1c; HDL-C: high-density lipoprotein cholesterol; BMI: body mass index; VFA: visceral fat area; RAS: renin–angiotensin system; CKD: chronic kidney disease; PWV: pulse wave velocity; AI: augmentation index; T2DM: type 2 diabetes mellitus. The boldfaced values mean that these values have reached statistically significance.
We then compared central arterial stiffness when NPDR was further categorized into mild (n = 165), moderate (n = 94) and severe NPDR (n = 12). We observed that PWV (Supplemental Figure S1A) and AI (Supplemental Figure S1B) increased with the increasing severity of NPDR; however, we did not observe statistically significant differences in PWV and AI among mild, moderate and severe NPDR patients.
Discussion
In this study, central arterial stiffness, measured using carotid-femoral PWV and AI, was positively associated with the presence of DR in T2DM patients. We further demonstrated that PWV is associated with both NPDR and PDR, while AI is associated with NPDR only. To the best of our knowledge, this is the first study to examine the relationship between central arterial stiffness and DR in a multi-ethnic Singaporean population with T2DM.
It remains controversial as to which segment provides PWV that might best reflect the presence of DR. However, PWV using central segment may be the most reliable index of regional arterial stiffness in DR.14,15 Furthermore, increased central arterial stiffness using carotid-femoral segment was associated with microvascular complications of T2DM, with DR demonstrating the strongest association. 15 A significant positive association of central PWV with presence of DR observed in our study fully supports the published data from the past studies demonstrating increased central arterial stiffness in subjects with DR. In addition, this is the first study to show a positive association of central PWV with respect to severity of DR. As expected, when DR was categorized with respect to severity in our study, NPDR was associated with markers of short-term glycemic control (HbA1c) and duration of diabetes, whereas PDR was associated with only duration of diabetes (Table 3).
Furthermore, our study demonstrated a significant association of central arterial stiffness using AI with presence of DR. To date, three studies have evaluated the association of AI with DR and two have shown positive association similar to our study,14,16 whereas the study by Ogawa et al. failed to show any association between AI and DR. 12 Our study along with other two studies showing positive association between AI and DR measured AI using SphygmoCor, whereas AI was measured using pulse wave analyzer (Omero) in the study by Ogawa et al., showing relatively lower AI levels. The lack of association may be attributable to differences in AI measuring techniques, relatively older age and exclusion of patients with macro-angiopathy. 12 However, in severity analysis, AI is associated with only NPDR but not PDR, possibly because of the limited sample size in PDR, as well as differential pathogenic-substrates of PWV and AI.
Past studies along with our study (r 2 = 0.142, p < 0.001) have found good correlation between PWV and AI, suggesting parallel changes between central arterial stiffness and wave reflection.24,25 Although both PWV and AI are markers of arterial stiffness, they may reflect different properties of the arterial tree and have shared and unshared pathogenic drivers, such as inflammation and oxidative stress. For instance, PWV increased while AI remained or decreased in healthy subjects and patients with rheumatoid arthritis. 26 We previously reported positive association of high-sensitivity C-reactive protein with AI but not with PWV in T2DM patients. 27 Similarly low total antioxidant capacity was associated with AI but not with PWV in hypertension patients. 28 Therefore, the differential pathogenic-substrates of PWV and AI may, at least partially, explain different findings of PDR with PWV and AI in our study.
In this multi-ethnic T2DM cohort, we performed an ethnicity-stratified analysis. We only observed significant associations of DR with PWV and AI in Chinese, and DR with PWV in Malays. We also compared central arterial stiffness when NPDR was further categorized into mild, moderate and severe NPDR. However, we did not observe significant difference in PWV and AI among these groups, possibly due to the limited sample size, especially in severe NPDR (n = 12). Further larger studies are needed to understand the impact of central arterial stiffness on DR of different severity and in different ethnic groups.
The underlying mechanisms linking central arterial stiffness and DR are not well understood, and several explanations have been raised. Large arteries conduct blood to peripheral arteries, buffer the pressure pulsations that are accompaniments of intermittent ventricular pumping and provide a reservoir pressure to maintain blood flow. 29 Increase in central arterial stiffness may result in loss of buffering function leading to transmission of a wider forward pulsatile pressure wave that may be potentially harmful to retinal microcirculation with consequential development of DR. 30 Alternatively, microvascular disease, such as DR, may cause large artery damage by an inward remodelling mechanism, where impaired vasodilation of small arteries may enhance backward pulse wave reflection and central pulse pressure that may damage walls of large arteries. 31 Or both, diabetic microvascular disease and increased central arterial stiffness may be linked by common pathogenic mechanisms, such as increased oxidative stress, chronic inflammation and endothelial dysfunction.15,31
Recently, DR has been suggested to be a risk factor for cardiovascular mortality in T2DM, and arterial stiffness could be the possible pathophysiological mechanism common among the two disease processes linking this association.32,33 Therefore, central arterial stiffness may be a marker for vascular damage caused by chronic hyperglycemia in diabetic patients. Given that arterial stiffness can be increased even in pre-diabetic populations with impaired glucose tolerance and in those with the metabolic syndromes before the onset of overt DM, 34 PWV and AI could be useful screening tools for early detection of vascular complications secondary to diabetes. Future studies should be aimed at interventions targeting arterial stiffness through life-style modification (i.e. smoking, salt intake) or pharmacotherapy for prevention and/or delay the progression of DR. Moreover, physicians should pay attention for latent macro-angiopathy in T2DM patients with increased arterial stiffness and DR, regardless of its severity.
The strength of our study includes the robust techniques to measure both PWV (the gold standard) and AI (the surrogate index) for assessment of arterial stiffness. Also, carotid-femoral PWV is widely considered as the most established index of arterial stiffness and one of the markers for target organ damage. 35 We also recognize several limitations of our study. First, our findings should be interpreted with caution because of small sample size for PDR, only type 2 diabetics and residual confounding effect from unmeasured variables, such as social economic status and dietary factor that may affect DR and/or arterial stiffness.36,37 Second, the cross-sectional design of our study precludes any causal-inference between central arterial stiffness and DR. Third, we did not exclude subjects with macrovascular complication because number of subjects with these complications did not vary significantly between DR and non-DR groups.
In summary, our results demonstrated that higher PWV and AI was associated with the presence of DR in T2DM patients. Furthermore, higher PWV was associated with the severity of DR. Our findings suggest that arterial stiffness may have an etiologic implication in DR. Therefore, amelioration of arterial stiffness may contribute to reduction in DR.
Supplemental Material
Fig.-S1A.DPI_300 – Supplemental material for Association of central arterial stiffness with the presence and severity of diabetic retinopathy in Asians with type 2 diabetes
Supplemental material, Fig.-S1A.DPI_300 for Association of central arterial stiffness with the presence and severity of diabetic retinopathy in Asians with type 2 diabetes by Xiao Zhang, Su Chi Lim, Subramaniam Tavintharan, Lee Ying Yeoh, Chee Fang Sum, Keven Ang, Darren Yeo, Serena Low and Neelam Kumari in Diabetes & Vascular Disease Research
Supplemental Material
Fig.-S1B.DPI_300 – Supplemental material for Association of central arterial stiffness with the presence and severity of diabetic retinopathy in Asians with type 2 diabetes
Supplemental material, Fig.-S1B.DPI_300 for Association of central arterial stiffness with the presence and severity of diabetic retinopathy in Asians with type 2 diabetes by Xiao Zhang, Su Chi Lim, Subramaniam Tavintharan, Lee Ying Yeoh, Chee Fang Sum, Keven Ang, Darren Yeo, Serena Low and Neelam Kumari in Diabetes & Vascular Disease Research
Supplemental Material
Supp_minor_revision – Supplemental material for Association of central arterial stiffness with the presence and severity of diabetic retinopathy in Asians with type 2 diabetes
Supplemental material, Supp_minor_revision for Association of central arterial stiffness with the presence and severity of diabetic retinopathy in Asians with type 2 diabetes by Xiao Zhang, Su Chi Lim, Subramaniam Tavintharan, Lee Ying Yeoh, Chee Fang Sum, Keven Ang, Darren Yeo, Serena Low and Neelam Kumari in Diabetes & Vascular Disease Research
Footnotes
Declaration of conflicting interests
The author(s) declared no potential conflicts of interest with respect to the research, authorship, and/or publication of this article.
Funding
The author(s) disclosed receipt of the following financial support for the research, authorship, and/or publication of this article: This work was supported by Singapore National Medical Research Council [grant PPG/AH(KTPH)/2011 and NMRC/CIRG/1398/2014]. The funder has no role in study design, data collection, analysis, interpretation and manuscript writing.
Supplemental material
Supplemental material for this article is available online.
References
Supplementary Material
Please find the following supplemental material available below.
For Open Access articles published under a Creative Commons License, all supplemental material carries the same license as the article it is associated with.
For non-Open Access articles published, all supplemental material carries a non-exclusive license, and permission requests for re-use of supplemental material or any part of supplemental material shall be sent directly to the copyright owner as specified in the copyright notice associated with the article.