
Abstract
Background
Insulin Resistance (IR) are associated with Hypertension (HTN). Triglyceride glucose-body mass index (TyG-BMI) is a readily available and clinically significant indicator of IR. This study aimed to investigate whether TyG-BMI is independently associated with HTN.
Methods
A total of 15,464 patients with normal blood glucose from 2004 to 2016 participated in this study. Participants were divided into four groups using the quartile method: TyG-BMI below 153.1, between 153.1 and 174.2, between 174.2 and 199.3, and over 199.3. The covariates included age, sex, BMI, WC, HDL-C, TC, TG, HbA1c, FPG, ALT, AST, GGT, SBP, DBP, smoking status, alcohol consumption, and exercise habits.
Results
The average age was 43.7 ± 8.9 years, and 45.4% were men. The prevalence of HTN was 6.2% (964/15464) of the population. TyG-BMI remained significantly associated with HTN after multivariate adjustment for TyG-BMI as a continuous variable (adjusted OR = 2.87, 95% CI: 1.90–4.34). Each 10-unit rise in TyG-BMI (continuous variable) was linked to a 31% increase in the prevalence of HTN (adjusted OR = 1.31, 95% CI: 1.25–1.37). In the subgroup analysis stratified by age, sex, waist circumference, and smoking status, the association between TyG-BMI and HTN were stable.
Conclusion
In this study, TyG-BMI was highly correlated with HTN, but more experiments and different populations are needed to verify this.
Introduction
HTN causes structural or functional changes in the arterial vascular system and/or its supply organs, including the brain, kidneys, central and peripheral arteries, and eyes, and is a crucial risk factor for cardiovascular morbidity and mortality. The disease has also become a significant economic burden due to the estimated 1.4 billion people worldwide who have HTN, only 14% of whom have their blood pressure under control. In recent years, the incidence of HTN has increased dramatically, leading to a marked increase in morbidity and mortality from hypertension-related diseases.1,2
Previous studies have shown that HTN is associated with other atherosclerotic risk factors, such as lipid abnormalities and IR, and that these factors can increase the prevalence of HTN.3,4 Lipid abnormalities usually include elevated TG, high TC, elevated LDL-C, and reduced HDL-C levels, which are independently associated with HTN.5–8 Lipid abnormalities primarily adversely affect the functional and structural properties of arteries and promote atherosclerosis. These changes may impair blood pressure regulation, which in turn predisposes individuals with dyslipidemia to HTN.9–11
IR is an important factor in the development of type 2 diabetes mellitus (T2DM) because it occurs when insulin is unable to improve cellular glucose absorption and utilization without causing compensatory hyperinsulinemia.12,13 IR is also a major mechanism for developing HTN in patients with DM; therefore, IR is the pivot between HTN and T2DM, leading to an interaction between HTN and T2DM and increased morbidity. 14 Indeed, IR contributes to elevated blood pressure in several ways, including enhanced tissue Ang II and aldosterone activity, enhanced sympathetic nervous system activity, and oxidative stress.15–18 Currently, the gold standard for IR detection is the hyperinsulinemic-euglycemic clamp technique proposed by Professor De Fronzo. However, this clamping technique is costly and has low epidemiological availability. Current relevant data suggest that a simple and clinically accessible IR score can be used as an alternative indicator.19,20
The HOMA-IR is commonly used to assess IR and has a strong correlation, but some studies have indicated that the TyG-BMI score is superior to other IR scores, including the HOMA-IR, in its ability to identify IR. 21 Additionally, several follow-up observational studies have found that TyG-BMI has good predictive performance in assessing HTN combined with hyperuricemia, MAFLD, and T2DM, in addition to having excellent discriminatory power in separating IR. TyG-BMI scores are still independently linked with HTN in some studies.22–25 However, there are relatively few studies on the relationship between TyG-BMI and HTN, and confirmation in a large population sample is still needed. Therefore, we aimed to investigate the association between TyG-BMI scores and HTN in normoglycemic Japanese patients, using a relevant database.
Methods
Study population
We conducted this study using data from the Gifu Area NAfld, population-based longitudinal analysis (NAGALA) database collected at Murakami Memorial Hospital in Japan, which was established in 1994. From 1994 to 2016, 20,944 people participated in a medical screening program.
26
Of these, 12,498 were men and 8446 were women. Patients with diabetes, viral hepatitis, alcoholic fatty liver at baseline examination, any medications used at baseline, HbA1c of 6.5% or higher, fasting glucose of 7 mmol/L or higher, and lack of covariate data resulted in a final study inclusion of 15,464 (Figure 1). All participants completed an informed consent form allowing the use of their physical examination data for the study. The study was approved by the Murakami Memorial Hospital Ethics Committee in Japan at the time of data collection. Flowchart of participant selection.
Data collection and definitions
Using a standardized self-management behavior questionnaire, patients recorded information about their lifestyle habits (including smoking, drinking, and physical activity habits). The aforementioned source article provides in-depth explanations of behavior (including smoking, drinking, and exercise habits), viral hepatitis, alcoholic fatty liver disease, and incident type 2 diabetes. 26 We only discuss the definitions from the list below, which we felt were most crucial. Each participant was asked how many grams of alcohol they had consumed each week in the previous month to divide the participants into the four groups of never-drinkers, light-drinkers, moderate-drinkers, and heavy drinkers. In addition, they split the individuals into three categories based on whether they had ever smoked, never smoked, or were now smokers. Exercise habits were described as exercising more frequently than once per week; according to JSH 2019 office blood pressure cutoffs for HTN, SBP 140 mmHg, and/or DBP 90 mmHg. 27
TyG-BMI calculation
TyG-BMI was calculated as follows: BMI = weight (kg)/height (m2); TyG index = Ln[1/2 fasting glucose (mg/dL) × fasting triglycerides (mg/dL)]; TyG-BMI = TyG index×BMI.
Statistical analysis
Baseline characteristics of the study participants according to TyG-BMI.
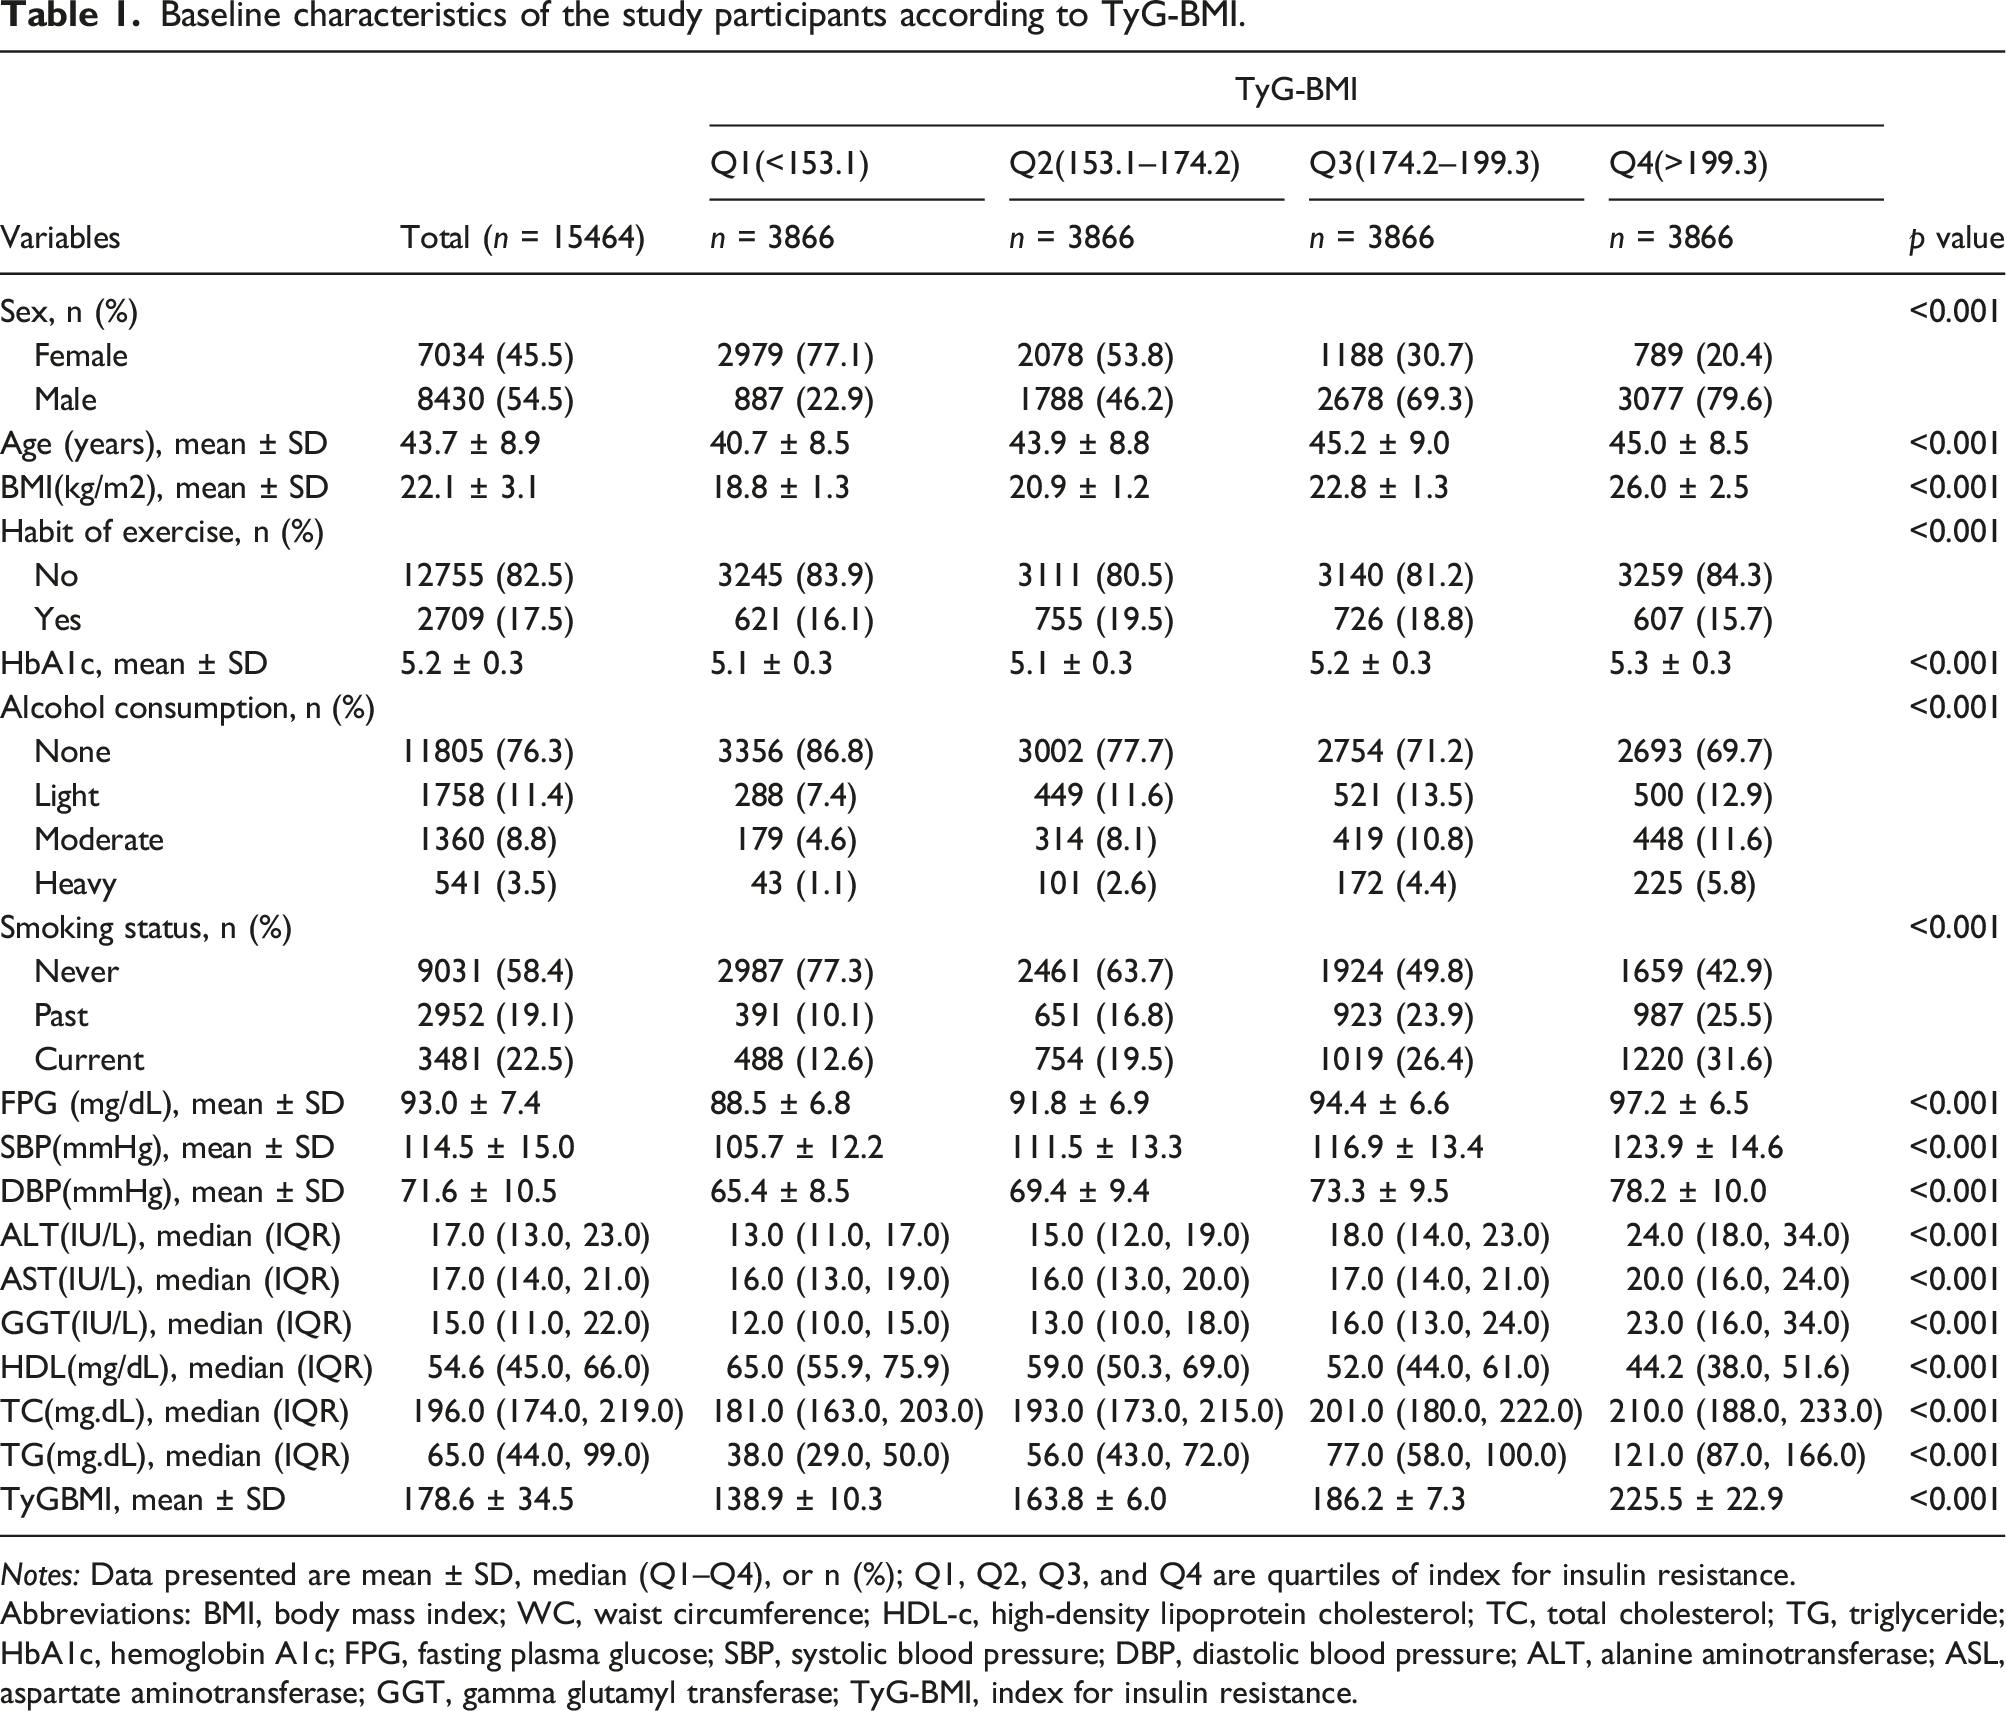
Notes: Data presented are mean ± SD, median (Q1–Q4), or n (%); Q1, Q2, Q3, and Q4 are quartiles of index for insulin resistance.
Abbreviations: BMI, body mass index; WC, waist circumference; HDL-c, high-density lipoprotein cholesterol; TC, total cholesterol; TG, triglyceride; HbA1c, hemoglobin A1c; FPG, fasting plasma glucose; SBP, systolic blood pressure; DBP, diastolic blood pressure; ALT, alanine aminotransferase; ASL, aspartate aminotransferase; GGT, gamma glutamyl transferase; TyG-BMI, index for insulin resistance.
Student’s t test was used to compare normally distributed continuous variables between groups. These variables are represented as mean standard deviation. Meanwhile, the Wilcoxon rank-sum test was used to compare non-normally distributed variables between the two groups, and the chi-square test was used to compare percentages for categorical data. To determine the significance of differences between groups stratified by quartiles of the TyG-BMI index, the Kruskal–Wallis test or one-way ANOVA was performed.
Univariate Logistic regression analysis between TyG-BMI and Hypertension.

Abbreviations: BMI, body mass index; WC, waist circumference; HDL-C, high-density lipoprotein cholesterol; TC, total cholesterol; TG, triglyceride; HbA1c, hemoglobin A1c; FPG, fasting plasma glucose; ALT, alanine aminotransferase; ASL, aspartate aminotransferase; GGT, gamma glutamyl transferase; TyG-BMI, score for insulin resistance.
Multivariable-adjusted ORs and 95% CI of the TyG-BMI quartiles associated with HTN.

Notes: Model 1 adjust for age and sex. Model 2 adjust for Model 1+ WC, Smoking status, Alcohol consumption. Model 3 adjust for Model 1+ Model 2+ ALT, AST, GGT, TC, TG.
Abbreviations: Ref, reference; TyG-BMI, score for insulin resistance; U, units; WC, waist circumference; ALT, alanine aminotransferase; ASL, aspartate aminotransferase; GGT, gamma glutamyl transferase.
A linear trend test was performed on each quadrant in Figure 2 using the median TyG-BMI index. In addition, we examined the linear relationship between TyG-BMI and HTN using curve fitting. We used stratified linear regression models and likelihood ratio tests for age (<65 or ≥65 years), sex (female or male), and WC (<90 cm in men, <80 cm in women, or ≥90 cm in men and ≥80 cm in women) in Figure 3 to identify changes and interactions. All statistical analyses were performed using R software, version 3.3.2(R Foundation for Statistical Computing) and Free Statistics software versions 1.7. Statistical significance was set at p < 0.05. Odds ratios (ORs) were adjusted for age (continuous), sex (male or female), waist circumference (<90 or ≥90 in Men and <80 (cm) ≥80 in Women), smoking status (never, past and current), alcohol consumption (none, light, moderate and heavy), total cholesterol (continuous) and triglyceride (continuous). Both p linearity, 0.001. Subgroup analyses of the TyG-BMI and HTN.Event (%),the number and prevalence of hypertension.

Results
The mean age of our cohort was 43.71 ± 8.90 years and the mean baseline TyG-BMI was 178.6 ± 34.5. The baseline variables were statistically significant between all four groups (p < 0.05) (Table 1). Age, BMI, WC, TC, TG, FPG, AST, ALT, GGT, SBP, and DBP were all favorably associated with TyG-BMI levels, whereas HDL-C was negatively correlated. Higher TyG-BMI was positively associated with women and adversely associated with men.
Age, sex, BMI, WC, smoking status, alcohol consumption, GGT, ALT, AST, HDL-C, TC, TG, HbA1c, FPG, and TyG-BMI were significantly associated with HTN in univariate logistic regression analysis (Table 2). The continuous variable, TyG-BMI, is presented in Table 2. There was a linear relationship between the TyG-BMI index and HTN (Figure 2). After adjusting for confounders, TyG-BMI was positively correlated with HTN in all three models (Table 3). Regardless of whether TyG-BMI was examined as a continuous variable or in quartiles, the ratio (OR) of TyG-BMI for HTN was consistently significant in all four models (OR range 1.72–2.87, p < 0.05).
TyG-BMI was assessed as a continuous variable, and the full-variance adjusted model’s adjusted OR for HTN was 1.31 (95% CI: 1.25–1.37) (Model 3). Each 10-unit increase in TyG-BMI was associated with a 31% increase in HTN prevalence. The adjusted ORs for HTN in the second, third, and fourth quartiles were 1.72 (95% CI: 1.19–2.47), 2.10 (95% CI: 1.45–3.03), and 2.87 (95% CI: 1.90–4.34), respectively, when TyG-BMI was examined as quartiles, as in Model 3. The modified model revealed that the risk of HTN increased with increasing TyG-BMI (p for trend<0.001), and statistical significance was seen in all models.
To evaluate the impact of TyG-BMI (per 10-unit increment) on HTN in the various subgroups, subgroup analyses were performed (Figure 3). For HTN, age (65 years vs. ≥65 years; P-interaction = 0.255), sex (female vs. male; P-interaction = 0.370), waist circumference (<90 cm in men, <80 cm in women vs. ≥90 cm in men, and ≥80 cm in women; P-interaction = 0.171), and smoking status (never, past, and current; P-interaction = 0.112). None of the above variables significantly changed the relationship between TyG-BMI and HTN. Although the p value for the interaction of alcohol intake was below 0.05, these results may not be significant considering the relatively small proportion of alcohol drinkers, especially heavy drinkers, in the general population.
Discussion
We believe that this is the first cross-sectional study in a Japanese population to describe the association between TyG-BMI and the risk of HTN in individuals with normal blood glucose levels after analyzing a sizable number of studies. After controlling for variables in the population-based cross-sectional analysis, the results showed that TyG-BMI was positively and linearly associated with HTN, both as a continuous and categorical variable, in Japanese normoglycemic participants.
Few studies have been conducted on TyG-BMI and HTN. In a study by Yaxin Li et al. TyG-BMI was independently associated with HTN, including adjustment for relevant covariates (including age, sex, smoking status, alcohol consumption, and TC), and the results remained stable. 28 Our study showed that after adjustment for various confounders, TyG-BMI was independently associated with HTN, which is consistent with previous studies. It also suggests that our results apply to other populations, but large-population studies are still needed.
Mechanisms linking TyG-BMI and HTN
Numerous studies have proposed potential ways through which IR may have an impact on raised blood pressure, even though the pertinent pathophysiological mechanisms causing the link between TyG-BMI and HTN remain unknown. Theoretically, IR contributes to metabolic syndrome and is a risk factor for high blood pressure. Additionally, IR compensatory hyperinsulinemia can result in excessive carotid body activation and heightened sympathetic nervous system activity. Both of these increase epinephrine and norepinephrine secretion and ultimately increase cardiac output and peripheral vascular resistance.29,30 High catecholamine concentrations can also thicken vascular smooth muscle and trigger HTN development. Furthermore, renin-angiotensin-aldosterone system activation and increased endothelin production are two additional ways through which IR might lead to HTN.31,32 Therefore, IR measurements are useful for monitoring the development of HTN.
Excess visceral adiposity has been linked in numerous studies to metabolic abnormalities that enhance the risk of IR and cardio metabolism, including HTN.33,34 Theoretically, the integration of TyG and obesity parameters (including WC, BMI, and WHtR) is more advantageous in reflecting IR, as obesity has been widely certified as one of the important factors contributing to IR. Lim et al. found that for IR prediction, TyG-BMI was superior to TyG, TyG-WC, and TyG-WHtR. 35 An increase in BMI increases the risk of HTN. Furthermore, studies have demonstrated that a higher BMI is a risk factor for HTN. 36 BMI is also a recognized predictor of HTN, which affects blood pressure through various processes, including IR. Huang et al. also showed that a slight increase in BMI at 18 years, even within the normal range, was positively associated with future HTN. 37 In addition, the prevalence of HTN can increase in patients with obesity. However, HTN can be significantly alleviated by aggressive weight loss.38,39
Currently, there are relatively few predictive tools for HTN, leading to people not knowing their risk of developing HTN, and thus not being able to manage it well. 40 Although the current gold standard for IR testing is the hyperinsulinemic-euglycemic clamp technique, this method is difficult to apply in large epidemiological studies; therefore, the use of indirect IR scores can be applied in large epidemiological studies. However, for less-developed areas, IR scores based on insulin assays, such as HOMA-IR, are difficult to obtain. 41 In contrast, TyG-BMI is not only easy to obtain from the calculated data but can also be used in both developed and underdeveloped regions.
The role of TyG-BMI on HTN
The prevalence of HTN in the Japanese population remains high, and according to 2016 statistics, more than 60% of men with HTN were ≥50 years old. 42 Globally, an estimated 1.39 billion (1.34–1.44 billion) people had HTN in 2010: 349 million (337–361 million) in high-income countries, and 1.04 billion (990–1.09 billion) in low- and middle-income countries. From 2000 to 2010, the age-standardized prevalence of HTN decreased by 2.6% in high-income countries but increased by 7.7% in low- and middle-income countries. 43 Therefore, early identification of individuals at high risk of developing HTN is important to identify hypertensive people early, enhance the management of HTN, and reduce the associated cardiovascular and cerebrovascular diseases due to HTN, especially in low- and middle-income countries.
Limitations
Although this study is the first to examine TyG-BMI and HTN in a Japanese population, it also has limitations. First, this was a cross-sectional study, which limited our inference of causality. Second, the study population was Japanese, so it is unclear whether it is relevant to other ethnic populations. Third, because this study was based on a secondary analysis of data from previously published studies, the exact process of obtaining certain data, such as the method of measuring blood pressure, is unclear. Fourth, we could not directly measure IR and compare it with IR scores for consistency with HTN.
Conclusion
Overall, our study demonstrated that TyG-BMI was independently and consistently correlated with HTN prevalence in the Japanese population. Our findings support the hypothesis that TyG-BMI has a predictive role in preventing the onset of HTN, lowering the risk of developing HTN by improving our BMI profile, and serving as a surveillance signal for HTN primary education and prevention measures in the future.
Footnotes
Acknowledgements
1. We are grateful to Dr. Jie Liu of the Department of Vascular and Endovascular Surgery, Chinese PLA General Hospital for his contribution to the statistical support, the study designed consultations, and comments regarding the manuscript.
2. We would like to express our gratitude to all members of the cohort study, including the study sponsors, data collection managers, staff of the Murakami Memorial Hospital Medical Examination Center, and all participants.
3. The authors thank all the staff members in our institution.
Author contributions
XH contributed to the study design and drafted the first draft. XH organized the database and responded to the editor and reviewers. XH performed the statistical analysis and participated in the critical modification of important knowledge contents. ZP, BY, and XY initiated and helped design the study. JH and GW ensured the accuracy or completeness of all questions in the study. All authors contributed to the article and approved the submitted version.
Declaration of conflicting interests
The author(s) declared no potential conflicts of interest with respect to the research, authorship, and/or publication of this article.
Funding
The author(s) received no financial support for the research, authorship, and/or publication of this article.
Ethical approval
Studies involving human participants were reviewed and approved by the Murakami Memorial Hospital Ethics Committee, and the patients provided written informed consent to participate in this study.
Informed consent
Written informed consent for publication was obtained from all participants.