
Abstract
Objective
This study aimed to evaluate the correlations between the triglyceride glucose–body mass index, the bedside index for severity in acute pancreatitis score, and the C-reactive protein-to-lymphocyte ratio with disease severity, as well as their prognostic value, in patients with hyperlipidemic acute pancreatitis.
Methods
This retrospective cohort study analyzed 247 patients diagnosed with hyperlipidemic acute pancreatitis. Participants were stratified according to the 2012 Atlanta criteria into mild (n = 108), moderately severe (n = 71), and severe (n = 68) groups. Based on 28-day outcomes, patients were categorized into poor prognosis (n = 90) and good prognosis (n = 157) groups. We compared baseline data and performed Spearman correlation analysis, Cox univariate/multivariate regression, and receiver operating characteristic analysis.
Results
The triglyceride glucose–body mass index, bedside index for severity in acute pancreatitis, and C-reactive protein-to-lymphocyte ratio significantly increased with disease severity (p < 0.05) and demonstrated strong positive correlations (p < 0.01). Multivariate Cox regression identified triglyceride glucose–body mass index (hazard ratios = 1.62, 95% confidence intervals: 1.33–1.97), bedside index for severity in acute pancreatitis (hazard ratios = 1.92, 95% confidence intervals: 1.43–2.57), and C-reactive protein-to-lymphocyte ratio (hazard ratios = 2.05, 95% confidence intervals: 1.62–2.60) as independent predictors of poor prognosis. The combination of all three markers yielded the highest predictive accuracy (area under the curve = 0.987) for predicting 28-day poor prognosis, a finding that was robust on internal validation.
Conclusions
The triglyceride glucose–body mass index, bedside index for severity in acute pancreatitis score, and C-reactive protein-to-lymphocyte ratio are valuable tools for assessing disease severity and predicting prognosis in hyperlipidemic acute pancreatitis. Their combined use may potentially enhance early risk stratification and guide clinical decision-making.
Keywords
Introduction
Hyperlipidemic acute pancreatitis (HLAP) is a severe inflammatory condition of the pancreas primarily driven by elevated serum triglyceride levels (TG ≥11.3 mmol/L) and accounts for 10%–20% of acute pancreatitis cases globally, with significant morbidity and mortality resulting from complications such as organ failure and pancreatic necrosis.1,2 The pathogenesis of HLAP involves lipotoxicity from excessive free fatty acids (FFAs), systemic inflammatory responses, and microcirculatory disturbances, all of which collectively contribute to its aggressive clinical course. 3 Despite advancements in diagnostic frameworks, such as the 2012 Atlanta classification, early risk stratification and prognostic prediction in HLAP remain challenging. Conventional severity scoring systems, including the bedside index for severity in acute pancreatitis (BISAP), lack specificity for HLAP, while traditional biomarkers like C-reactive protein (CRP) often exhibit delayed elevation, limiting their utility in acute clinical decision-making.4,5
Emerging evidence underscores a critical interplay between metabolic dysregulation and inflammation in the progression of HLAP. The triglyceride glucose–body mass index (TyG–BMI), a composite marker integrating insulin resistance and lipid metabolism, has demonstrated prognostic value in cardiovascular and metabolic disorders. 6 Similarly, the CRP-to-lymphocyte (Lym) ratio (CLR), reflecting systemic inflammation and immune imbalance, has emerged as a promising predictor in sepsis and malignancies. 7 However, the roles of these novel markers in HLAP—a condition characterized by unique metabolic–inflammatory crosstalk—remain underexplored. Current studies predominantly focus on isolated lipid parameters, such as TG, total cholesterol (TC), or generic severity scores, neglecting the potential synergies of multidimensional biomarkers in capturing HLAP’s heterogeneous pathophysiology. 8
This study aims to address this gap by investigating the correlations of the TyG–BMI index, BISAP score, and CLR with HLAP severity, as well as their combined prognostic utility. By analyzing a cohort of 247 patients with HLAP stratified according to the 2012 Atlanta criteria, we evaluated whether these markers enhance early risk stratification and improve prediction of 28-day adverse outcomes, including disease recurrence, organ failure, and pancreatic necrosis. Our findings seek to refine personalized management strategies for patients with HLAP, offering clinicians a robust toolkit to optimize therapeutic interventions and mitigate complications.
Materials and methods
Study design and population
This was a single-center, retrospective cohort study that consecutively included 247 patients diagnosed with HLAP who were admitted to our hospital between June 2018 and April 2024. This study was reported in accordance with the Strengthening the Reporting of Observational Studies in Epidemiology (STROBE) guidelines. 9 The study protocol was approved by the Institutional Ethics Committee of Beijing Geriatric Hospital (Approval No.: BJLNYY-2025-005). All procedures performed in studies involving human participants were in accordance with the ethical standards of the institutional and/or national research committee and the 1964 Helsinki Declaration and its later amendments or comparable ethical standards. The requirement for individual patient consent was waived by the ethics committee due to the retrospective nature of the study. This waiver was issued on 16 May 2025.
Patients were enrolled on the basis of the following criteria: (a) diagnosis of HLAP according to the 2012 revised Atlanta classification criteria for acute pancreatitis, 1 (b) serum TG levels ≥11.3 mmol/L or TG levels between 5.65 and 11.3 mmol/L with chylous serum appearance, (c) age ≥18 years, (d) time from symptom onset to hospital admission <24 h, and (e) availability of complete clinical, laboratory, and imaging data. Patients were excluded if they met any of the following conditions: (a) acute pancreatitis (AP) caused by biliary, alcoholic, drug-induced, or pregnancy-related etiologies; (b) chronic pancreatitis with acute exacerbation; (c) comorbid malignancies, severe cardiac, hepatic, or renal dysfunction, or autoimmune diseases; and (d) pregnancy or lactation. The patient selection process is summarized in a STROBE flow diagram (Figure S1).
Group stratification
Based on the 2012 Atlanta criteria, patients were stratified into three severity groups: mild HLAP (n = 108)—no organ failure and absence of local or systemic complications. Moderately severe HLAP (n = 71)—transient organ failure (resolving within 48 h) or presence of local/systemic complications (e.g. pseudocyst and necrosis). Severe HLAP (n = 68)—persistent organ failure lasting >48 h. Additionally, patients were categorized into a poor prognosis group (n = 90) and a good prognosis group (n = 157) based on 28-day outcomes. Poor prognosis was defined as a composite of disease recurrence (n = 15), organ failure (n = 45), or pancreatic necrosis (n = 30). The composite endpoint of poor prognosis was defined as the occurrence of disease recurrence, persistent organ failure, or pancreatic necrosis within 28 days of admission. These outcomes were selected as they are the key determinants of severe disease according to the 2012 Atlanta classification and represent the most clinically relevant adverse events in HLAP, capturing its significant morbidity and mortality burden.
Data collection
To ensure patient confidentiality and privacy, all patient data were fully deidentified prior to analysis. All identifiers, including but not limited to names, hospital identification numbers, admission dates, and specific contact information, were removed from the dataset. Each patient was assigned a unique study code for the purpose of data linkage and analysis. The following demographic and clinical data were systematically recorded: (a) baseline characteristics, such as sex, age, BMI, smoking history, and systolic and diastolic blood pressure (SBP/DBP); (b) laboratory parameters, such as fasting plasma glucose (FPG), TC, TG, low-density lipoprotein cholesterol (LDL-C), high-density lipoprotein cholesterol (HDL-C), CRP, and Lym count; (c) the TyG–BMI index was calculated using the following formula: 10 TyG–BMI = Ln [Fasting TG (mg/dL) × FPG (mg/dL)/2] ×BMI (kg/m2). Note: To ensure unit consistency for the logarithmic operation, TG and FPG values in mmol/L were converted to mg/dL using standard conversion factors (TG: mmol/L × 88.57 = mg/dL; FPG: mmol/L × 18.02 = mg/dL) prior to calculation. CRP levels and peripheral blood lymp were measured using automated blood analysis equipment. CLR was calculated by dividing the CRP level (mg/L) by the Lym (109/L). 11
Consideration of confounding treatments
To address potential confounding effects of medications on study outcomes, we reviewed the medication records of all enrolled patients. Specifically, we assessed the use of anti-inflammatory drugs (including nonsteroidal anti-inflammatory drugs and corticosteroids) and lipid-lowering agents (such as statins and fibrates) prior to or during hospitalization. Patients who received systemic corticosteroids or initiated lipid-lowering therapy within 24 h of admission were excluded from the analysis to minimize the impact of these treatments on the initial laboratory values and severity assessment. The use of other supportive care medications (e.g. analgesics and intravenous fluids) was standardized according to institutional protocols and was not considered a significant confounder for the biomarkers under investigation.
Treatment protocol
All patients diagnosed with HLAP received standardized management according to institutional guidelines based on international recommendations. 12 Supportive care, including aggressive intravenous fluid resuscitation, analgesic administration, and enteral nutritional support (preferentially nasojejunal), was initiated for all patients at admission.
Specific therapies targeting hypertriglyceridemia and its complications were administered as follows: (a) insulin and heparin therapy—an intravenous insulin infusion (with or without concurrent unfractionated heparin) was employed as the first-line therapy to lower serum TG levels in the majority of patients; (b) plasmapheresis—therapeutic plasma exchange was reserved for patients with severe HLAP presenting with persistent organ failure (e.g. respiratory or renal failure) lasting more than 48 h or for those who showed an inadequate response to initial insulin/heparin therapy; and (c) antibiotics—prophylactic antibiotics were not routinely used. Therapeutic antibiotics were administered only in cases with confirmed or strong clinical suspicion of infected pancreatic necrosis or extrapancreatic infections and were guided by microbiological culture results.
Crucially, to ensure reproducibility, the laboratory parameters used to calculate the TyG–BMI index and CLR, as well as the clinical data for the BISAP score, were collected at the time of hospital admission and always prior to the initiation of any specific lipid-lowering interventions (such as plasmapheresis). This ensured that all baseline assessments reflected the patient’s status at presentation, unaffected by subsequent therapies. This approach was adopted to ensure that the analysis of baseline biomarkers reflected initial disease severity and inherent patient risk, independent of subsequent therapeutic modifications. All treatment decisions were made according to standardized institutional protocol, minimizing variation in care that could confound the association between baseline biomarkers and prognosis.
Statistical analysis
Data were analyzed using the statistical software package SPSS, version 25.0 (IBM Corp., USA). Only cases with complete data for all analyzed variables were included; no imputation of missing data was performed. Continuous variables were expressed as mean ± standard deviation (SD) or median (interquartile range) and were compared using analysis of variance or Kruskal–Wallis tests. Categorical variables were reported as frequencies (%) and analyzed using chi-square or Fisher’s exact tests. Spearman’s correlation coefficient (r) was used to assess associations between TyG–BMI, BISAP, CLR, and disease severity. Cox proportional hazards regression was used to analyze the time from hospital admission to the first occurrence of the composite poor-prognosis endpoint within the 28-day observation period. Patients who did not experience an event were censored at 28 days.
Prognostic factors were identified using univariate and multivariate Cox proportional hazards regression, with the results reported as hazard ratios (HR) and 95% confidence intervals (CIs). Prior to performing the multivariate Cox regression, multicollinearity among predictor variables was assessed using the variance inflation factor (VIF). A VIF value greater than 5 was considered indicative of substantial multicollinearity. Multivariate Cox regression analysis was performed, adjusting for variables that were significant in univariate analyses (p < 0.05) and clinically relevant, including FPG, TC, TG, LDL-C, TyG–BMI, BISAP, CRP, and CLR.
Receiver operating characteristic (ROC) curves were used to evaluate the predictive accuracy of individual and combined markers. To assess the potential for overfitting and the robustness of the predictive models, internal validation was performed using bootstrap resampling with 1000 iterations. The optimism-corrected area under the curve (AUC) was calculated for the key biomarker CLR. Kaplan–Meier survival curves were plotted to visualize the probability of survival free from poor prognosis over the 28-day period. Patients were stratified based on the optimal cutoff value of CLR, and group differences were compared using the log-rank test. A two-tailed p value <0.05 was considered statistically significant.
Results
Comparison of baseline characteristics among three HLAP groups
The baseline characteristics of 247 patients with HLAP stratified into mild (n = 108), moderately severe (n = 71), and severe (n = 68) groups are summarized in Table 1. No significant differences were observed across the three groups in sex distribution, BMI, age, comorbidities (hypertension, diabetes, fatty liver, and smoking history), blood pressure (SBP and DBP), or white blood cell count (WBC) (all p > 0.05). Similarly, Lym showed no significant variation among groups (p > 0.05). In contrast, significant differences were identified (all p < 0.05) in the following markers, FPG, lipid profiles (TC, TG, and LDL-C), composite indices (TyG–BMI index and BISAP score), and inflammatory markers (CRP and CLR). These parameters increased progressively with disease severity. Notably, HDL-C levels decreased progressively across the severity groups (p < 0.05). These findings suggest that TyG–BMI, BISAP, and CLR are robust indicators for stratifying HLAP severity and predicting clinical outcomes. Detailed results are presented in Table 1.
Comparison of baseline characteristics among these three HLAP groups.

BISAP: bedside index for severity in acute pancreatitis; BMI: body mass index; CLR: C-reactive protein-to-lymphocyte ratio; DBP: diastolic blood pressure; FPG: fasting plasma glucose; HDL-C: high-density lipoprotein cholesterol; HLAP: hyperlipidemic acute pancreatitis; LDL-C: low-density lipoprotein cholesterol; SBP: systolic blood pressure; TC: total cholesterol; TyG–BMI: triglyceride glucose–body mass index; WBC: white blood cell count.
Correlation of TyG–BMI index, BISAP score, and CLR with HLAP severity
Spearman’s correlation analysis revealed significant positive associations between HLAP severity and three key markers: TyG–BMI index, BISAP score, and CLR (all p <0.01). The correlation coefficients (r) and corresponding p values are summarized in Table 2.
Spearman’s correlation analysis of TyG–BMI index, BISAP score, and CLR with HLAP severity.
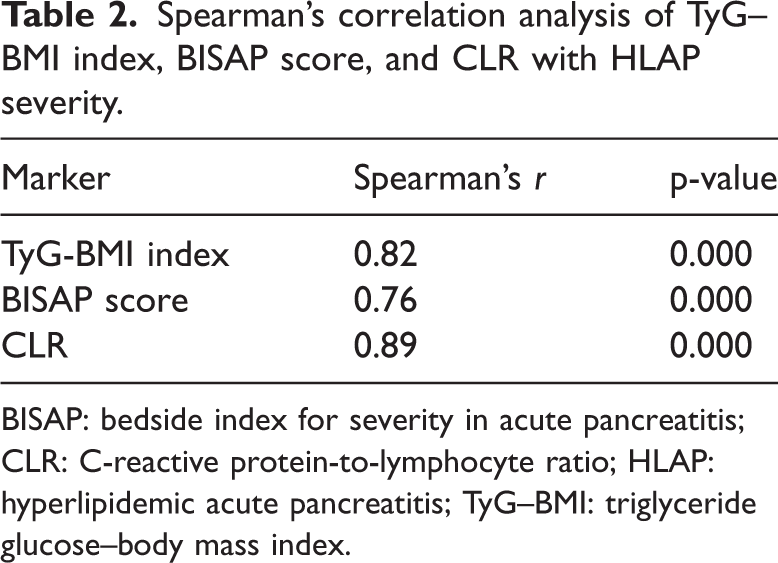
BISAP: bedside index for severity in acute pancreatitis; CLR: C-reactive protein-to-lymphocyte ratio; HLAP: hyperlipidemic acute pancreatitis; TyG–BMI: triglyceride glucose–body mass index.
Univariate Cox regression analysis of prognostic factors in patients with HLAP
Among 247 patients with HLAP, 90 (36.4%) experienced poor prognosis within 28 days of admission, including 15 deaths, 45 cases of organ failure, and 30 cases of pancreatic necrosis. Univariate Cox regression analysis identified FPG, TC, TG, LDL-C, the TyG–BMI index, BISAP score, CRP, and CLR as significant predictors of poor prognosis (p < 0.05). In contrast, sex, BMI, age, comorbidities (hypertension, diabetes, fatty liver, and smoking), blood pressure, white WBC, platelet count (PLT), and liver enzymes (aspartate aminotransferase (AST) and alanine aminotransferase (ALT)) showed no statistical association with adverse outcomes (p >0.05). Detailed results are presented in Table 3.
Univariate Cox regression analysis of prognostic factors in HLAP patients.

BISAP: bedside index for severity in acute pancreatitis; BMI: body mass index; CLR: C-reactive protein-to-lymphocyte ratio; CRP: C-reactive protein; DBP: diastolic blood pressure; FPG: fasting plasma glucose; HDL-C: high-density lipoprotein cholesterol; HLAP: hyperlipidemic acute pancreatitis; LDL-C: low-density lipoprotein cholesterol; Lym: lymphocyte; SBP: systolic blood pressure; TC: total cholesterol; TG: triglyceride; TyG–BMI: triglyceride glucose–body mass index; WBC: white blood cell count; PLT: platelet count; ALT: alanine aminotransferase; AST: aspartate aminotransferase.
Multivariate Cox regression analysis of prognostic factors in patients with HLAP
Collinearity diagnostics revealed substantial multicollinearity among several variables, including TG, TC, and CRP (VIFs > 5; see Table S1 for full details), which likely explains their loss of statistical significance in the multivariate model despite being significant in univariate analyses. Multivariate Cox regression analysis, adjusted for confounding variables, confirmed that the TyG–BMI index, BISAP score, and CLR were independent predictors of poor prognosis in patients with HLAP (p <0.05). Other variables, including FPG, TC, TG, LDL-C, HDL-C, and CRP, lost statistical significance in the multivariate model, likely due to collinearity or mediation effects. The results are detailed in Tables 4 and 5.
Variable assignment in Cox regression analysis.
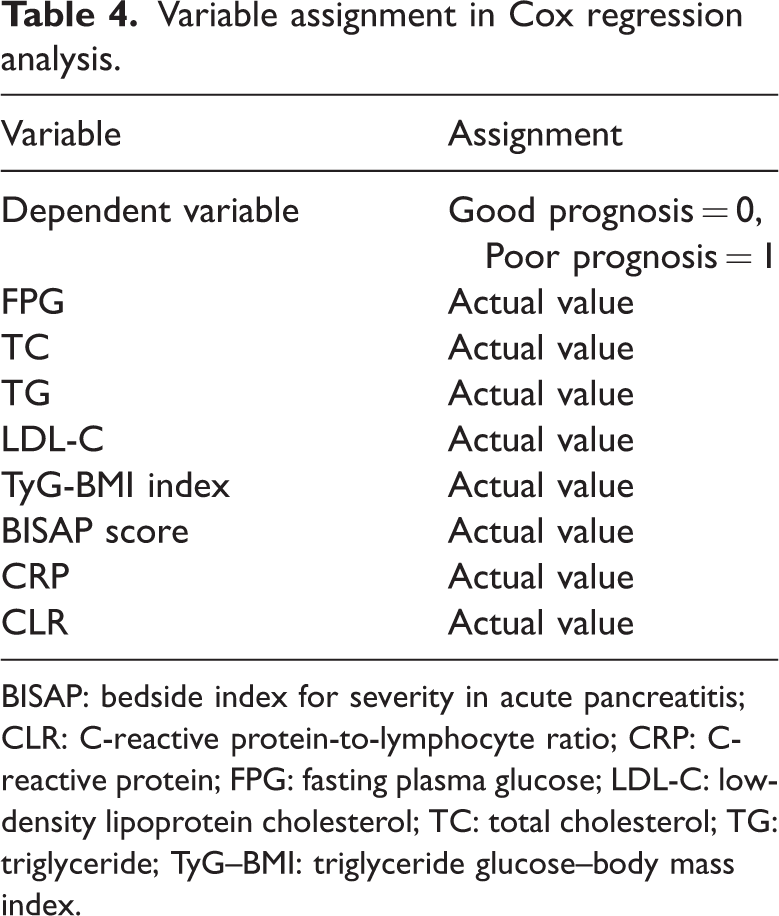
BISAP: bedside index for severity in acute pancreatitis; CLR: C-reactive protein-to-lymphocyte ratio; CRP: C-reactive protein; FPG: fasting plasma glucose; LDL-C: low-density lipoprotein cholesterol; TC: total cholesterol; TG: triglyceride; TyG–BMI: triglyceride glucose–body mass index.
Multivariate Cox regression analysis of prognostic factors in HLAP patients.

BISAP: bedside index for severity in acute pancreatitis; CI: confidence interval; CLR: C-reactive protein-to-lymphocyte ratio; CRP: C-reactive protein; FPG: fasting plasma glucose; HDL-C: high-density lipoprotein cholesterol; HLAP: hyperlipidemic acute pancreatitis; HR: hazard ratios; TC: total cholesterol;TG: triglyceride; TyG–BMI: triglyceride glucose–body mass index.
Predictive value of combined TyG–BMI index, BISAP score, and CLR for HLAP prognosis
ROC curve analysis was performed to evaluate and compare the predictive accuracy of the novel marker CLR with that of the traditional inflammatory marker CRP, as well as other indices. CLR demonstrated a significantly superior predictive performance (AUC = 0.974) compared to CRP alone (AUC = 0.812; p < 0.001 for comparison). Furthermore, the combined model incorporating the TyG–BMI index, BISAP score, and CLR achieved high predictive accuracy (p <0.05). The ROC analysis presented herein evaluated the overall predictive accuracy of these markers when treated as continuous variables. ROC curve analysis demonstrated that the combination of the TyG–BMI index, BISAP score, and CLR achieved high predictive accuracy in distinguishing patients with HLAP with poor prognosis from those with good prognosis (AUC = 0.987, 95% CI: 0.961–0.998). To assess the robustness of these findings, particularly for the high-performing CLR marker (apparent AUC = 0.974), internal validation was conducted using bootstrapping with 1000 samples. The optimism-corrected AUC for CLR was 0.968 (95% CI: 0.952–0.984), confirming its stable and exceptional predictive performance. The determination of optimal clinical cutoff thresholds for TyG–BMI and CLR to guide decision-making requires further validation in larger, prospective cohorts. The AUC, sensitivity, and specificity values are summarized in Table 6, and the ROC curves are illustrated in Figure 1.
Predictive performance of TyG–BMI index, BISAP score, CLR, and their combination for HLAP prognosis.

AUC: area under the curve; BISAP: bedside index for severity in acute pancreatitis; CI: confidence interval CLR: C-reactive protein-to-lymphocyte ratio; CRP: C-reactive protein; HLAP: hyperlipidemic acute pancreatitis; TyG–BMI: triglyceride glucose–body mass index.
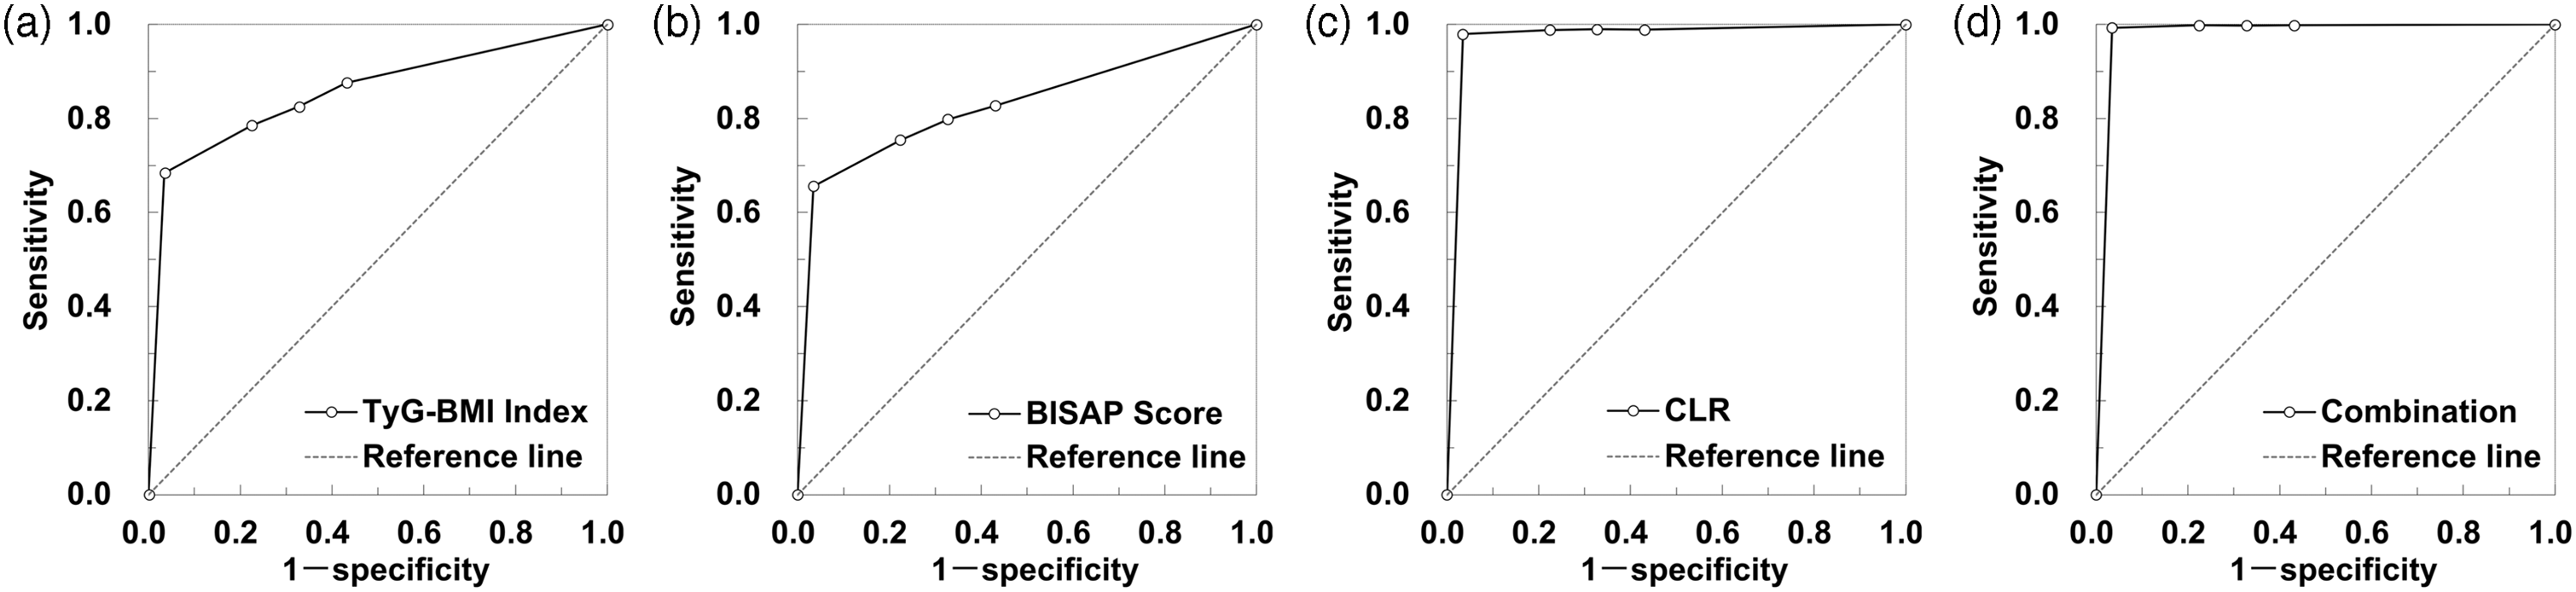
ROC curves assessing the predictive value of TyG-BMI index, BISAP score, and CLR, both individually and in combination, for discriminating between patients with HLAP with poor prognosis and those with good prognosis within 28 days of admission. BISAP: bedside index for severity in acute pancreatitis; CLR: C-reactive protein-to-lymphocyte ratio; HLAP: hyperlipidemic acute pancreatitis; ROC: receiver operating characteristic; TyG–BMI: triglyceride glucose–body mass index.
Kaplan–Meier survival analysis
To further illustrate the prognostic utility of CLR over time, we performed a Kaplan–Meier analysis. Patients were stratified into high-CLR (≥125.4) and low-CLR (<125.4) groups based on the optimal cutoff value derived from the ROC analysis. As shown in Figure 2, the Kaplan–Meier curves demonstrated a significant and early divergence between the two groups. Patients in the high-CLR group had a substantially lower probability of survival free from poor prognosis throughout the 28-day observation period compared to those in the low-CLR group (log-rank p = 0.000). This graphical analysis provides strong complementary evidence supporting the Cox regression model, underscoring the critical role of CLR in risk stratification.

Kaplan–Meier curves for 28-day survival free from poor prognosis, stratified by the CLR level. Patients with a CLR value ≥125.4 (high-CLR group, green line) had a significantly lower probability of survival free from poor prognosis (defined as the composite of mortality, organ failure, or pancreatic necrosis) compared to patients with a CLR value <125.4 (low-CLR group, yellow line) (log-rank p = 0.000). CLR: C-reactive protein-to-lymphocyte ratio.
Discussion
This study establishes the TyG–BMI index, BISAP score, and CLR as pivotal biomarkers for stratifying disease severity and predicting 28-day prognosis in patients with HLAP. By integrating metabolic, clinical, and inflammatory parameters, these markers collectively address the multifactorial pathophysiology of HLAP, offering a robust framework for early risk stratification and personalized therapeutic interventions. The TyG–BMI index, a composite marker of insulin resistance and lipid metabolism, emerged as a strong independent predictor of adverse outcomes (HR = 1.62, 95% CI: 1.33–1.97), underscoring its role in reflecting the metabolic derangements central to HLAP progression. 13 Elevated TyG–BMI reflects impaired lipid clearance and heightened lipotoxicity, driven by excessive FFAs that induce oxidative stress, mitochondrial dysfunction, and endoplasmic reticulum stress within pancreatic acinar cells. 14 This mechanism aligns with studies demonstrating that hypertriglyceridemia exacerbates pancreatic injury through FFA-mediated activation of inflammatory pathways, including NF-κB and NLRP3 inflammasomes. 15 Notably, our findings extend prior work on the TyG index in metabolic syndromes, 16 positioning TyG–BMI as a superior prognostic tool in HLAP due to its incorporation of adiposity (BMI), which amplifies metabolic dysregulation, particularly in obese populations. 17
In the present study, we strategically selected the BISAP score as the clinical severity index for several reasons. Primarily, the BISAP score is designed for early risk stratification (i.e. within 24 h of admission) and relies on only five readily available clinical parameters, making it highly practical and efficient for use in emergency settings. This contrasts with the Ranson score, which requires 48 h for complete assessment, and the Acute Physiology and Chronic Health Evaluation (APACHE)-II score, which is more complex and incorporates numerous physiological variables that were not consistently available in the present retrospective dataset. The BISAP score, previously validated in general AP, retained prognostic relevance in HLAP (HR = 1.92, 95% CI: 1.43–2.57), consistent with its established utility in identifying organ failure and systemic complications. 18 However, it is crucial to contextualize the limitations within the distinct phenotype of HLAP. The BISAP score is an etiology-agnostic tool designed to identify overt organ failure and systemic inflammation; however, it does not specifically capture the unique pathophysiological drivers underlying HLAP. The criteria of the score are not weighted to reflect the profound metabolic disturbance intrinsic to this subtype, namely massive TG overload and the subsequent lipotoxicity from excessive FFAs.14,15 These FFAs are not only directly injurious to pancreatic acinar cells but also drive a particularly intense systemic inflammatory response and microcirculatory impairment,3,19 processes that precede and contribute to the organ failure detected by BISAP. Therefore, although BISAP effectively identifies patients who have already developed significant clinical deterioration, its moderate sensitivity (68.9%) in our cohort suggests that it may lack the granularity to identify a subset of patients with HLAP at high risk based solely on their underlying metabolic–inflammatory burden before organ failure becomes fully manifest. This inherent gap underscores the necessity of complementing clinical scoring systems with biomarkers that are directly rooted in the specific pathophysiology of HLAP.
This gap highlights the need to complement clinical scoring systems with metabolic and inflammatory biomarkers. CLR, a novel ratio integrating CRP and Lym count, demonstrated exceptional predictive accuracy (AUC = 0.974) and emerged as the strongest independent prognostic factor (HR = 2.05, 95% CI: 1.62–2.60). 20 CRP elevation in HLAP reflects systemic inflammation driven by FFA-activated macrophages and neutrophils, while lymphopenia signals adaptive immune exhaustion, a hallmark of severe inflammatory states. 21 This dual dynamic mirrors observations in sepsis, where CLR predicts mortality through similar mechanisms of immune paralysis, 22 suggesting its broader applicability in critical care settings. A key finding of the present study is the superior prognostic performance of CLR compared to the traditional inflammatory marker CRP alone (Table 6). Although CRP is a well-established, nonspecific acute-phase reactant that reflects the magnitude of systemic inflammation, 23 it fails to capture the concomitant state of the host immune response. In contrast, CLR integrates two critical pathological axes: the proinflammatory drive (represented by CRP) and the countervailing immunosuppression (represented by lymphopenia). 21 In HLAP, excessive FFAs not only trigger a robust CRP response but also induce stress-induced lymphopenia through apoptosis and glucocorticoid-mediated sequestration. 24 Therefore, a high-CLR simultaneously indicates rampant inflammation and failed compensatory immunity, identifying patients who are most vulnerable to disease progression. This dual-parameter nature likely accounts for its significantly higher AUC compared to CRP, offering a more nuanced and powerful tool for risk stratification.
In our multivariate Cox regression, traditional markers such as TC, TG, and CRP lost their independent prognostic significance, while TyG–BMI, BISAP, and CLR retained theirs. Collinearity diagnostics confirmed that this finding was likely attributable to substantial multicollinearity (VIF > 5) among the former group of variables. This observation is pathophysiologically plausible, as HLAP is characterized by a tightly intertwined metabolic–inflammatory cascade in which elevated TG drive systemic inflammation, reflected by elevated CRP), creating a cluster of correlated risk factors. In such a scenario, multivariate models struggle to attribute unique predictive value to individual correlated components. The emergence of TyG–BMI (a composite metabolic index) and CLR (a composite inflammatory–immune index) as independent predictors underscores their advantage as integrative markers. These indices capture the essence of these correlated metabolic and inflammatory pathways more robustly than any single, isolated component, providing a more stable and holistic assessment of patient risk.
The synergistic combination of TyG–BMI, BISAP, and CLR achieved the highest predictive performance in the present study (AUC = 0.987 and sensitivity = 98.5%), outperforming all individual markers. This synergy arises from their complementary roles: TyG–BMI identifies metabolic risk, BISAP evaluates clinical deterioration, and CLR quantifies inflammatory burden. Such a multidimensional approach contrasts with studies focusing on isolated biomarkers, such as those who emphasized immune checkpoint markers in gastric cancer prognosis, 25 or Garg et al., 23 who advocated for CRP alone for pancreatitis severity assessment. These findings align with emerging paradigms in precision medicine, wherein composite models integrating metabolic, clinical, and inflammatory data enhance prognostic accuracy. 26 For instance, in cardiovascular diseases, combining lipid profiles with inflammatory markers such as hs-CRP improves risk prediction, 27 a strategy that is now validated in the context of HLAP.
The prognostic dominance of CLR in this cohort highlights the central role of inflammation–immune dysregulation in HLAP progression. Experimental models demonstrate that FFAs activate toll-like receptor 4 on pancreatic macrophages, triggering the release of interleukin (IL)-1β, IL-6, and tumor necrosis factor (TNF)-α, which in turn amplify CRP production and recruit neutrophils to the pancreas. 19 Concurrently, stress-induced glucocorticoid release and apoptosis lead to Lym depletion, impairing pathogen clearance and tissue repair. 24 This vicious cycle is exacerbated in HLAP by the dual burden of metabolic and inflammatory stress, providing a mechanistic explanation for CLR’s superior pDDWredictive power. Similar mechanisms have been observed in severe coronavirus disease 2019 (COVID-19), where lymphopenia and CRP elevation correlate with poor outcomes, 28 further supporting the utility of CLR across inflammatory conditions.
The clinical implications of these findings are profound. First, TyG–BMI may guide early metabolic interventions, such as insulin–heparin protocols or fibrate therapy, aimed at reducing TG levels and mitigating lipotoxicity. 12 Second, the sensitivity of CLR to immune exhaustion suggests a potential role for immunomodulatory therapies, such as IL-1 antagonists or glucocorticoid-sparing agents, in patients with escalating inflammation. 29 Third, integrating these markers into electronic health record systems could facilitate automated risk alerts, enabling real-time triage in emergency settings. 30 For instance, a patient presenting with TyG–BMI >120, CLR >150, and BISAP ≥3 could trigger an ICU admission protocol, ensuring timely intensive care.
Despite these advances, several limitations of this study should be acknowledged. First, the single-center, retrospective design may introduce selection bias and limit the external validity of our findings. The patient cohort, therapeutic protocols, and laboratory reference ranges derived from a single institution may not be fully representative of other centers or broader populations. Consequently, the generalizability of the proposed predictive model combining TyG-BMI, BISAP, and CLR requires validation in diverse, multicenter settings.
Second, although the BISAP score was selected for its practicality and validated performance in early assessment, the study did not include a direct comparison to other established scoring systems, such as APACHE-II or Ranson’s criteria. Future multicenter, prospective studies directly comparing the combined model (TyG-BMI, BISAP, and CLR) with traditional scores are warranted to fully establish its relative prognostic advantage. Also, the exclusion of non-HLAP cases limits the applicability of our conclusions to other pancreatitis subtypes.
Although internal validation via bootstrapping suggested minimal overfitting for the CLR model, the exceptionally high prognostic accuracy reported herein must be interpreted with caution. The single-center design and the potential for unmeasured confounding factors necessitate external validation in prospective, multicenter cohorts to confirm the generalizability of our findings and the proposed cutoff values before widespread clinical adoption can be recommended.
Additionally, the modest sample size precluded meaningful subgroup analyses (e.g. by TG strata), and longitudinal outcomes (e.g. chronic pancreatitis) were not assessed. Future multicenter prospective studies should validate these markers across diverse populations and explore underlying mechanistic links using omics technologies. 31 For instance, animal models could elucidate how TyG-BMI and CLR modulate pancreatic injury, while interventional trials could test biomarker-guided therapies (e.g. early plasmapheresis for high TyG-BMI). 12 Integrating these markers with imaging biomarkers (e.g. CT severity index) could further enhance prognostication. 32
Although internal validation via bootstrapping suggested minimal overfitting for the CLR model, the high prognostic accuracy reported herein must be interpreted with caution. The single-center design and the potential for unmeasured confounding factors necessitate external validation in prospective, multicenter cohorts to confirm the generalizability of our findings and the proposed cutoff values before widespread clinical adoption can be recommended.
Furthermore, although we have detailed the standard treatment protocols, the retrospective nature of the study did not allow for a randomized controlled assessment of the impact of specific therapies (such as the timing of plasmapheresis) on outcomes. The potential for treatment confounding, where patients with more severe disease received more aggressive interventions, cannot be entirely ruled out. Finally, although the study demonstrates the strong prognostic value of TyG-BMI and CLR as continuous variables, it does not establish specific clinical cutoff values. Future research with larger sample sizes should employ methods such as Youden’s index to define and validate optimal thresholds for these markers, a critical step for integrating these markers into routine clinical practice.
Conclusion
In conclusion, the findings of this study suggest that the TyG-BMI index, BISAP score, and CLR are valuable biomarkers for stratifying disease severity and predicting prognosis in patients with HLAP. Their combined application could potentially aid in the early identification of high-risk patients and guide clinical decision-making. Future prospective studies are warranted to validate these findings.
Supplemental Material
sj-pdf-1-imr-10.1177_03000605251411130 - Supplemental material for Correlation of triglyceride glucose–body mass index, bedside index for severity in acute pancreatitis, and C-reactive protein-to-lymphocyte ratio with disease severity in patients with hyperlipidemic acute pancreatitis: A retrospective-cohort study
Supplemental material, sj-pdf-1-imr-10.1177_03000605251411130 for Correlation of triglyceride glucose–body mass index, bedside index for severity in acute pancreatitis, and C-reactive protein-to-lymphocyte ratio with disease severity in patients with hyperlipidemic acute pancreatitis: A retrospective-cohort study by Ruihua Xie and Yan Zhang in Journal of International Medical Research
Supplemental Material
sj-pdf-2-imr-10.1177_03000605251411130 - Supplemental material for Correlation of triglyceride glucose–body mass index, bedside index for severity in acute pancreatitis, and C-reactive protein-to-lymphocyte ratio with disease severity in patients with hyperlipidemic acute pancreatitis: A retrospective-cohort study
Supplemental material, sj-pdf-2-imr-10.1177_03000605251411130 for Correlation of triglyceride glucose–body mass index, bedside index for severity in acute pancreatitis, and C-reactive protein-to-lymphocyte ratio with disease severity in patients with hyperlipidemic acute pancreatitis: A retrospective-cohort study by Ruihua Xie and Yan Zhang in Journal of International Medical Research
Footnotes
Acknowledgments
We would like to acknowledge the study participants.
Author contributions
RX: Conceived, designed the study, and revised the paper. RX and YZ: Collected clinical and biochemical data. RX: Contributed to the statistical analysis, results interpretation, and drafting the paper.
Data availability statement
The datasets generated and/or analyzed during the current study are not publicly available due to patient privacy and ethical restrictions, but are available from the corresponding author on reasonable request.
Declaration of conflicting interests
The authors declared no potential conflicts of interest with respect to the research, authorship, and/or publication of this article.
Funding
The authors have not declared a specific grant for this research from any funding agency in the public, commercial or not-for-profit sectors.
Supplemental material
Supplemental material for this article is available online.
References
Supplementary Material
Please find the following supplemental material available below.
For Open Access articles published under a Creative Commons License, all supplemental material carries the same license as the article it is associated with.
For non-Open Access articles published, all supplemental material carries a non-exclusive license, and permission requests for re-use of supplemental material or any part of supplemental material shall be sent directly to the copyright owner as specified in the copyright notice associated with the article.