
Abstract
Objective
The relationship between different glycaemic variability (GV) indexes and adverse cardiovascular outcomes is not well understood. This study aims to determine whether GV is related to the occurrence of adverse cardiovascular events in patients with acute coronary syndrome (ACS).
Methods
PubMed, EMBASE, and Web of Science were comprehensively searched from the establishment of databases to 29 June 2022. The relationship between two important GV indexes, including the mean amplitude of glycemic excursion (MAGE) and standard deviation (SD), and the adverse cardiovascular events in ACS patients were evaluated, respectively.
Results
A total of 11 studies with 3709 ACS patients were included. Pooled results showed that patients with higher GV had significantly increased risk of adverse cardiovascular events, including MAGE (relative risk [RR] = 1.76, 95% CI: 1.40 to 2.22, p < 0.001, I2 = 25%) and SD (RR = 2.14, 95% CI: 1.73 to 2.66, p < 0.001, I2 = 0%).
Conclusions
Increased GV is related to the poor prognosis in patients with ACS. Additionally, more well-designed studies comparing different indicators of GV with adverse cardiovascular events in ACS patients are still warranted.
Introduction
Acute coronary syndrome (ACS) is the sudden decrease of myocardial blood supply, including ST-segment elevation myocardial infarction, non-ST-segment elevation myocardial infarction and unstable angina. Despite important scientific progress on its management, patients with ACS remain in higher risk of complications such as heart failure, arrhythmia, sudden death and stroke.1,2
Glycaemic variability (GV) refers to an unstable state in which the glucose levels fluctuate between high and low, and it can be classified into two categories: long-term GV (weekly, monthly, years etc.) and short-term GV (within a day, between days).3–5 Long-term GV is usually based on hemoglobin A1c (HbA1c) or fasting plasma glucose (FPG) levels by visit-to-visit measurements and is calculated using the standard deviation (SD) or coefficient of variation (CV). SD and mean amplitude of glycemic excursion (MAGE) are two common metrics used to assess the short-term GV index by continuous glucose monitoring system (CGMS) and self-monitoring blood glucose (SMBG). 6
Recent studies indicated that GV is correlated with a wide variety of diseases resulting in poor prognoses such as sepsis, 7 autonomic dysfunction, 8 and cardiovascular disease 9 in patients with or without diabetes.10–12 The adverse consequences of GV mainly include all-cause, contrast-induced nephropathy, 13 in-stent restenosis, 14 and so on. In addition, GV has been hypothesized to be deleterious in ACS patients.15–25 However, Lipska et al. 26 demonstrated that GV did not provide additional value after controlling the multiple risk factors in patients with ACS. Meanwhile, a recent meta-analysis with 7 studies showed that 4 eligible studies revealed an association between myocardial infarction and GV, while others did not. 27 The relationship between different GV indexes and adverse cardiovascular outcomes is not yet well-established. Thus, we conducted this meta-analysis to assess the relationship between GV and the adverse cardiovascular events in ACS patients.
Materials and methods
This study was conducted following the Meta-Analysis of Observational Studies in Epidemiology (MOOSE) guidelines 28 and the Cochrane Handbook. 29
Literature search
We searched PubMed, Embase and Web of science for articles published up until 29 June 2022, involving the following terms: (1) “glucose fluctuation” OR “glycemic variability” OR “HbA1c variability “OR “Variation in fasting plasma glucose” OR “visit-to-visit glucose fluctuation” OR “glucose variability” OR” continuous glucose monitoring” and (2) “Acute Coronary Syndrome” OR “myocardial infarction” OR “unstable angina” OR “ACS” OR “AMI” OR “PCI” OR “percutaneous coronary intervention” and (3) “stroke” OR “mortality” OR “cardiovascular morbidity” OR “death” OR “major adverse events” OR “prognosis” OR “outcomes” OR “major adverse cardiac events” OR “in-stent restenosis”. The detailed search strategy is presented as a supplementation. All searches were restricted to studies published in English or Chinese.
Study selection
The inclusion criteria for studies in this review are as follows: (1) included patients with acute coronary syndrome; (2) patients were categorized by MAGE or SD via CGMS or SMBG; (3) documented the incidence of adverse cardiovascular events during follow up; (4) reported the relative risk (RR) and their corresponding 95% confidence intervals (CI) for the incidences of adverse cardiovascular events in patients with higher versus lower GV; (5) longitudinal follow-up studies. Adverse cardiovascular events, usually a composite outcome, including myocardial, infarction, acute heart failure, cardiac death, all-cause death, stroke and arrhythmia, are defined as described in the original articles. Exclusion criteria: animal experiments, reviews, case reports, abstracts, and protocols were excluded.
Data extracting and quality evaluation
Literature search, data extraction and quality assessment, respectively, were performed by two independent authors. The discrepancies were resolved by a third review. We extracted the following data using an excel data extraction form: (1) name of the first author, publication time, country; (2) baseline data including: type of ACS, sample size, mean age, sex ratio; (3) index of GV measurement, duration of GV measurement, the cut off values of defined the higher GV groups and lower GV groups; (4) follow-up duration and incidence of adverse cardiovascular events; (5) confounding factors adjusted. Quality evaluation was done using the Newcastle-Ottava Scale (NOS), 30 which was ranged from 0 to 9. The NOS evaluates the quality of studies from three aspects: selection, comparability and outcome.
Statistics analyses
Considering the influence of diverse GV indexes on adverse cardiovascular events, we analyzed the two important and frequently-used indexes, including MAGE and SD. The association between GV and adverse cardiovascular events was described using relative risk with a 95% confidence interval. We extracted the RR and stand errors (SE) from the original articles directly or calculated from 95% CIs or p values. The data above were logarithmically transformed to stabilize variance and normalized the distribution. 29 Heterogeneity was assessed using the Cochrane’s Q test and the I2 statistic. 31 Cochrane Q Statistics p value < 0.1 and I2 > 50% suggested the existence of heterogeneity. A random-effects model was used to combine data. 29 Sensitivity analyses by omitting one study after another to judge the stability of the results. 32 Publication bias was assessed using a funnel plot, Egger ‘s test and Begg’s test. 33 The Trim-and-Fill method was applied to estimate adjusted effect sizes by incorporating some “missing” studies and recalculates the pooled RR, if the funnel plots are found to be asymmetrical. 29
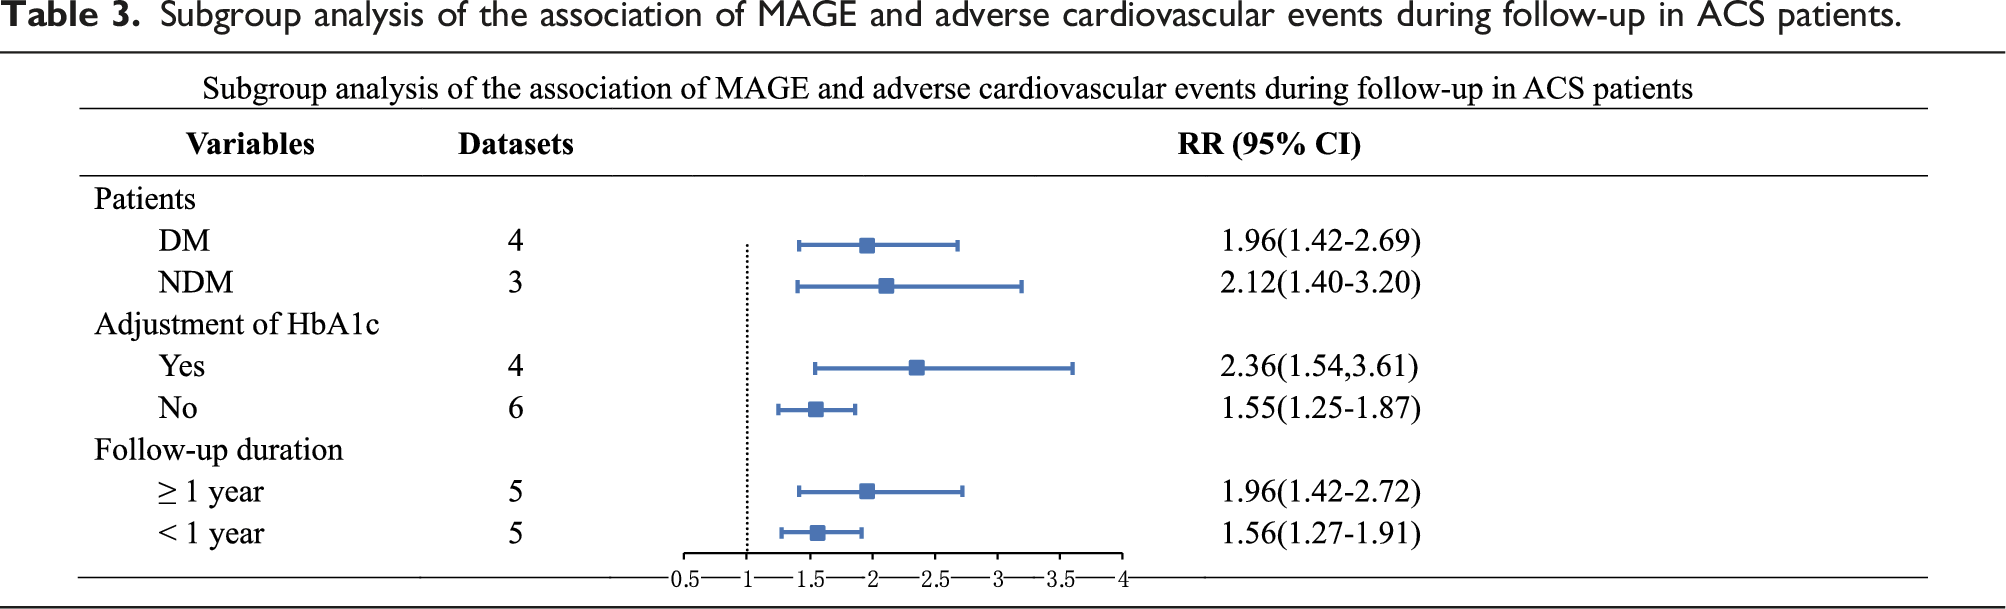
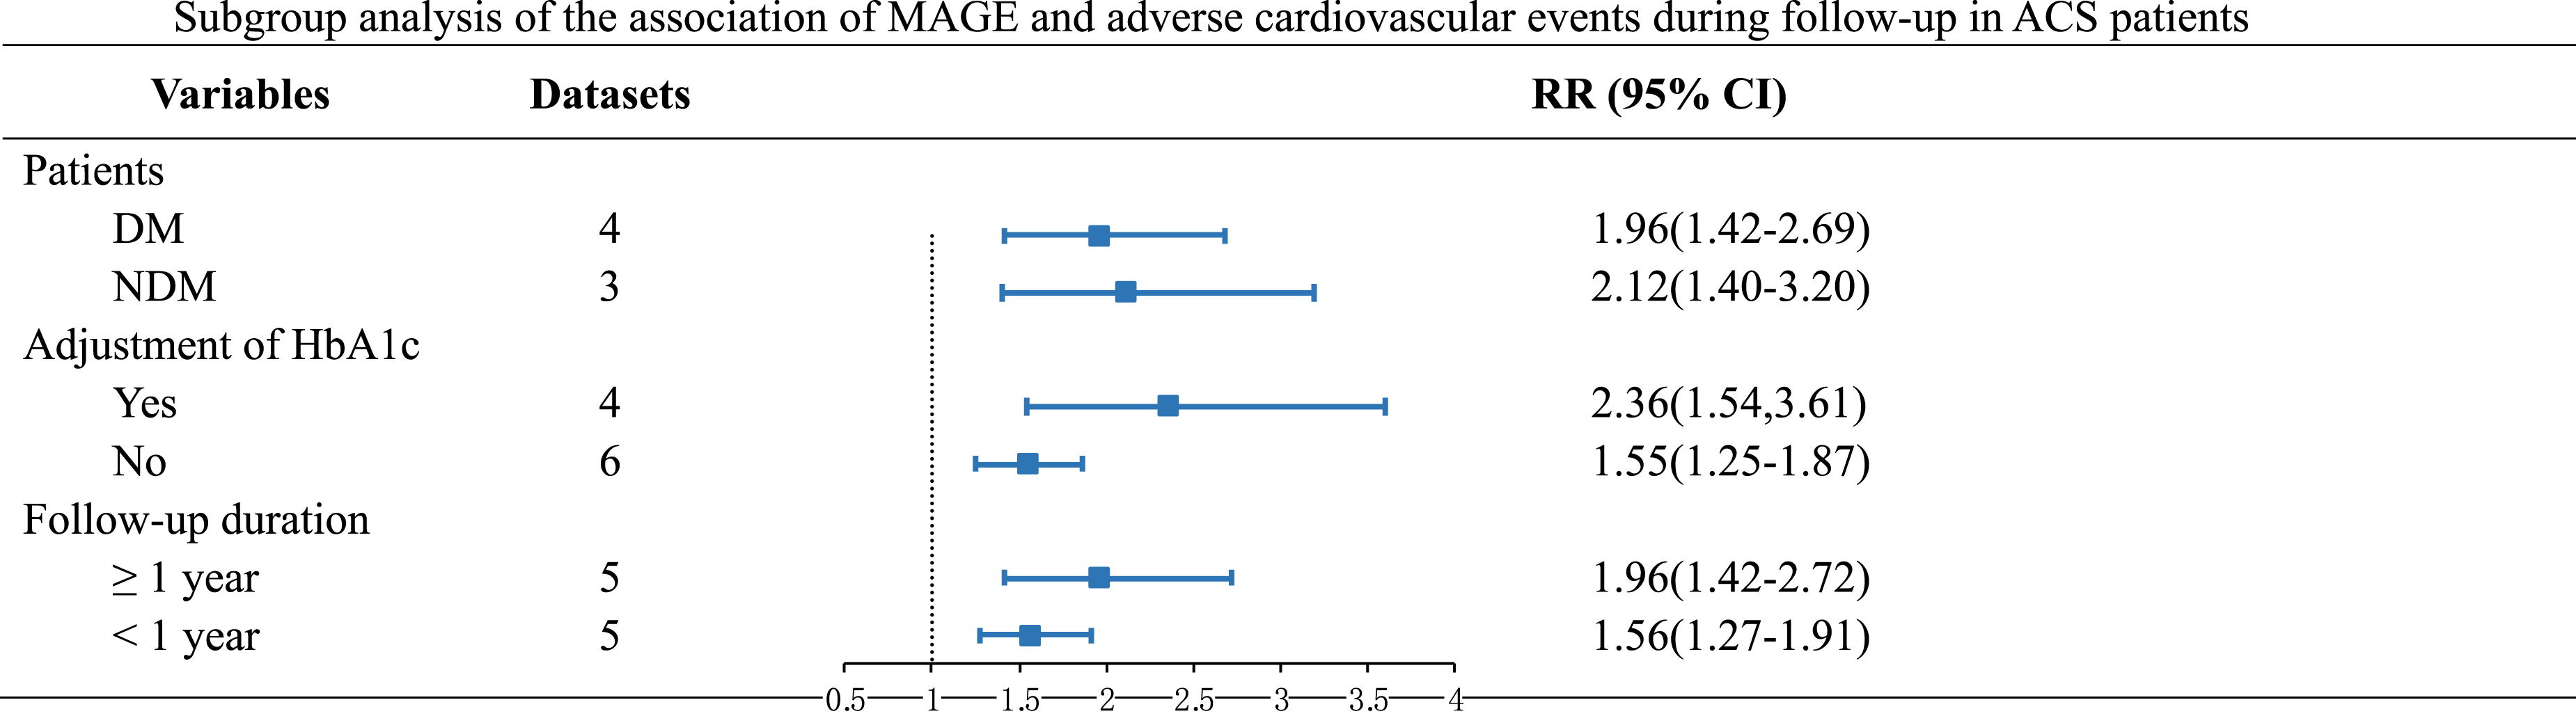
Importantly, subgroup analysis was performed according to diabetic status, adjustment for HbA1c and the duration of follow-up, in order to explore the potential confounding factors on the outcomes. RevMan (Version 5.3) and Stata software (Version 14.0) were applied for the meta-analysis and statistical analysis. p < 0 .05 was statistically significant.
Results
Results of literature search
A total of 669 citations were checked from the following databases: PubMed (n = 8), Web of Science (n = 550), Embase (n = 58). No additional literature was found. After removing 108 duplicates by Endnote, the remaining studies were screened by reading their titles and abstracts to exclude irrelevant articles, reviews and editorials; thirty-nine articles were eligible for full‐text reviews. Finally, we excluded 28 articles (4 glycaemic variability not evaluated by MAGE or SD, 21 outcomes not reported, 3 not able to obtain the full text). Figure 1 shows the flowchart of the study selection process. The final analysis included 11 studies which met the inclusion criteria for meta-analysis.15–25 Flowchart of literature search. MAGE: mean amplitude of glycemic excursion; SD: standard deviation.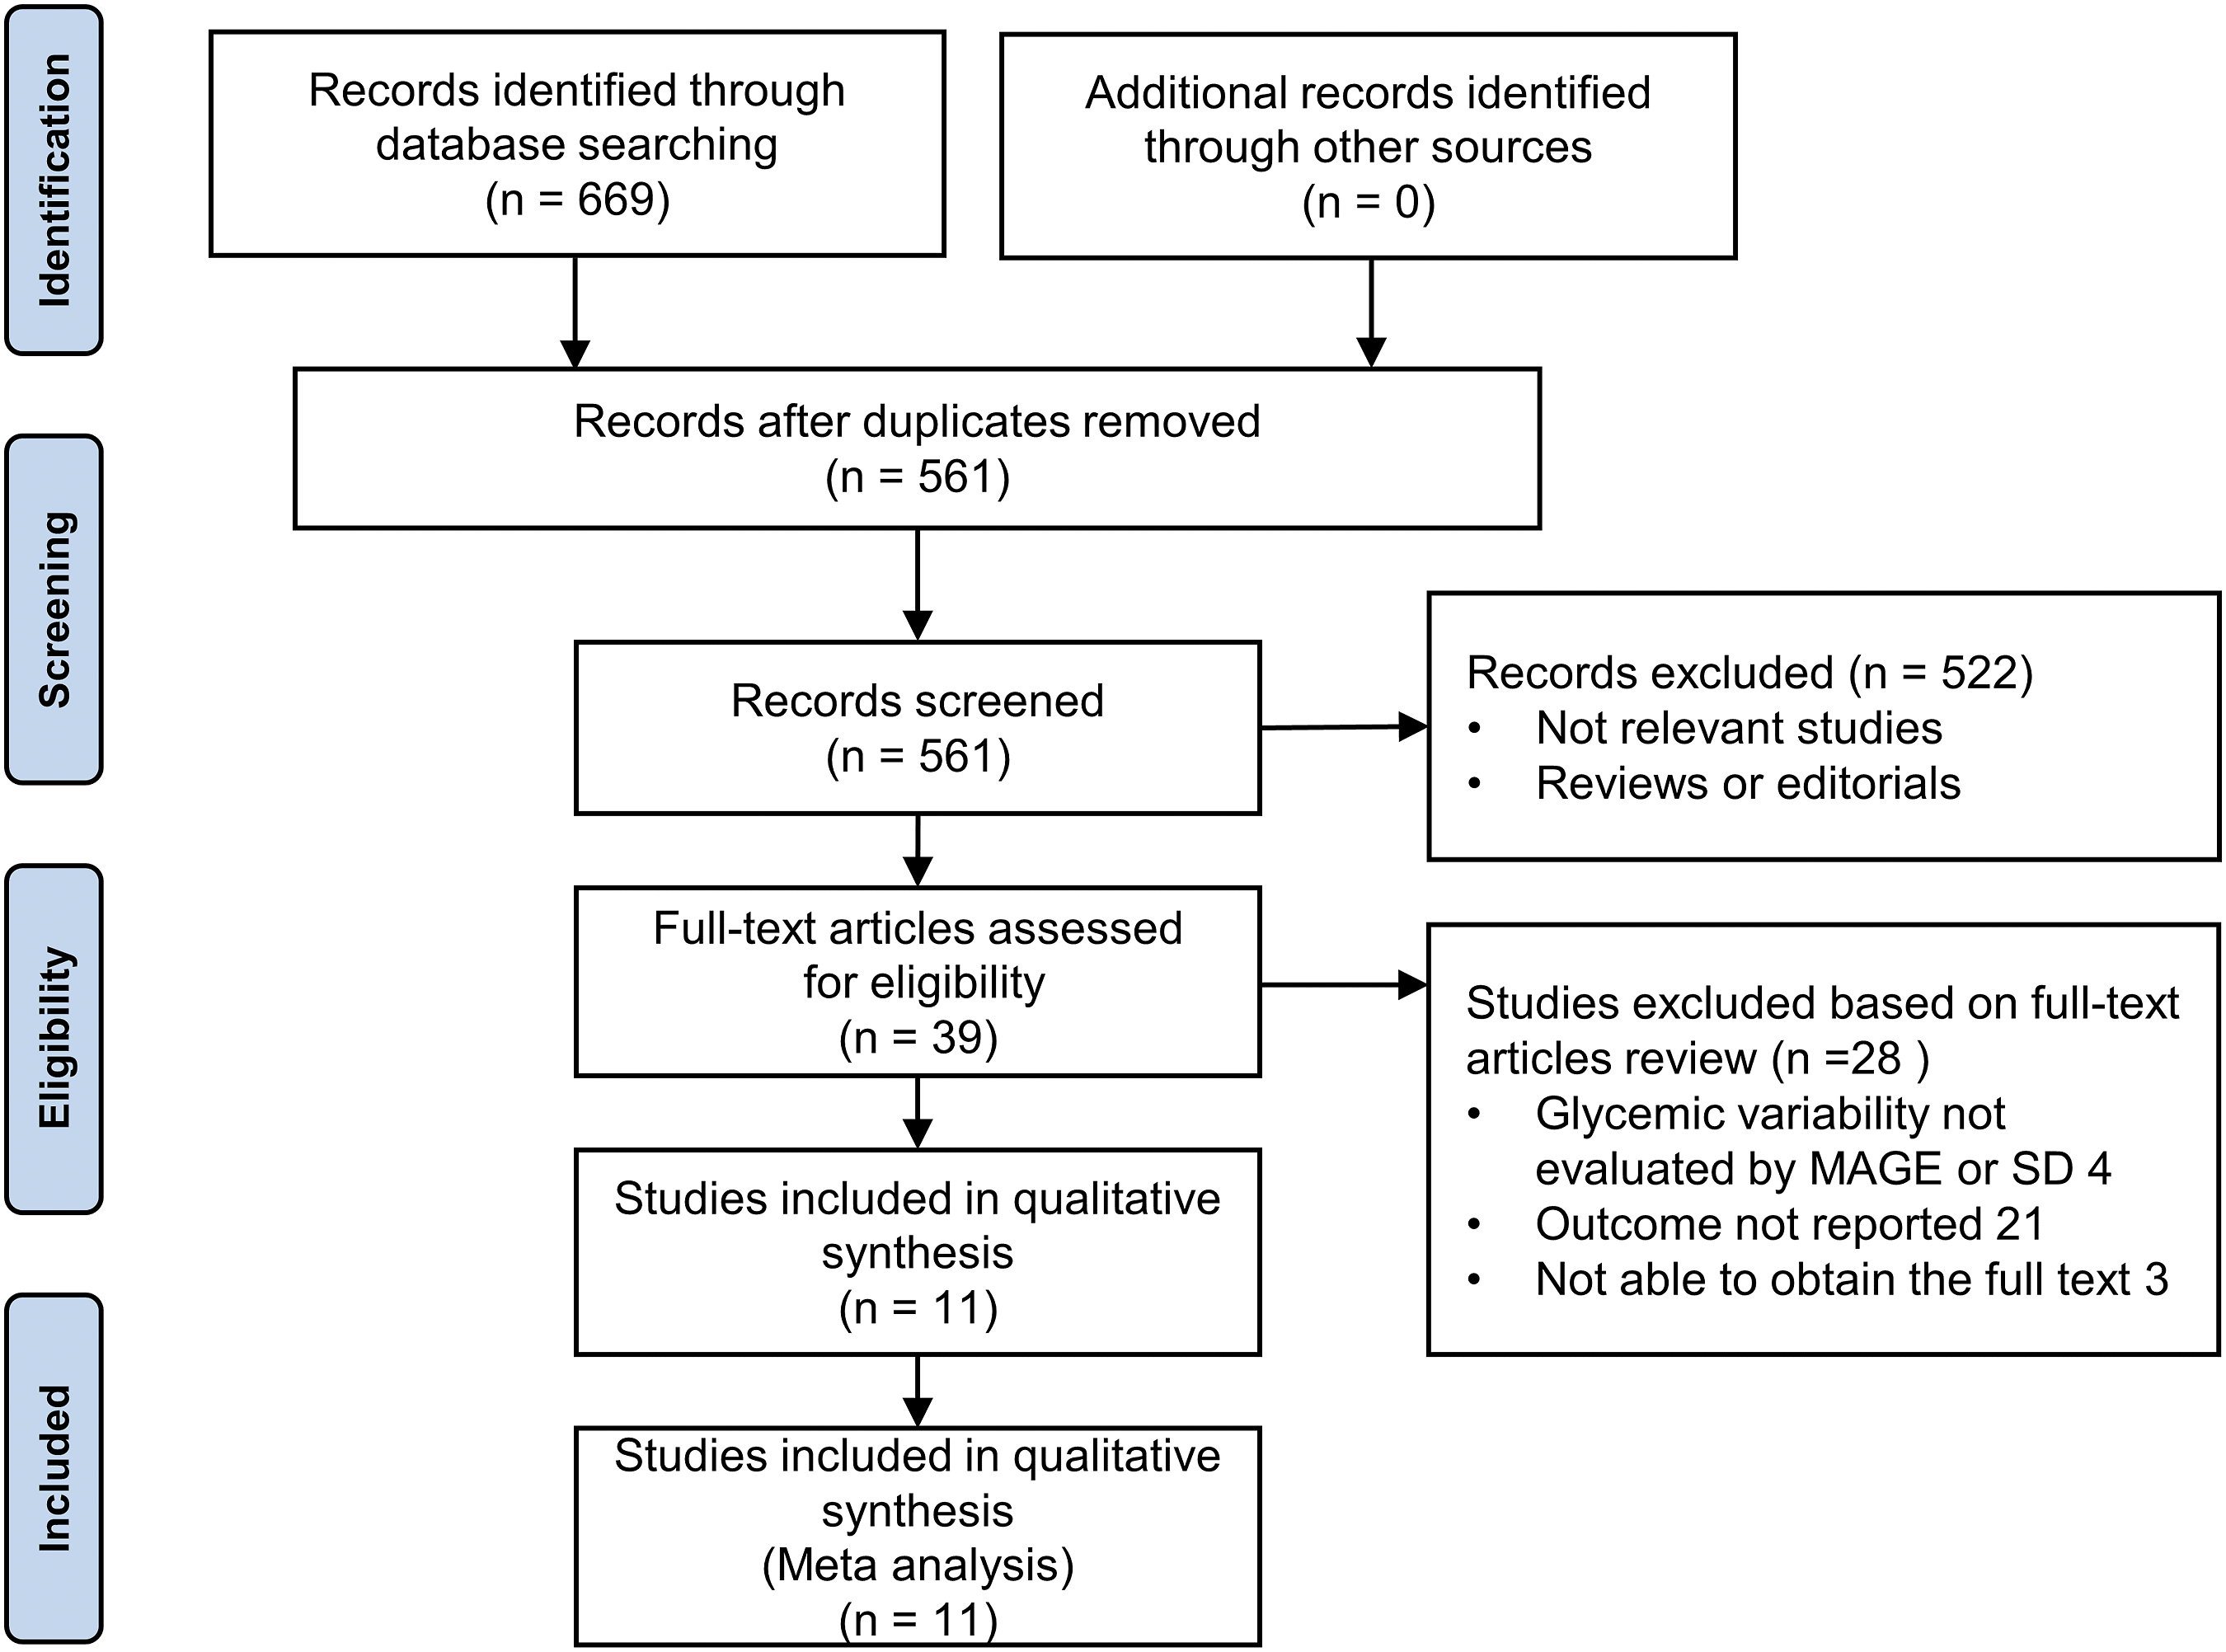
Study characteristics and quality evaluation
Characteristics of the included studies.
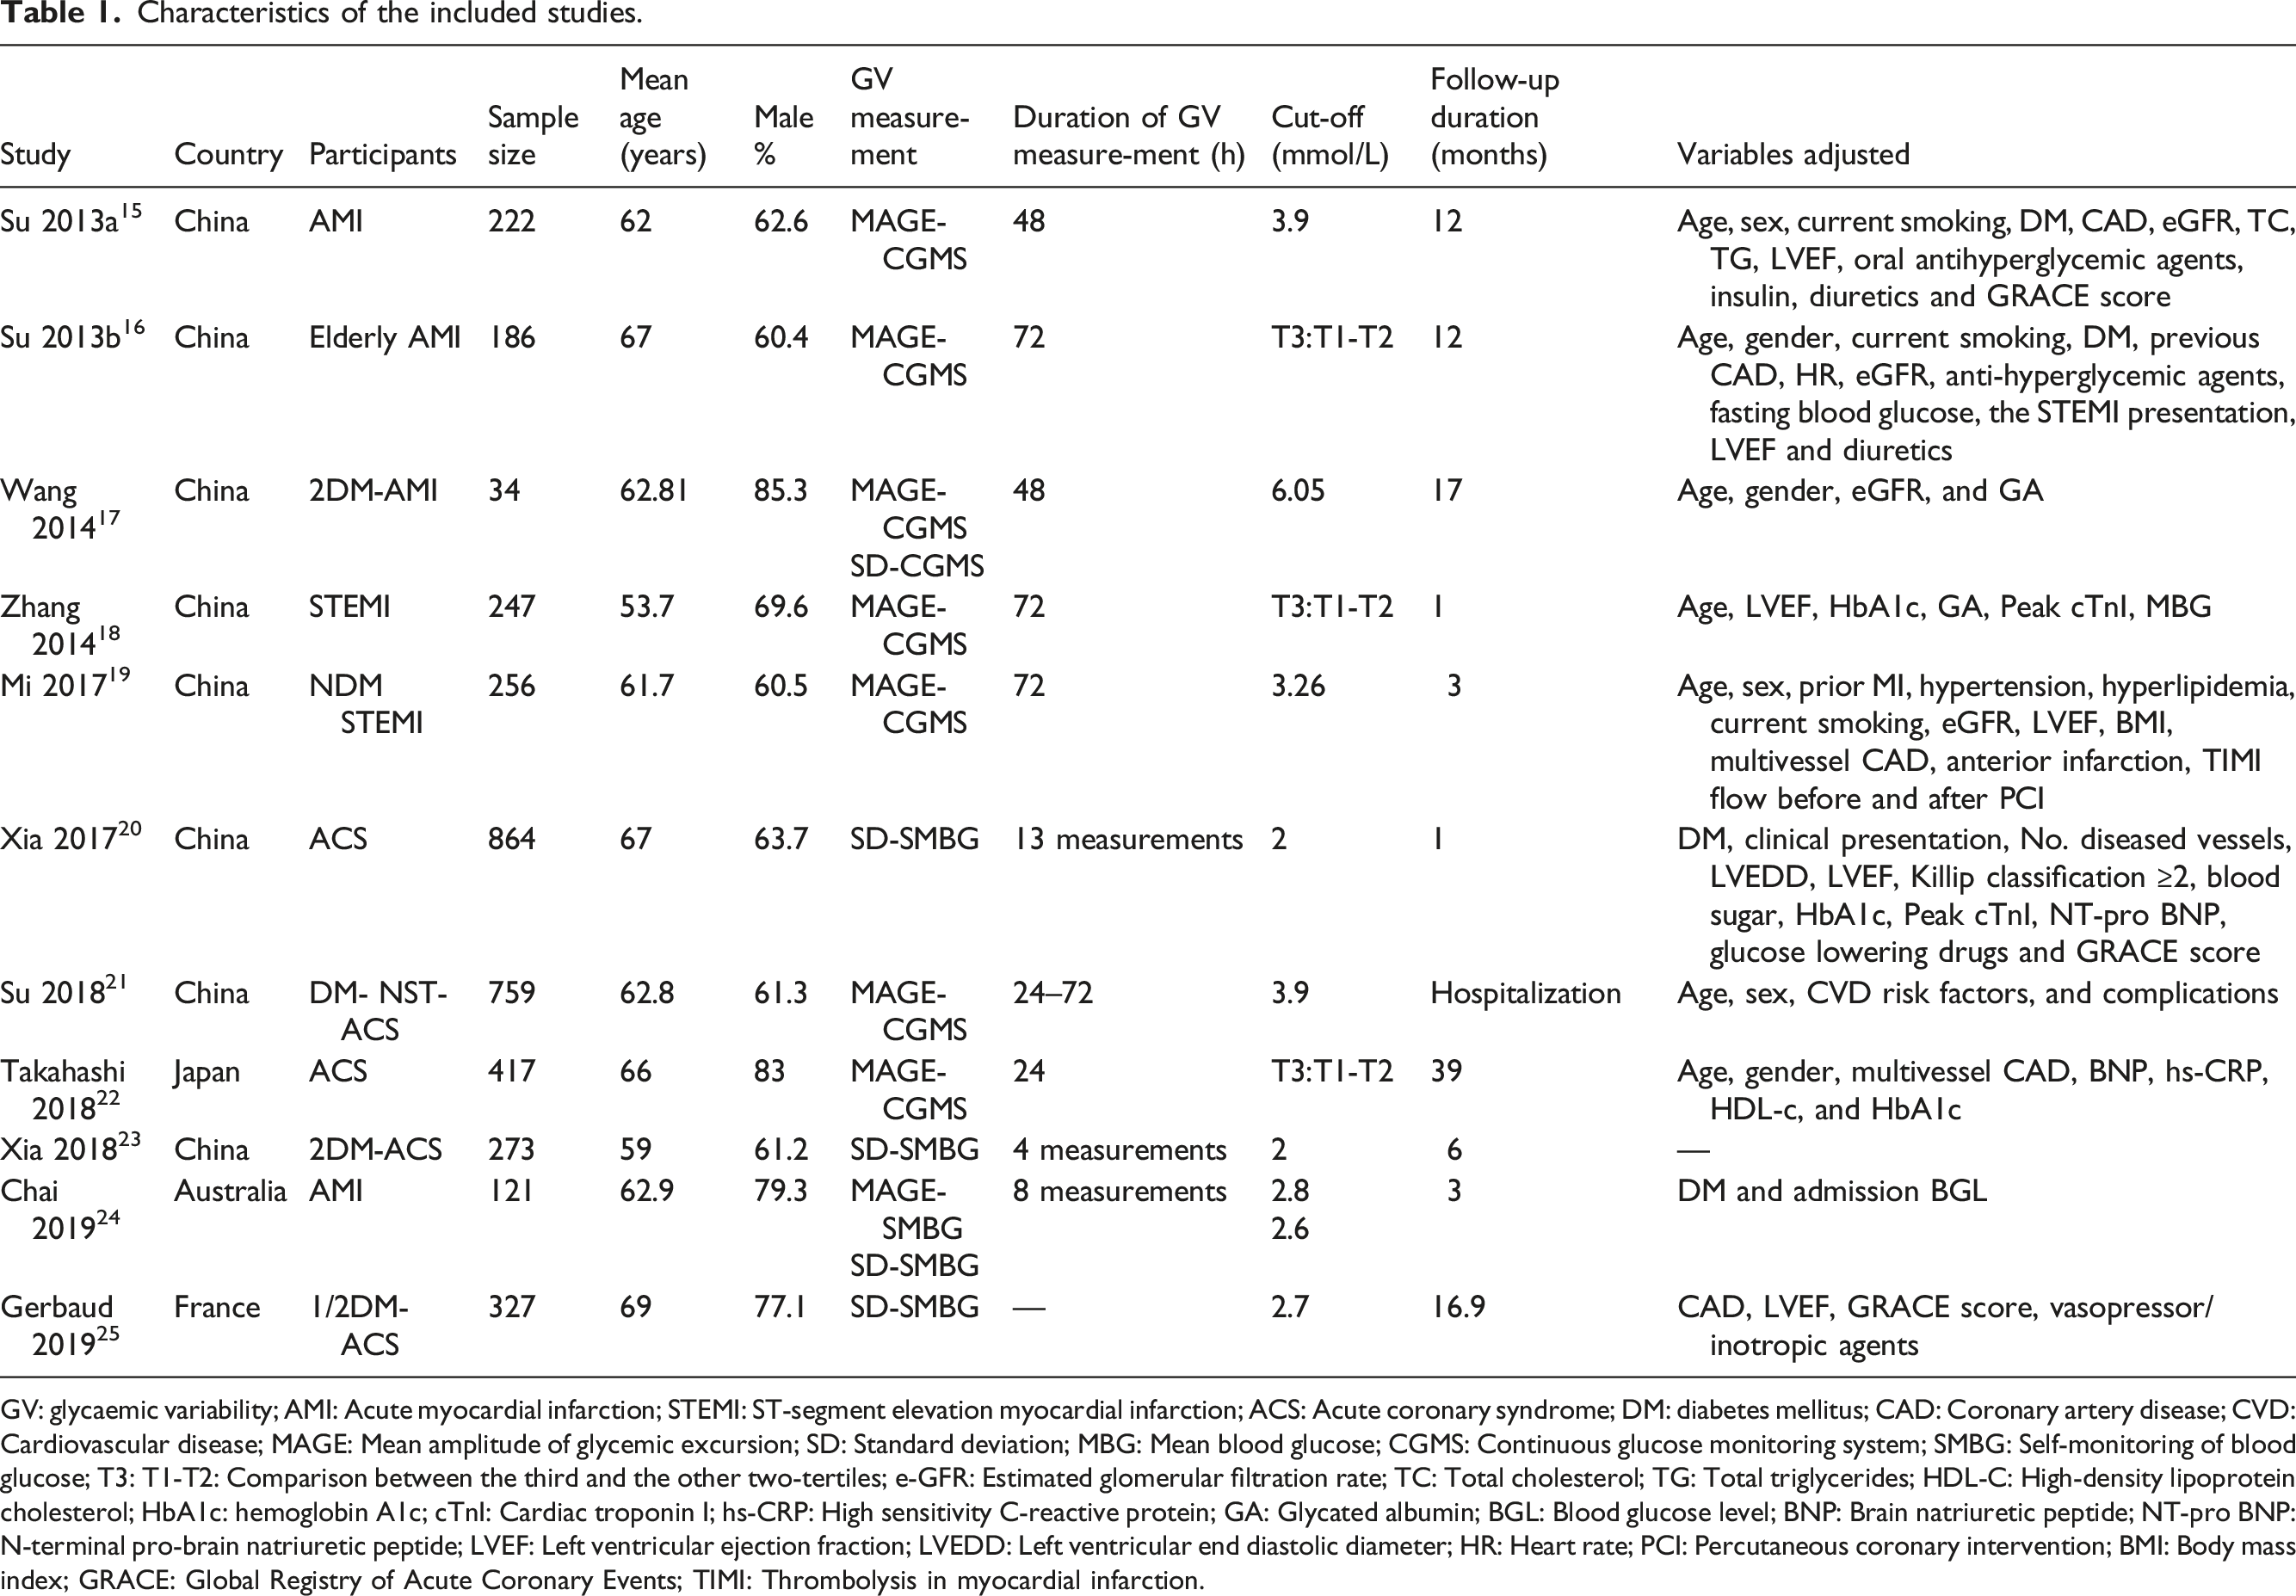
GV: glycaemic variability; AMI: Acute myocardial infarction; STEMI: ST-segment elevation myocardial infarction; ACS: Acute coronary syndrome; DM: diabetes mellitus; CAD: Coronary artery disease; CVD: Cardiovascular disease; MAGE: Mean amplitude of glycemic excursion; SD: Standard deviation; MBG: Mean blood glucose; CGMS: Continuous glucose monitoring system; SMBG: Self-monitoring of blood glucose; T3: T1-T2: Comparison between the third and the other two-tertiles; e-GFR: Estimated glomerular filtration rate; TC: Total cholesterol; TG: Total triglycerides; HDL-C: High-density lipoprotein cholesterol; HbA1c: hemoglobin A1c; cTnI: Cardiac troponin I; hs-CRP: High sensitivity C-reactive protein; GA: Glycated albumin; BGL: Blood glucose level; BNP: Brain natriuretic peptide; NT-pro BNP: N-terminal pro-brain natriuretic peptide; LVEF: Left ventricular ejection fraction; LVEDD: Left ventricular end diastolic diameter; HR: Heart rate; PCI: Percutaneous coronary intervention; BMI: Body mass index; GRACE: Global Registry of Acute Coronary Events; TIMI: Thrombolysis in myocardial infarction.
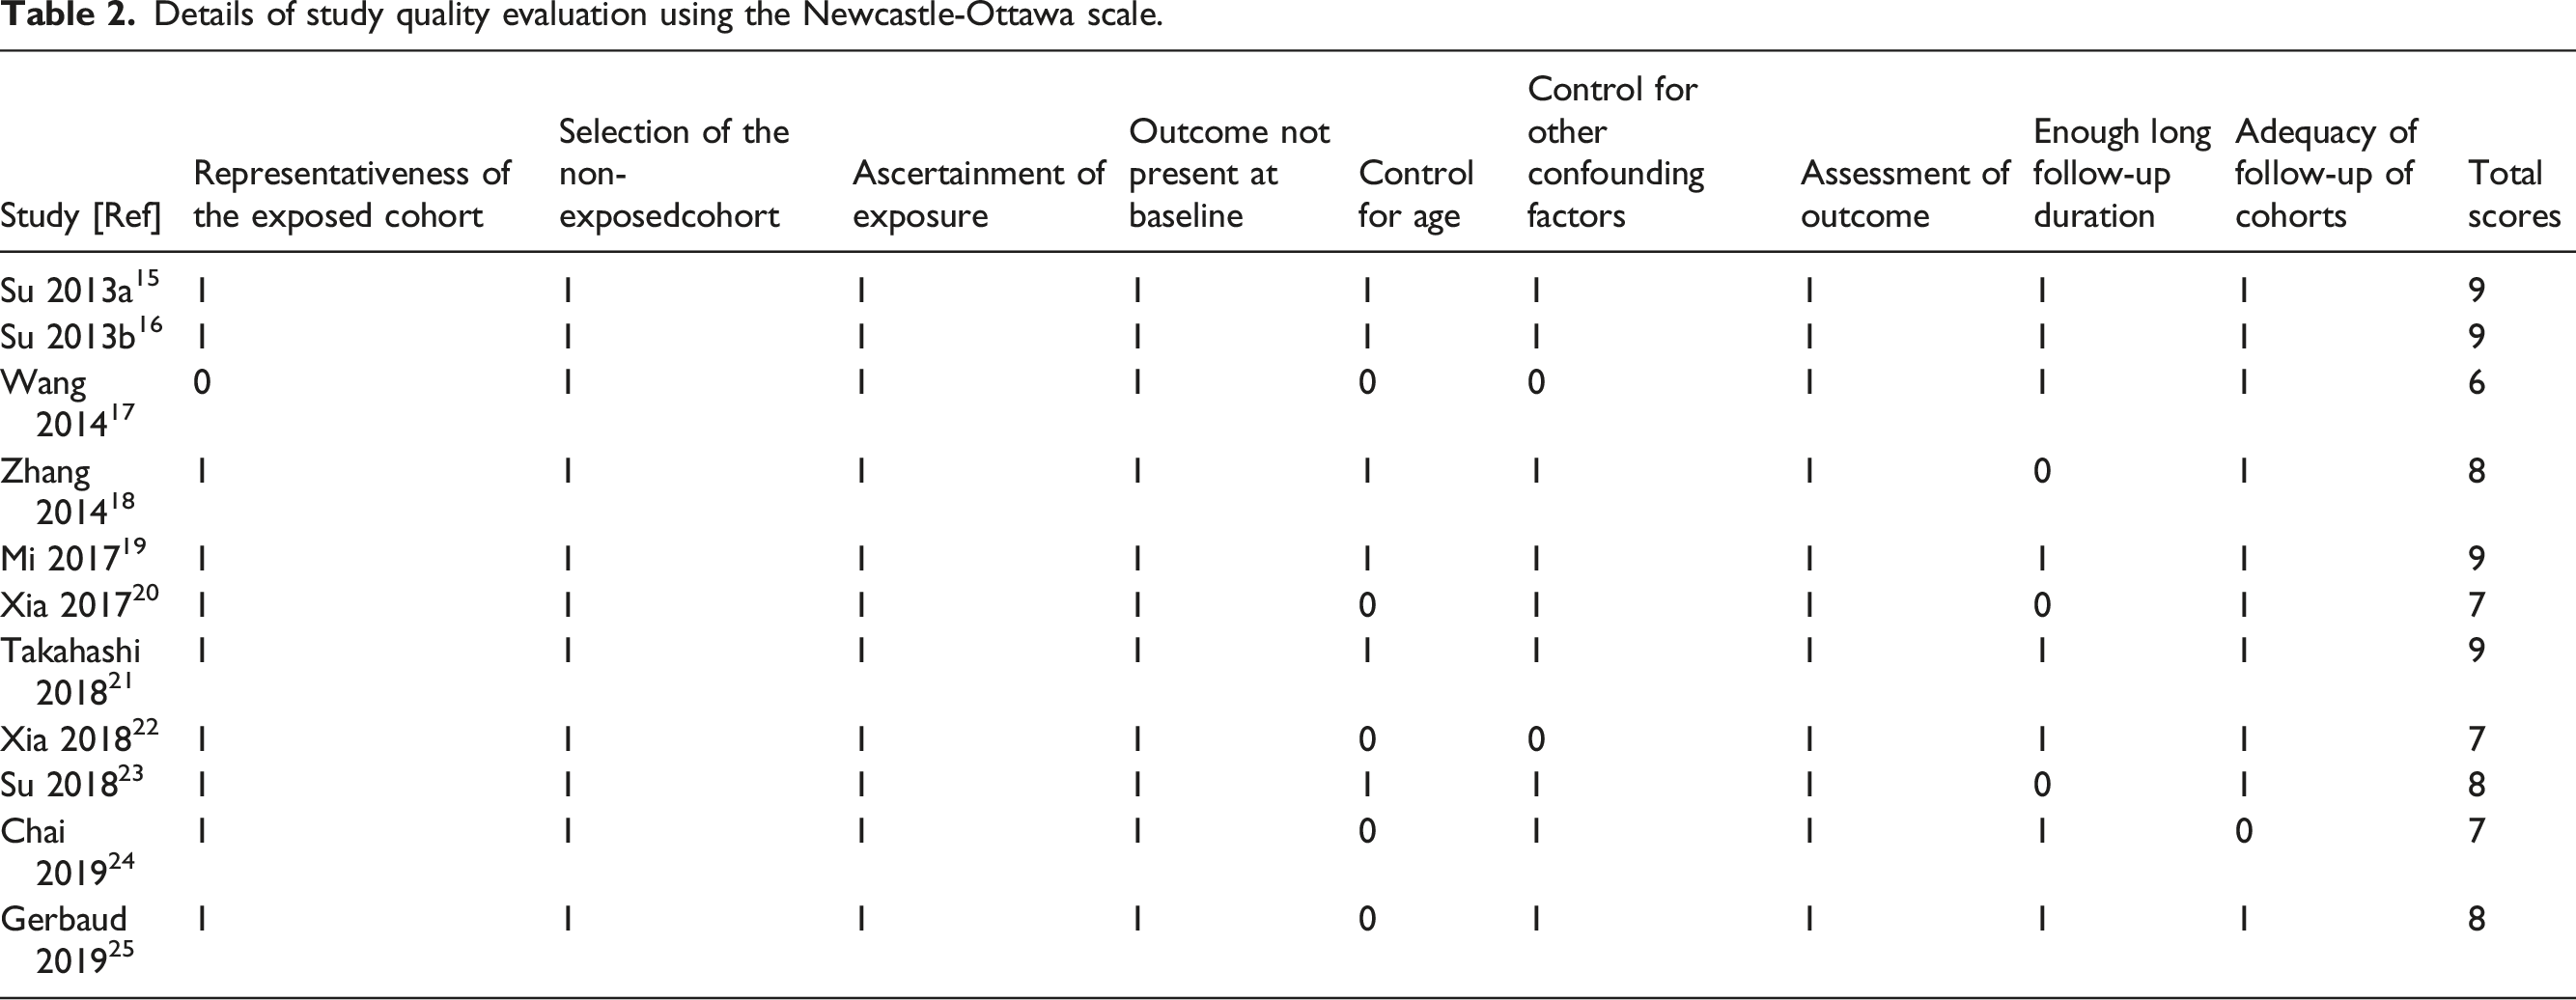
Details of study quality evaluation using the Newcastle-Ottawa scale.
Association between MAGE and prognosis in ACS patients
A total of eight prospective datasets15–19,21,22,24 reported the association between MAGE and incidence of adverse cardiovascular events in ACS patients. There was no significant heterogeneity among studies (I2 = 19%, p for Cochrane’s Q test = 0.26). The pooled results using a random-effect model showed the incidence of adverse cardiovascular events was linked to higher MAGE in patients with ACS (RR = 1.82, 95% CI: 1.46 to 2.26, p < 0.001; Figure 2(a)). Sensitivity analyses were carried out to assess whether the results were heterogeneous by excluding one study at a time (RR: 1.62 to 2.09, p all < 0.05). Subgroup analysis showed consistent findings that neither diabetic status, nor adjustment for glycated hemoglobin, nor follow-up time changed the results (Table 3). Forest plot of the relationship between MAGE or SD and adverse cardiovascular events in acute coronary syndrome. (a): Analysis usingMAGE; (b): Analysis using SD. MAGE: mean amplitude of glycemic excursion; SD: standard deviation. Subgroup analysis of the association of MAGE and adverse cardiovascular events during follow-up in ACS patients.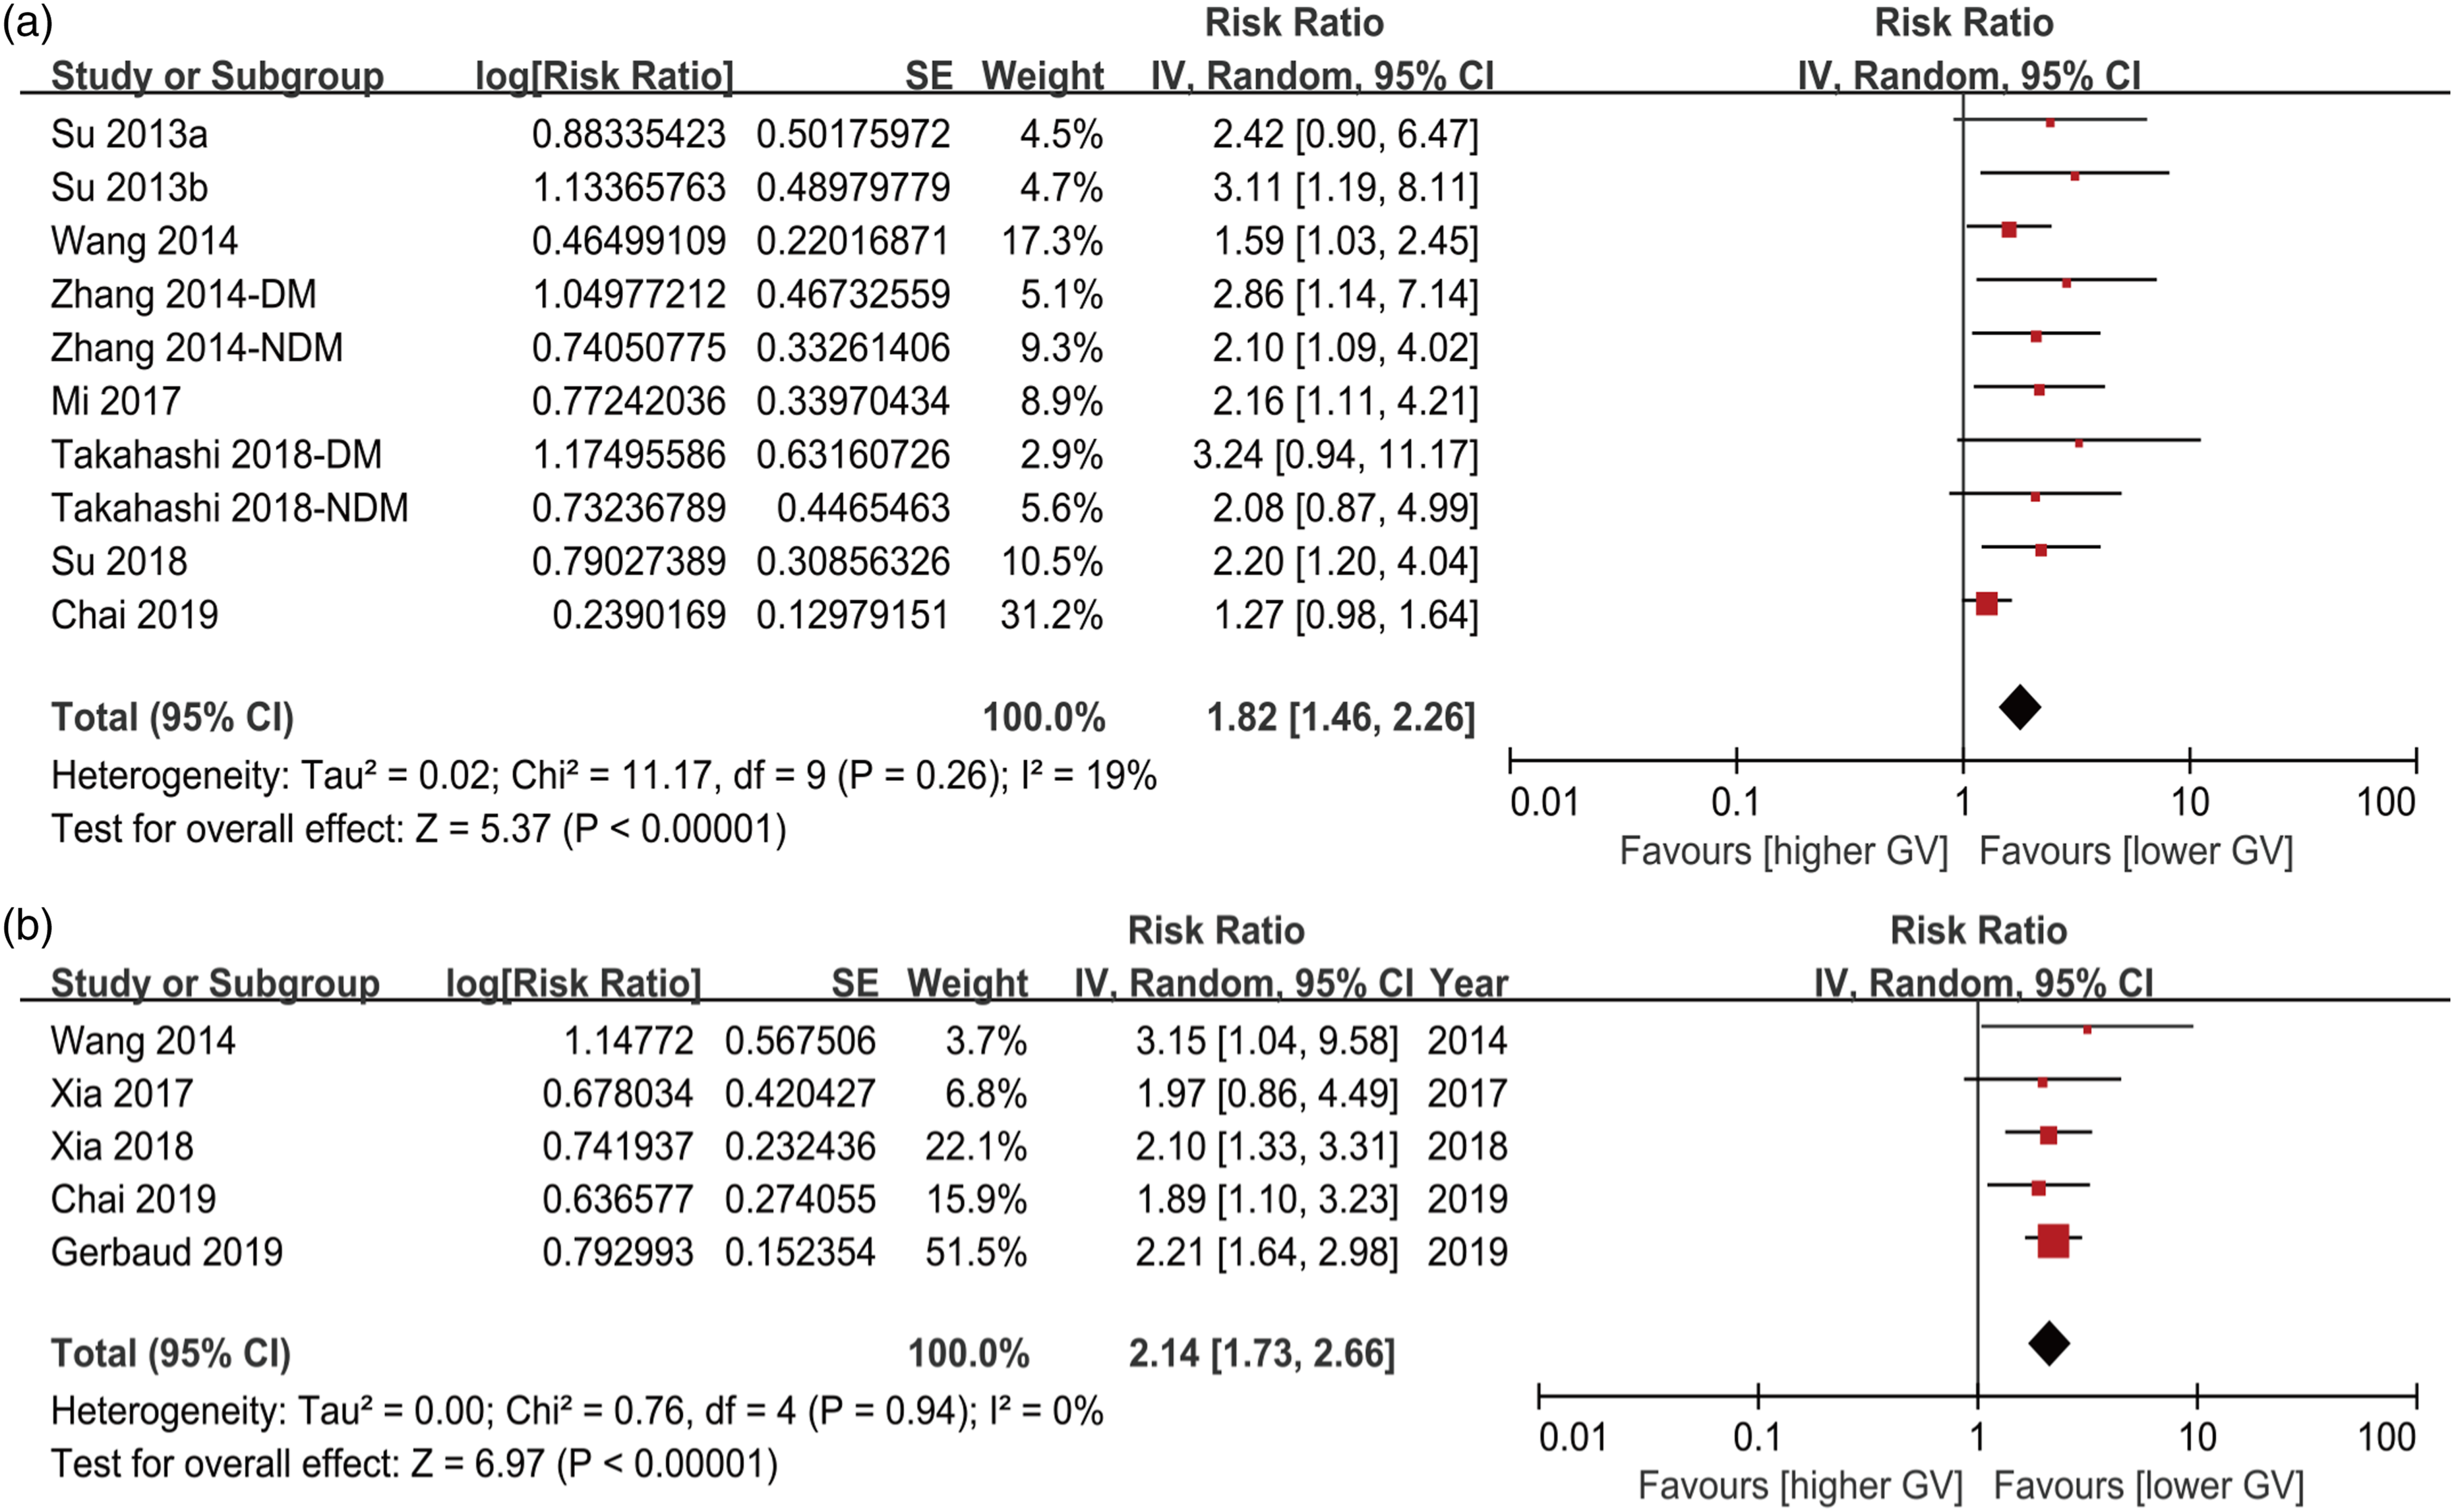
Association between SD and prognosis in ACS patients
SD was measured in five datasets from five studies.17,20,23–25 No significant heterogeneity (I2 = 0%, p for Cochrane’s Q test = 0.94) was found among five studies which use SD to assess the GV. The pooled result also showed significant difference between higher SD groups and lower SD groups (RR = 2.14, 95% CI: 1.73 to 2.66, p < 0.001; Figure 2(b)). Sensitivity analyses did not appreciably change the results (RR: 2.07 to 2.19, p all < 0.05).
Publication bias
The funnel plots regarding the associations between glycaemic variability measured by MAGE and SD and the risk of adverse cardiovascular events in ACS patients are shown in Figure 3(a) and (b). The plots of MAGE were asymmetrical on visual inspection, suggesting the presence of publication bias. Furthermore, Begg’s and Egger’s test also indicted the publication bias (all p = 0.000). Accordingly, we further conducted a trim and fill analysis to assess the stability of overall relative risk (Figure 3(c)). After incorporating these five studies, meta-analysis revealed a slightly weaker results than the reported originally (RR = 1.568, 95% CI: 1.255 to 1.959, p < 0.05). Funnel plots for publication bias of the meta-analyses for the association between glycaemic variability and risk of adverse cardiovascular events. (a): Analysis with MAGE; (b): Analysis with SD; (c): Trim-and-fill analysis for the association between MAGE and incidence of adverse cardiovascular events; The included studies are illustrated as round, while the imputed studies are the squares. MAGE: mean amplitude of glycemic excursion; SD: standard deviation.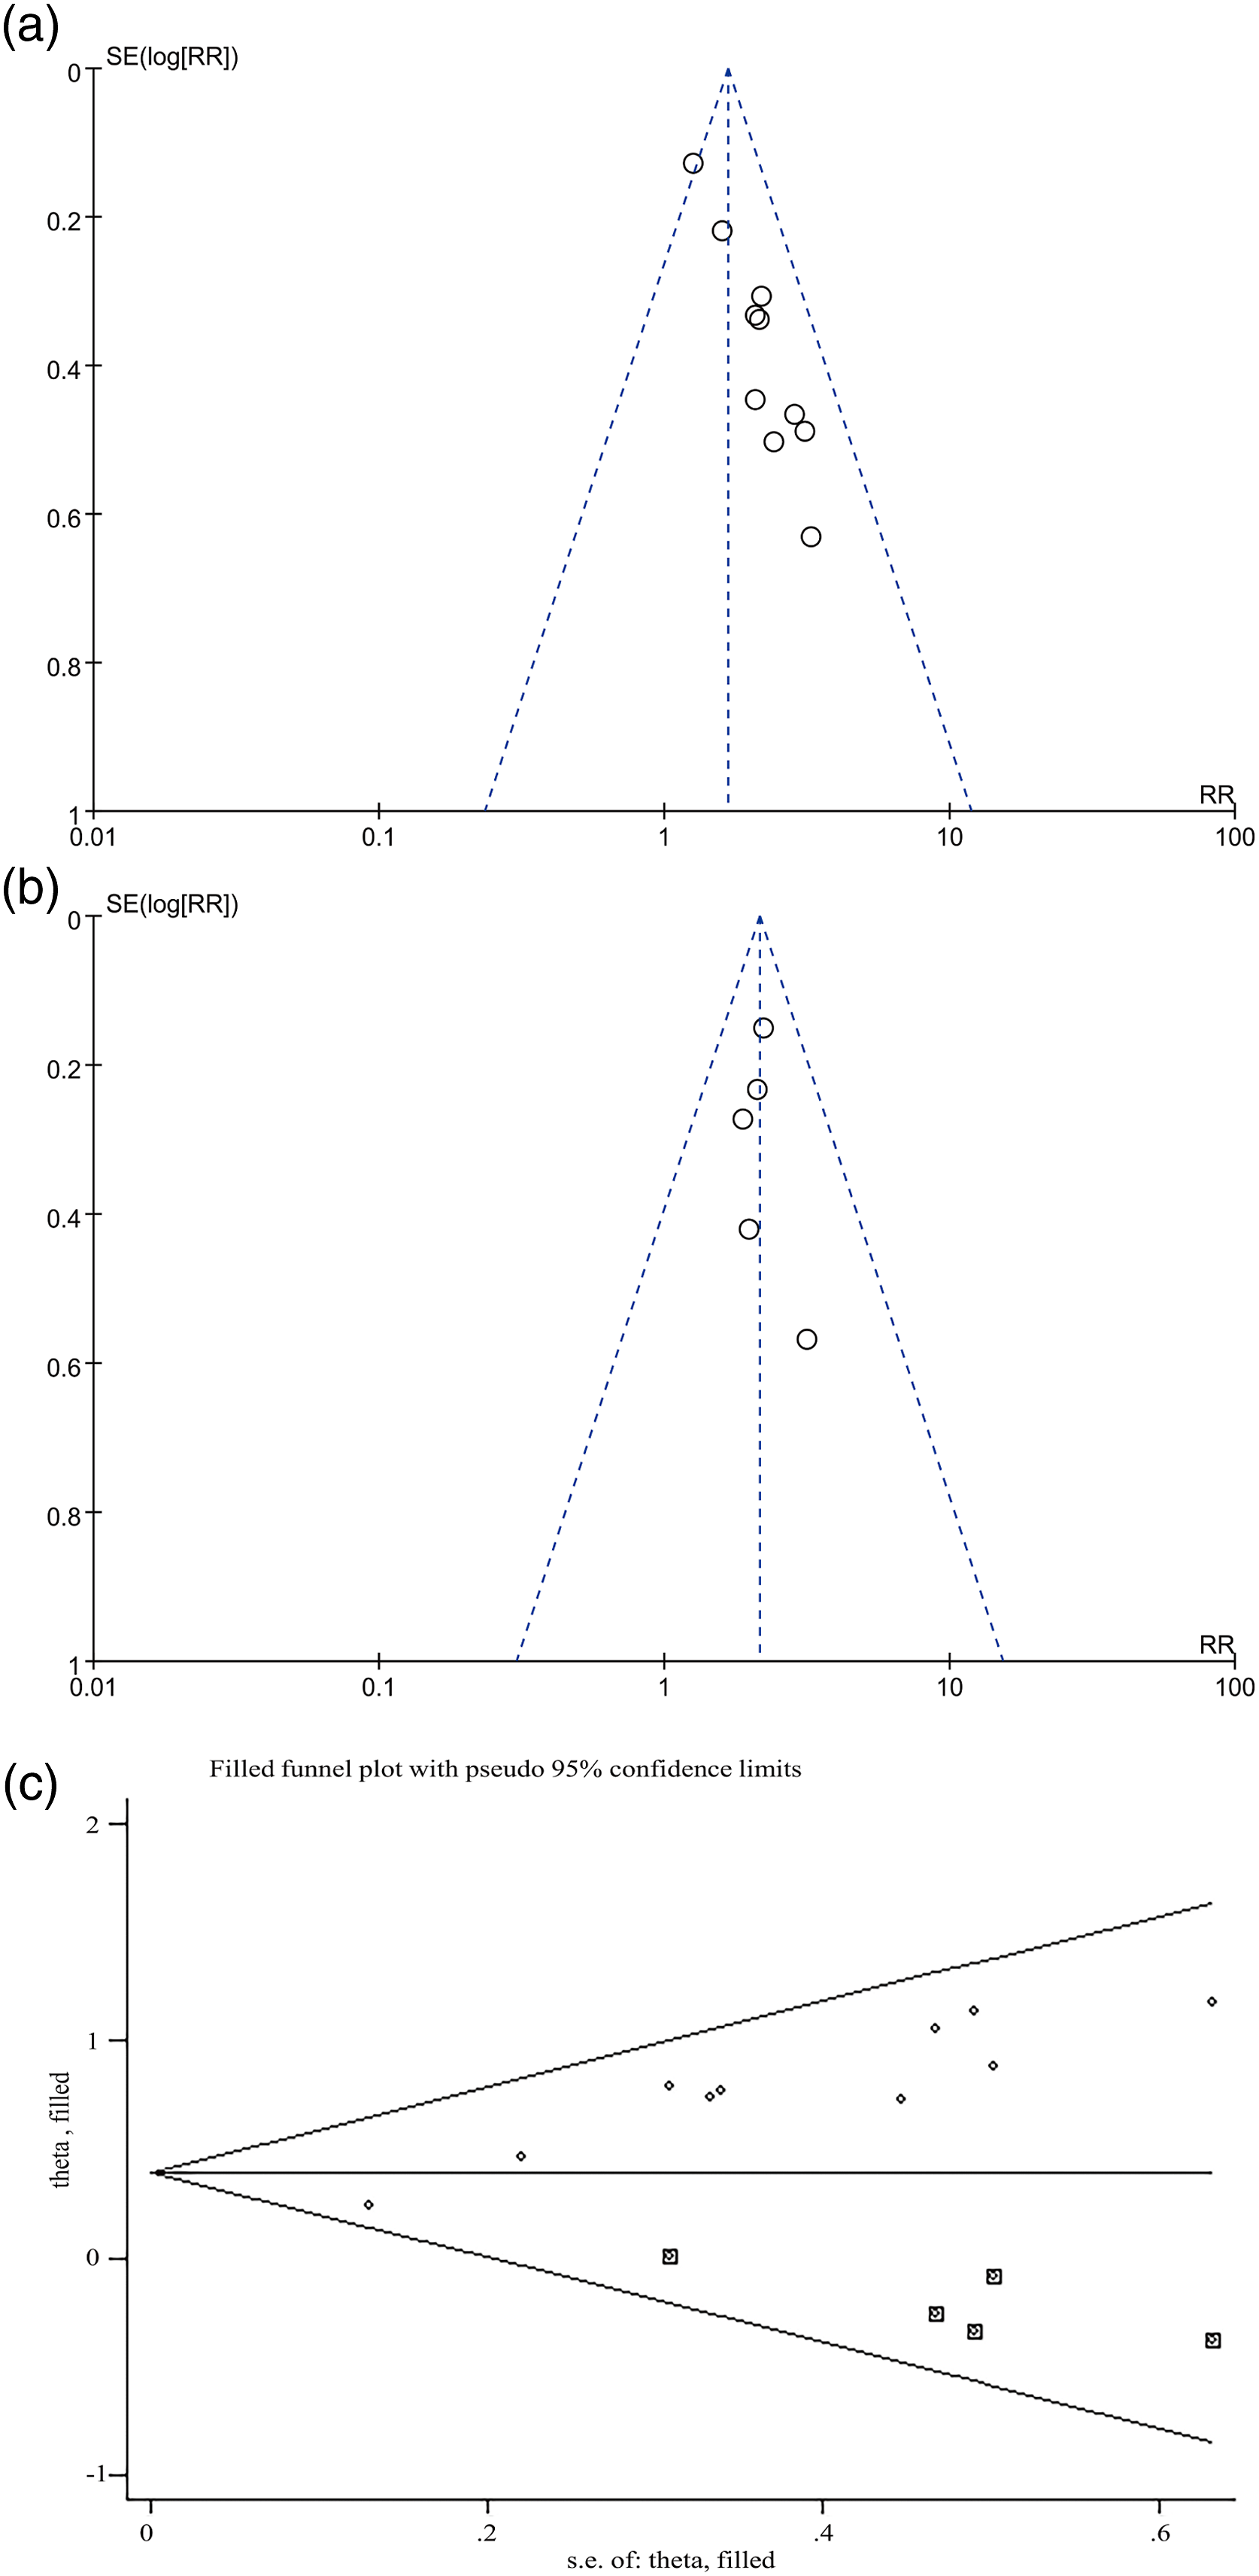
Discussion
It has been well acknowledged dysglycemia contribute to an increased risk of adverse cardiovascular events in patients with acute coronary syndrome over several decades. Growing attention has been focused on glycaemic variability, and many studies have demonstrated that GV is correlated with an increased risk of cardiovascular complications.9,11,34 This meta-analysis, which included 11 studies, showed that high glycaemic variability increased the incidence of adverse cardiovascular events in ACS patients no matter using MAGE or SD. Moreover, the robustness of the results was verified using sensitivity analyses. Though there was a certain publication bias when using MAGE as an index of glycaemic variability in meta-analysis, the over-all effects did not change significantly after using trim-and-fill analysis. Subgroup analysis did not alter the relationship between MAGE and adverse cardiovascular events in patients with ACS, confirming the robustness of the results.
Glycaemic variability is classified into two main categories: including short-term glycaemic variability based on CGMS or SMBG and long-term glycaemic variability, as measured by changes in HbA1c and FPG. 4 Many studies had evaluated whether GV was directly related to the occurrence and adverse prognosis of ACS patients.6,34,35 A recent meta-analysis showed that there was a negative association between GV and myocardial infarction. 27 Nevertheless, this meta-analysis did not conduct stratified analysis according to different index of glucose variability because of the small number of studies. Subsequently, higher fasting plasma glycaemic variability, an indicator of chronic glycaemic variability, was confirmed to be linked to the increase in lifetime risk of cardiovascular disease, including participants without cardiovascular disease aged 18–98 years with a median follow-up of 7.0 years. 10 Another recent meta-analysis showed that GV was associated with poor prognosis in coronary heart disease, but this study only used MAGE calculated using CGMS during hospitalization as an indicator of GV. 36 Herein, our results expanded these findings. We used MAGE and SD indicators to verify the relationship between glucose variability and adverse cardiovascular events in patients with ACS. In addition, a recent prospective study followed up for 12 years also suggested that the relative risk of all-cause mortality in the highest CV-FPG group was 1.41 (95% CI: 1.15 – 1.73), compared to the hypoglycemic fluctuation group in prediabetes and type 2 diabetes. 37 Based on the available evidence, GV may be an important risk factor for the development and progression of ACS.
The mechanism of an increased risk of adverse cardiovascular events in patients with acute coronary syndrome is not yet clear. It has been suggested that GV, in addition to the conventional indices of FPG and HbA1c, is independently associated with the lipid core formation and instability of vulnerable plaques in diabetes and non-diabetes38–40 through intravascular imaging modalities. Additionally, previous studies evidenced that GV can accelerate oxidative stress, 41 inflammatory cytokine release42,43 and vascular endothelial dysfunction, which can further lead to coronary vascular abnormalities and consequently to coronary heart disease. 44 Thus, more studies are needed to focus on the potential mechanism underlying to prevent the deleterious effects of GV on adverse cardiovascular events in patients with ACS.
This systematic review has a few limitations. First, this meta-analysis was the small number of studies included; Second, there was a possibility of publication bias that may have influenced the result when MAGE was used as an indicator to meta-analysis. Third, we only used MAGE and SD as indicators of glycaemic variability in this review due to limited studies.
Conclusion
Our study indicated that increased GV might be associated with adverse cardiovascular events in patients with ACS. However, more well-designed prospective studies should be performed in the future.
Key messages
• Glycaemic variability is gradually becoming an important indicator of glycemic management, and the relationship between glycaemic variability and prognosis in patients with acute coronary syndrome is still unclear. • Limited data from the systematic review demonstrates that increased glycaemic variability in patients with acute coronary syndrome may lead to poor prognosis. • Patients with acute coronary syndrome should not only control their average blood glucose, but also avoid glycaemic variability.
Footnotes
Declaration of Conflicting of Interests
The authors declared no potential conflicts of interest with respect to the research, authorship, and/or publication of this article.
Funding
The authors disclosed receipt of the following financial support for the research, authorship, and/or publication of this article: This study was funded in part by the National Natural Science Foundation of China (No.81770331).
Data availability
The datasets used and/or analyzed during the current study are available from the corresponding author on reasonable request.