
Abstract
Aims:
The objective of this study was to explore the effects of epigallocatechin-3-gallate (EGCG) on type 2 diabetes mellitus (T2DM).
Main methods:
Male Sprague–Dawley rats were allocated into six groups. The control group received a conventional diet. The diabetic group received a high-sucrose high-fat (HSHF) diet for 4 weeks and then was fasted and injected with streptozotocin (STZ); subsequently, the rats received a HSHF diet for another 4 weeks to develop diabetes. The four treatment groups were diabetic rats that received intragastric metformin (500 mg/kg/day) or EGCG (25, 50, and 100 mg/kg/day) for 10 weeks. All groups except the control group received a HSHF diet throughout the experiment. Several biochemical parameters such as fasting blood glucose (FBG), postprandial blood glucose (PBG), liver glycogen, muscle glycogen, fasting serum insulin (FSI), homeostasis model of insulin resistance (HOMA-IR), total cholesterol (TC), triglycerides (TG), high-density lipoprotein cholesterol (HDL-C), low-density lipoprotein cholesterol (LDL-C), free fatty acids (FFA), superoxide dismutase (SOD), and malondialdehyde (MDA) were measured to assess the effects of EGCG on glycemic control, insulin resistance, lipid profile, and oxidative stress. Furthermore, oxidative stress in pancreatic islet β cells was detected by dihydroethidium staining.
Key findings:
A HSHF diet and STZ injection induced T2DM, as indicated by changed blood glucose and body weight, which was accompanied by insulin resistance, an altered lipid profile, and oxidative stress. Interestingly, EGCG treatment dose-dependently recovered these indexes.
Significance:
EGCG successfully ameliorated glycemic control and insulin sensitivity while reducing the lipid profile and oxidative stress in a T2DM rat model.
Keywords
Key messages
Epigallocatechin-3-gallate can treat type 2 diabetes mellitus.
Introduction
According to the eighth edition of the Global Diabetes Map released by the International Diabetes Federation (IDF), there are currently 425 million people with diabetes worldwide, and it is estimated that there will be nearly 700 million people with diabetes by 2045. Among them, patients with type 2 diabetes mellitus (T2DM) account for more than 90%. 1 T2DM significantly increases the financial burden of the world. T2DM is mainly characterized by elevated blood sugar, which can damage insulin signaling and cause insulin resistance. 2 Clinically, insulin injections or oral hypoglycemic drugs are typically used to control the development of T2DM, 3 but new hypoglycemic drugs are needed.
Insulin resistance is the main pathogenesis of T2DM. Insulin resistance refers to decreasing insulin sensitivity and/or insulin secretion. Recent studies in patients with T2DM demonstrated that indices of oxidative stress were increased, 4 the antioxidant defense system was weakened, and islet β cells were more vulnerable to oxidative damage and apoptosis than other cells, thus inhibiting insulin secretion and causing insulin resistance. 4 Oxidative stress can also affect sugar and lipid metabolism, resulting in metabolic disorders. Additionally, oxidative stress can promote the release of inflammatory factors and lead to vascular endothelial injury, resulting in atherosclerosis. 5
Tea originates in China and has a long history. In recent years, tea has been studied extensively, and tea polyphenols are the main active ingredients. Epigallocatechin-3-gallate (EGCG) is a catechin monomer isolated from tea and the component with most biological activity among tea polyphenols. Ueda-Wakagi, Manabu et al. Green Tea Ameliorates Hyperglycemia by Promoting the Translocation of Glucose Transporter 4 in the Skeletal Muscle of Diabetic Rodents. 6 EGCG has several beneficial effects, including preventing free radical damage, anti-cancer, and anti-oxidative activities, 7 as well as benefits for improving glucose and lipid metabolism 8 and exerting cardiovascular protection 9 ; therefore, EGCG has potential developmental significance for the treatment of T2DM. 10 EGCG can scavenge oxygen free radicals and regulate fatty acid intake and lipid metabolism 11 and also increase fat oxidation and lipolysis. 12 Animal and cellular studies have shown that EGCG can improve or enhance insulin sensitivity, 13 thus changing the redox state of cells. In addition, adipocytes are highly sensitive to EGCG. By uptaking EGCG, adipocytes can control lipid metabolism and reduce overall body mass by increasing lipid excretion, reducing fat absorption, activating sympathetic nervous activity, and promoting lipid oxidation and decomposition. Therefore, EGCG modulates blood lipids, blood glucose, oxidative stress, and insulin resistance.
Nevertheless, little is known about the effects of EGCG in models of diabetes. Therefore, the current study was performed to investigate the effects of EGCG on blood glucose, blood lipids, oxidative stress, and insulin resistance in diabetic rats.
Materials and methods
Animals
Age-matched, male Sprague–Dawley rats (SCXK (豫) 2017-0001) weighing 150 to 180 g were obtained from the Laboratory Animal Center, Zhengzhou University, China. All experimental protocols were administrated in strict accordance with the Guidance of the Laboratory Animal Center of Henan Province, Xinxiang Medical University.
Rats were maintained at 25°C under a 12-h light/12-h dark cycle. After a 1-week adaptation period, animals with a body weight of 180 ± 15 g were randomized into six groups (n = 6–8 per group). The animal experiments are detailed in Table 1.
Animal experimental treatments.
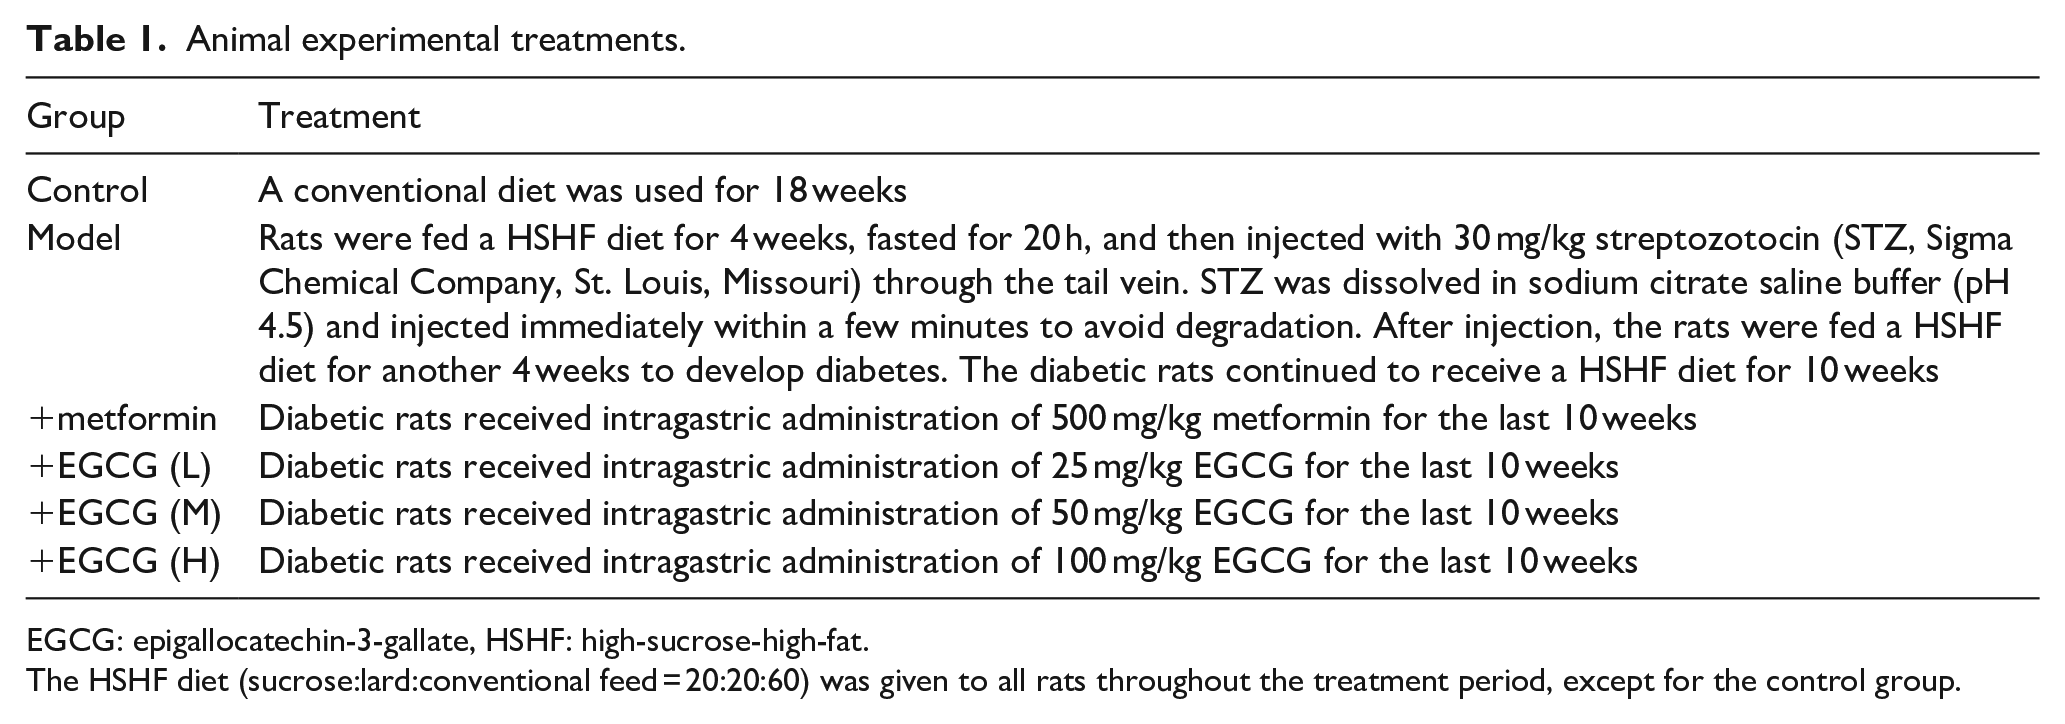
EGCG: epigallocatechin-3-gallate, HSHF: high-sucrose-high-fat.
The HSHF diet (sucrose:lard:conventional feed = 20:20:60) was given to all rats throughout the treatment period, except for the control group.
Tissue harvesting
The bodyweights of all rats were measured each week during the experimental period. At the end of the 18-week study period, all animals were killed by cervical dislocation, and the liver, skeletal muscle, and pancreas were collected. Blood was collected via cardiac puncture and centrifuged at 4000 rpm for 15 min at 4°C to isolate serum. Both serum and part of the tissue samples were stored in the freezer at −80°C for biochemical analysis. The remaining part of the freshly isolated pancreas was used for dihydroethidium staining.
Metabolic parameters
Fasting blood glucose (FBG) and postprandial blood glucose (PBG) levels were measured each week during the experimental period using a blood glucometer (One Touch®UltraVue, Johnson & Johnson Medical Ltd., Shanghai). Serum glycosylated hemoglobin A1c (HbA1c) levels were estimated by the method described by Wolfram S, et al., 10 and muscle and hepatic HbA1c levels were determined according to the method provided by Macauley et al. 11 Fasting serum insulin (FSI) levels were evaluated using a rat insulin enzyme-linked immunosorbent assay (ELISA) kit (Thermo Fisher Scientific, Waltham, USA) according to the manufacturer’s protocol. Homeostasis model of insulin resistance (HOMA-IR) is the gold standard for estimating insulin resistance and is derived using the following equation 11

Lipid profiles, cardiovascular risk indices, and antiatherogenic index (AAI)
Serum levels of total cholesterol (TC), triglycerides (TG), and high-density lipoprotein cholesterol (HDL-C) were determined using an automated blood analyzer (Bayer Corp. Kansas, USA) via a colorimetric method. Commercial kits for measuring TG (sensitivity, 10
Malondialdehyde and superoxide dismutase levels in pancreas homogenates
The pancreatic contents of malondialdehyde (MDA) and superoxide dismutase (SOD) were measured as follows. The pancreas was thawed, weighed, and homogenized with 0.9% saline. Then, the homogenate was centrifuged (12,000× rpm, 15 min, 4°C) and the supernatant was used immediately for measuring MDA and SOD levels with commercial kits (Nanjing Jiancheng Biological Engineering Institute, Nanjing, China).
Dihydroethidium staining
Reactive oxygen species (ROS) levels in the pancreas were measured using dihydroethidium. After harvesting, the pancreas was immediately embedded in optimum cutting temperature compound in liquid nitrogen. Unfixed frozen samples were cut into 5-μm thick sections and placed on glass slides. Dihydroethidium (10 μM) was applied to each tissue section, and then the sections were cover slipped. The slides were incubated in a dark humidified chamber at 37°C for 30 min. Ethidium fluorescence (excitation at 490 nm, emission at 610 nm) was examined by fluorescence microscopy (Olympus IX71, Tokyo, Japan).
Statistical analysis
SPSS software (Version 18) was used for statistical analyses. Data are expressed as mean ± SEM. Statistical analyses were performed using unpaired Student’s t-tests for two groups or one-way ANOVA with Newman–Student–Keuls tests for multiple comparisons. Differences were considered statistically significant when p < 0.05.
Results
Effect of EGCG on blood glucose
A high-sucrose high-fat diet and STZ injection resulted in detrimental effects on rat health. Specifically, the rats developed T2DM with a significant increase in FBG and PBG concentrations in serum (Figure 1(a) and (b)), a rise in fasting serum HbA1c levels (Figure 1(c)), and an decrease in muscle and liver glycogens (Figure 1(d)). However, after 10 weeks of metformin (500 mg/kg/day) or EGCG (25, 50, and 100 mg/kg/day) treatment, FBG, PBG, HbA1c, muscle and hepatic glycogen levels were decreased significantly compared with diabetic rats. Moreover, the hypoglycemic effect of EGCG (50 and 100 mg/kg/day) produced an equivalent or stronger effect than metformin in diabetic rats.
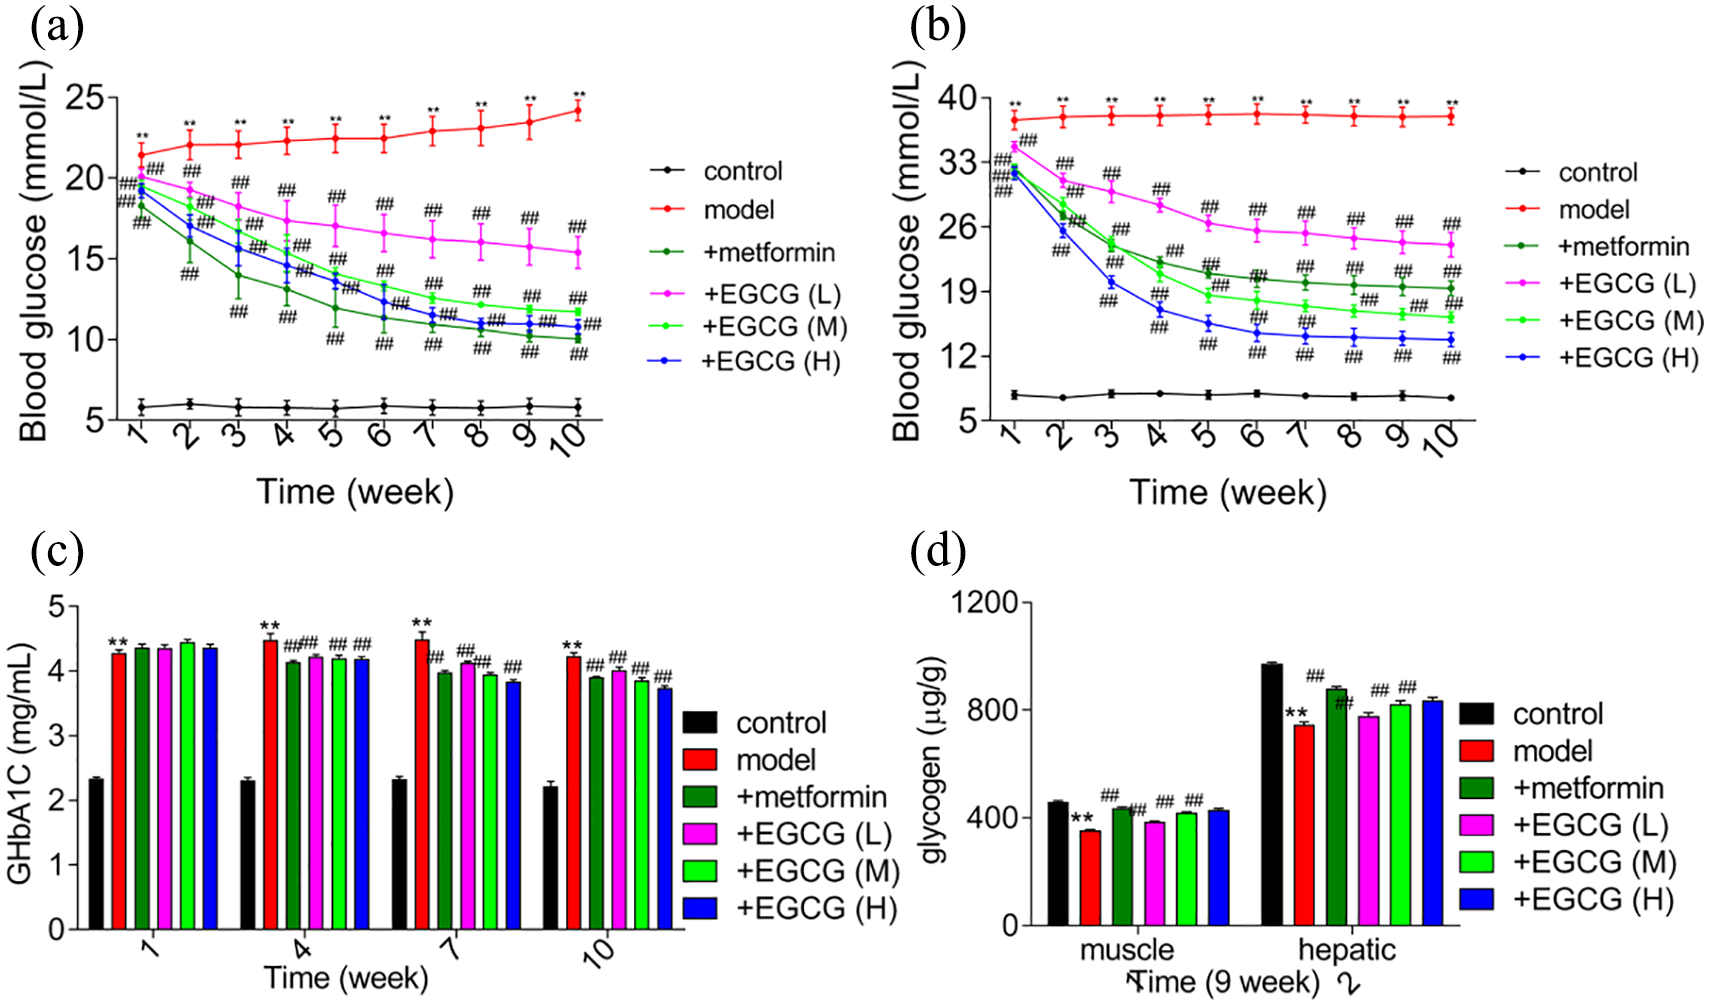
Effect of EGCG on (a) Fasting blood glucose. (b) Postprandial blood glucose. (c) HbA1c levels. (d) Muscle and hepatic glycogen levels in experimental rats.
Effect of EGCG on body weight, insulin levels, and insulin resistance
During the 10 weeks of treatment, the body weights of all experimental rats were recorded and are shown in Figure 2(a). During 10 weeks, there was a significant increase in body weight in diabetes rats. However, after treatment with metformin (500 mg/kg/day) and EGCG (25, 50, and 100 mg/kg/day), the body weight of rats decreased significantly compared with the diabetes group.
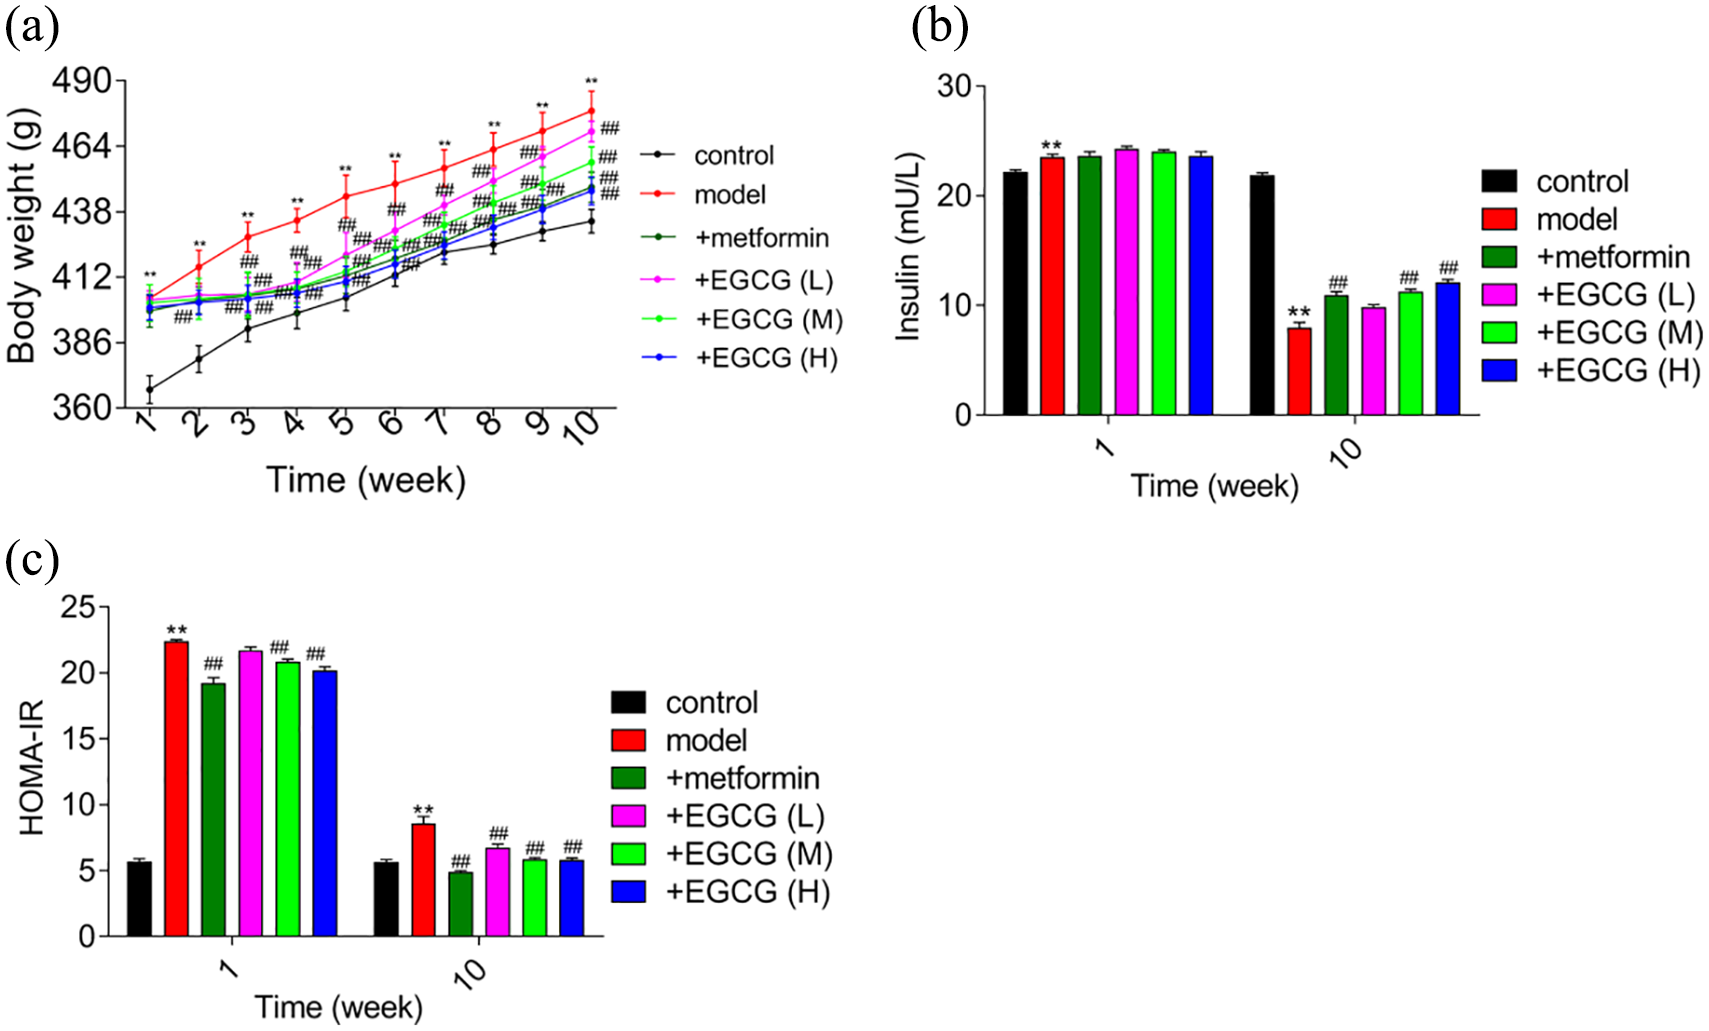
Effect of EGCG on body weight, insulin levels, and insulin resistance in experimental rats. (a) Body weight. (b) Insulin levels. (c) HOMA-IR.
Figure 2(b) and (c) show FSI levels and HOMA-IR values of all experimental groups. Insulin resistance was observed in the diabetes group, as evidenced by increased FSI and HOMA-IR values compared with the control group. After 1 week of treatment, metformin and EGCG had no effect on FSI. However, HOMA-IR values were decreased significantly by metformin or EGCG (50 and 100 mg/kg/day) treatment. With the progression of diabetes, FSI was reduced in the diabetes group. However, metformin or EGCG (25, 50, and 100 mg/kg/day) increased FSI levels compared with the diabetes group. In brief, FSI levels were decreased but HOMA-IR values remained high in the diabetes group; metformin (500 mg/kg/day) or EGCG (25, 50, and 100 mg/kg/day) elicited a significant increase in FSI and decline in HOMA-IR values.
Effect of EGCG on the lipid profile of experimental rats
Fasting TC, TG, HDL-C, LDL-C, VLDL-C, and free fatty acids (FFA) levels can also be used as indicators of diabetes. Figure 3 shows the blood lipid index data for all experimental rats in the first week and tenth week of treatment. TC, LDL-C, and FFA levels were decreased significantly in the EGCG (50 and 100 mg/kg/day) and metformin (500 mg/kg/day) groups, whereas HDL-C levels were increased significantly. However, as to TG and VLDL levels, neither metformin nor EGCG affected TG and VLDL levels in the first week treatment. In the tenth week of treatment, EGCG (100 mg/kg/day) and metformin (500 mg/kg/day) groups show significant effect on them.
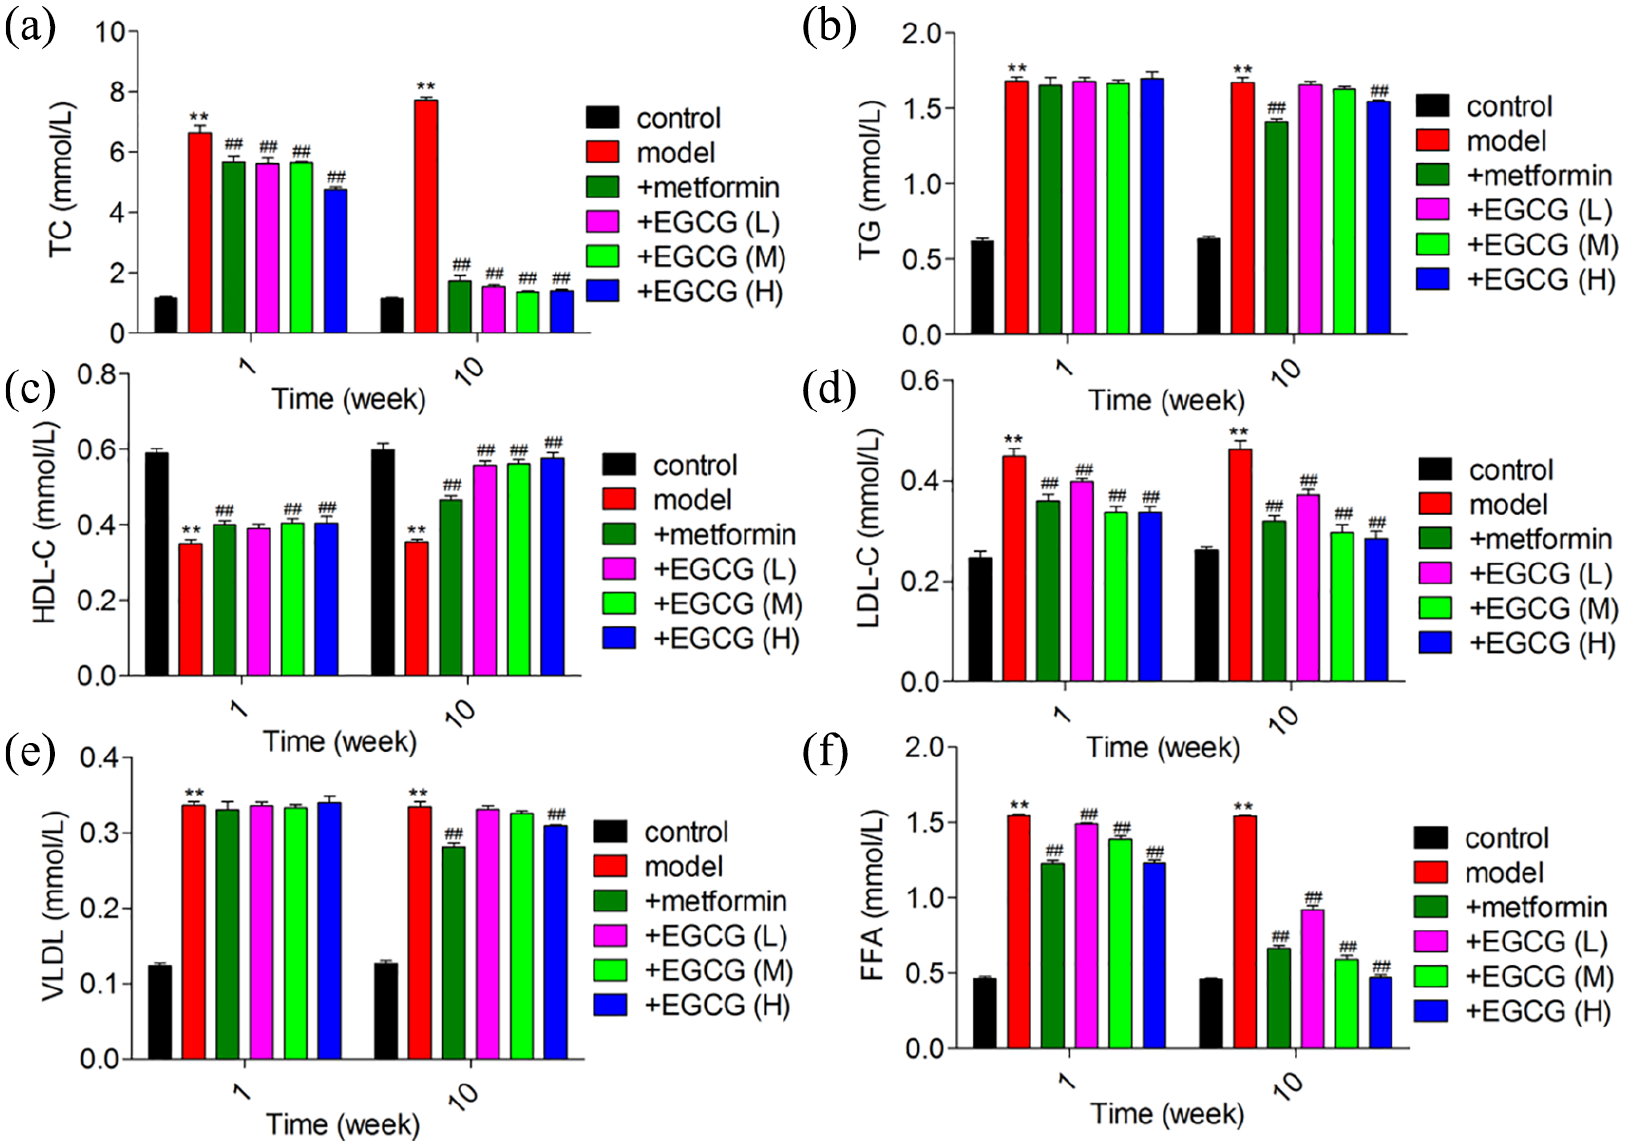
Effect of epigallocatechin-3-gallate (EGCG) on lipid profiles in experimental rats. (a) TC, (b) TG, (c) HDL-C, (d) LDL-C, (e) VLDL, (f) FFA levels of experimental rats.
Effect of EGCG on cardiovascular risk indices and AAI
Cardiovascular risk indices and AAI of all experimental groups are shown in Figure 4. After 10 weeks of high-sucrose high-fat feeding, cardiovascular risk indices (Figure 4(a) and (b)) and AAI were increased in diabetic versus control rats. However, oral administration of EGCG (100 mg/kg/day) and metformin (500 mg/kg/day) to diabetic rats markedly alleviated the altered cardiovascular risk indices and AAI. Moreover, EGCG (100 mg/kg/day) was closer to the normal group than metformin, which indicated that EGCG has an application prospect.
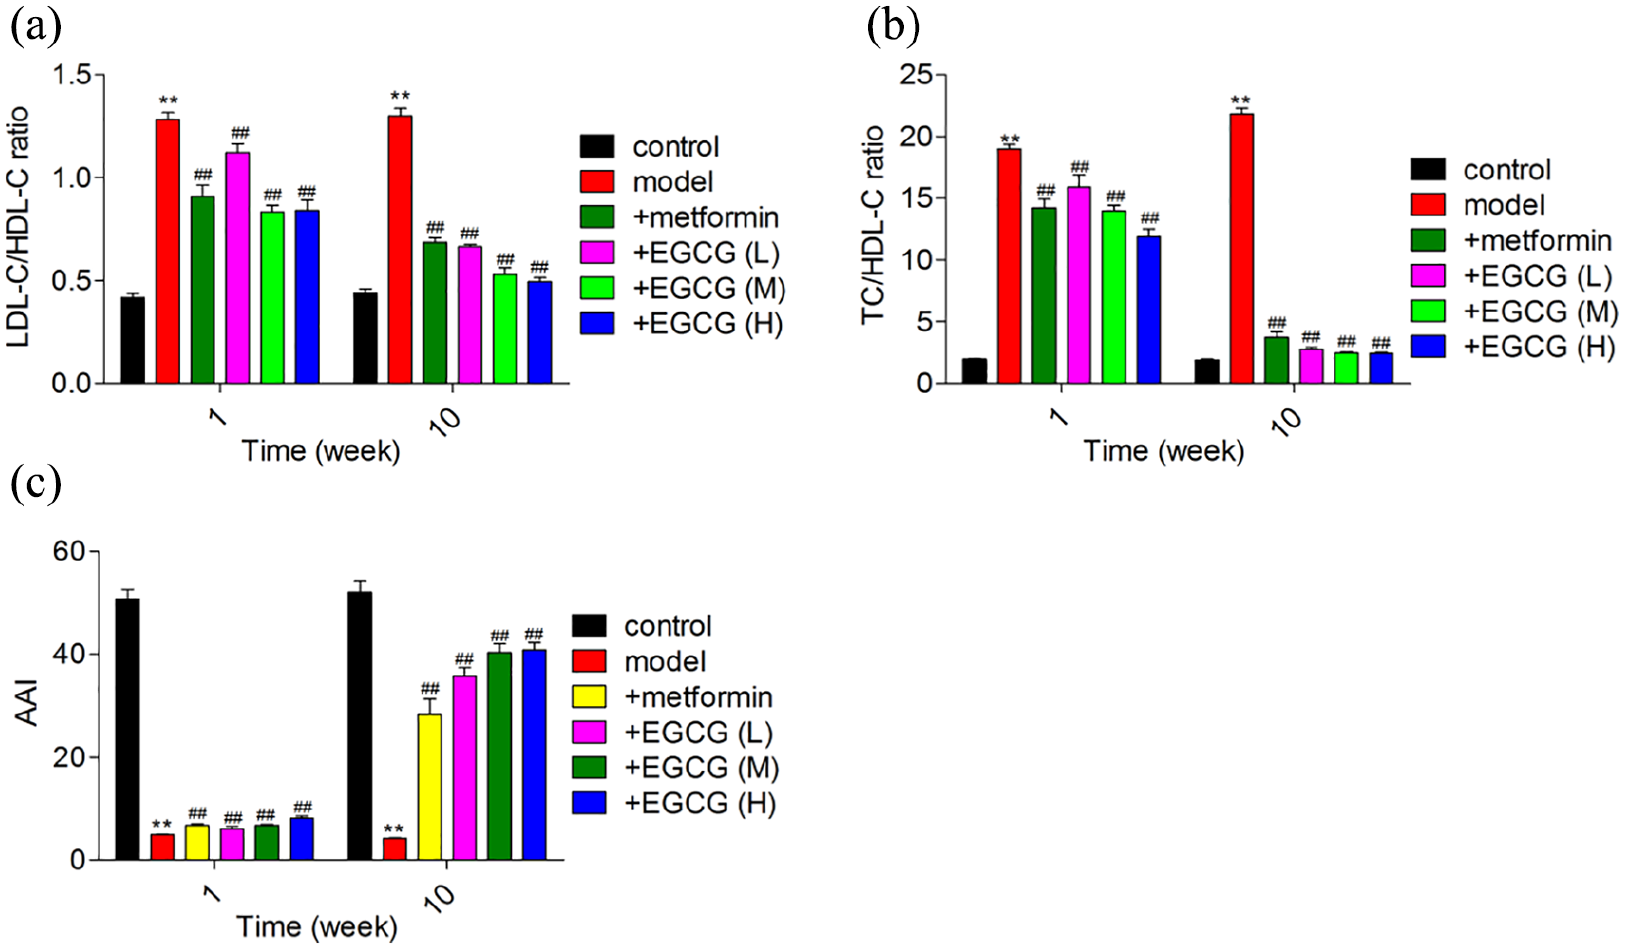
Effect of EGCG on cardiovascular risk indices and antiatherogenic index (AAI) in experimental rats. (a) LDL-C/HDL-C ratio, (b) TC/HDL-C ratio, (c) AAI of experimental rats.
Effect of EGCG on antioxidants
Figure 5 illustrates serum SOD and MDA levels after 10 weeks of high-sucrose high-fat feeding in all experimental groups. SOD (Figure 5(a)) levels were increased, whereas MDA (Figure 5(b)) levels were decreased in diabetic versus control rats. Oral administration of EGCG (100 mg/kg/day) and metformin (500 mg/kg/day) for 5 weeks significantly alleviated the changes in serum SOD and MDA levels in diabetic rats. Figure 6 demonstrates that ROS levels were increased significantly in diabetic rats compared with control rats. Ten weeks of metformin (500 mg/kg/day) or EGCG treatment decreased ROS levels, indicating that EGCG and metformin exhibited antioxidant activity.
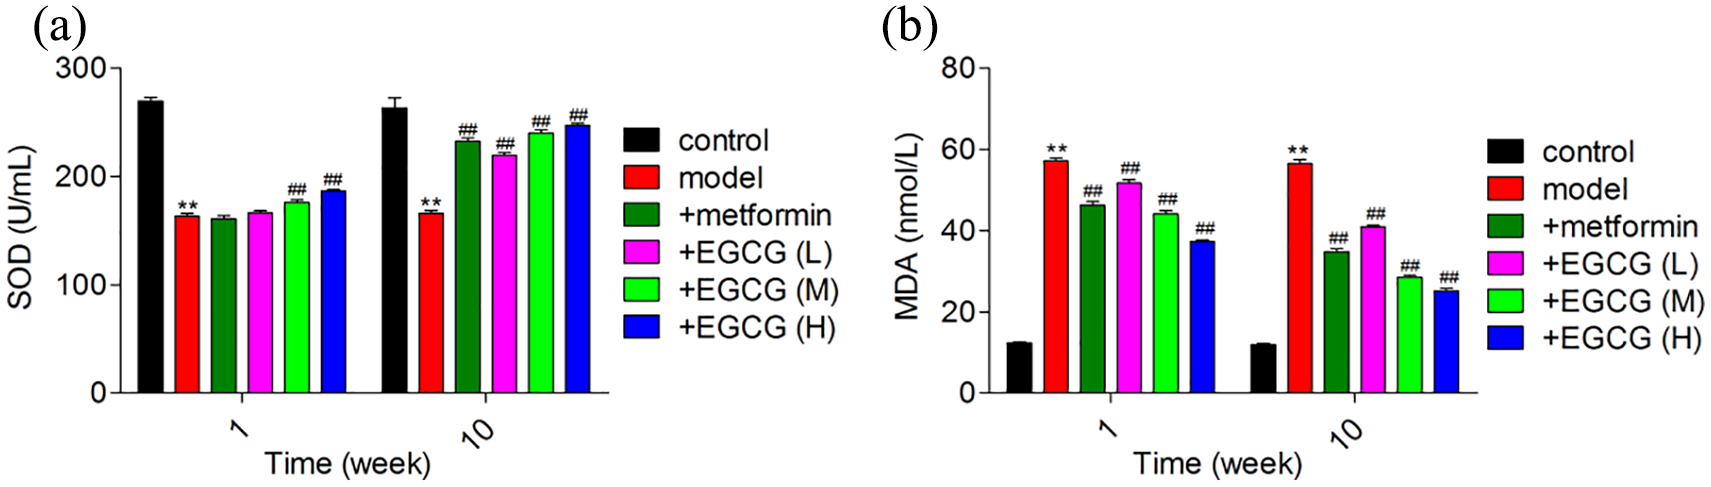
Effect of EGCG on SOD and MDA levels in experimental rats. (a) SOD and (b) MDA levels of experimental rats.
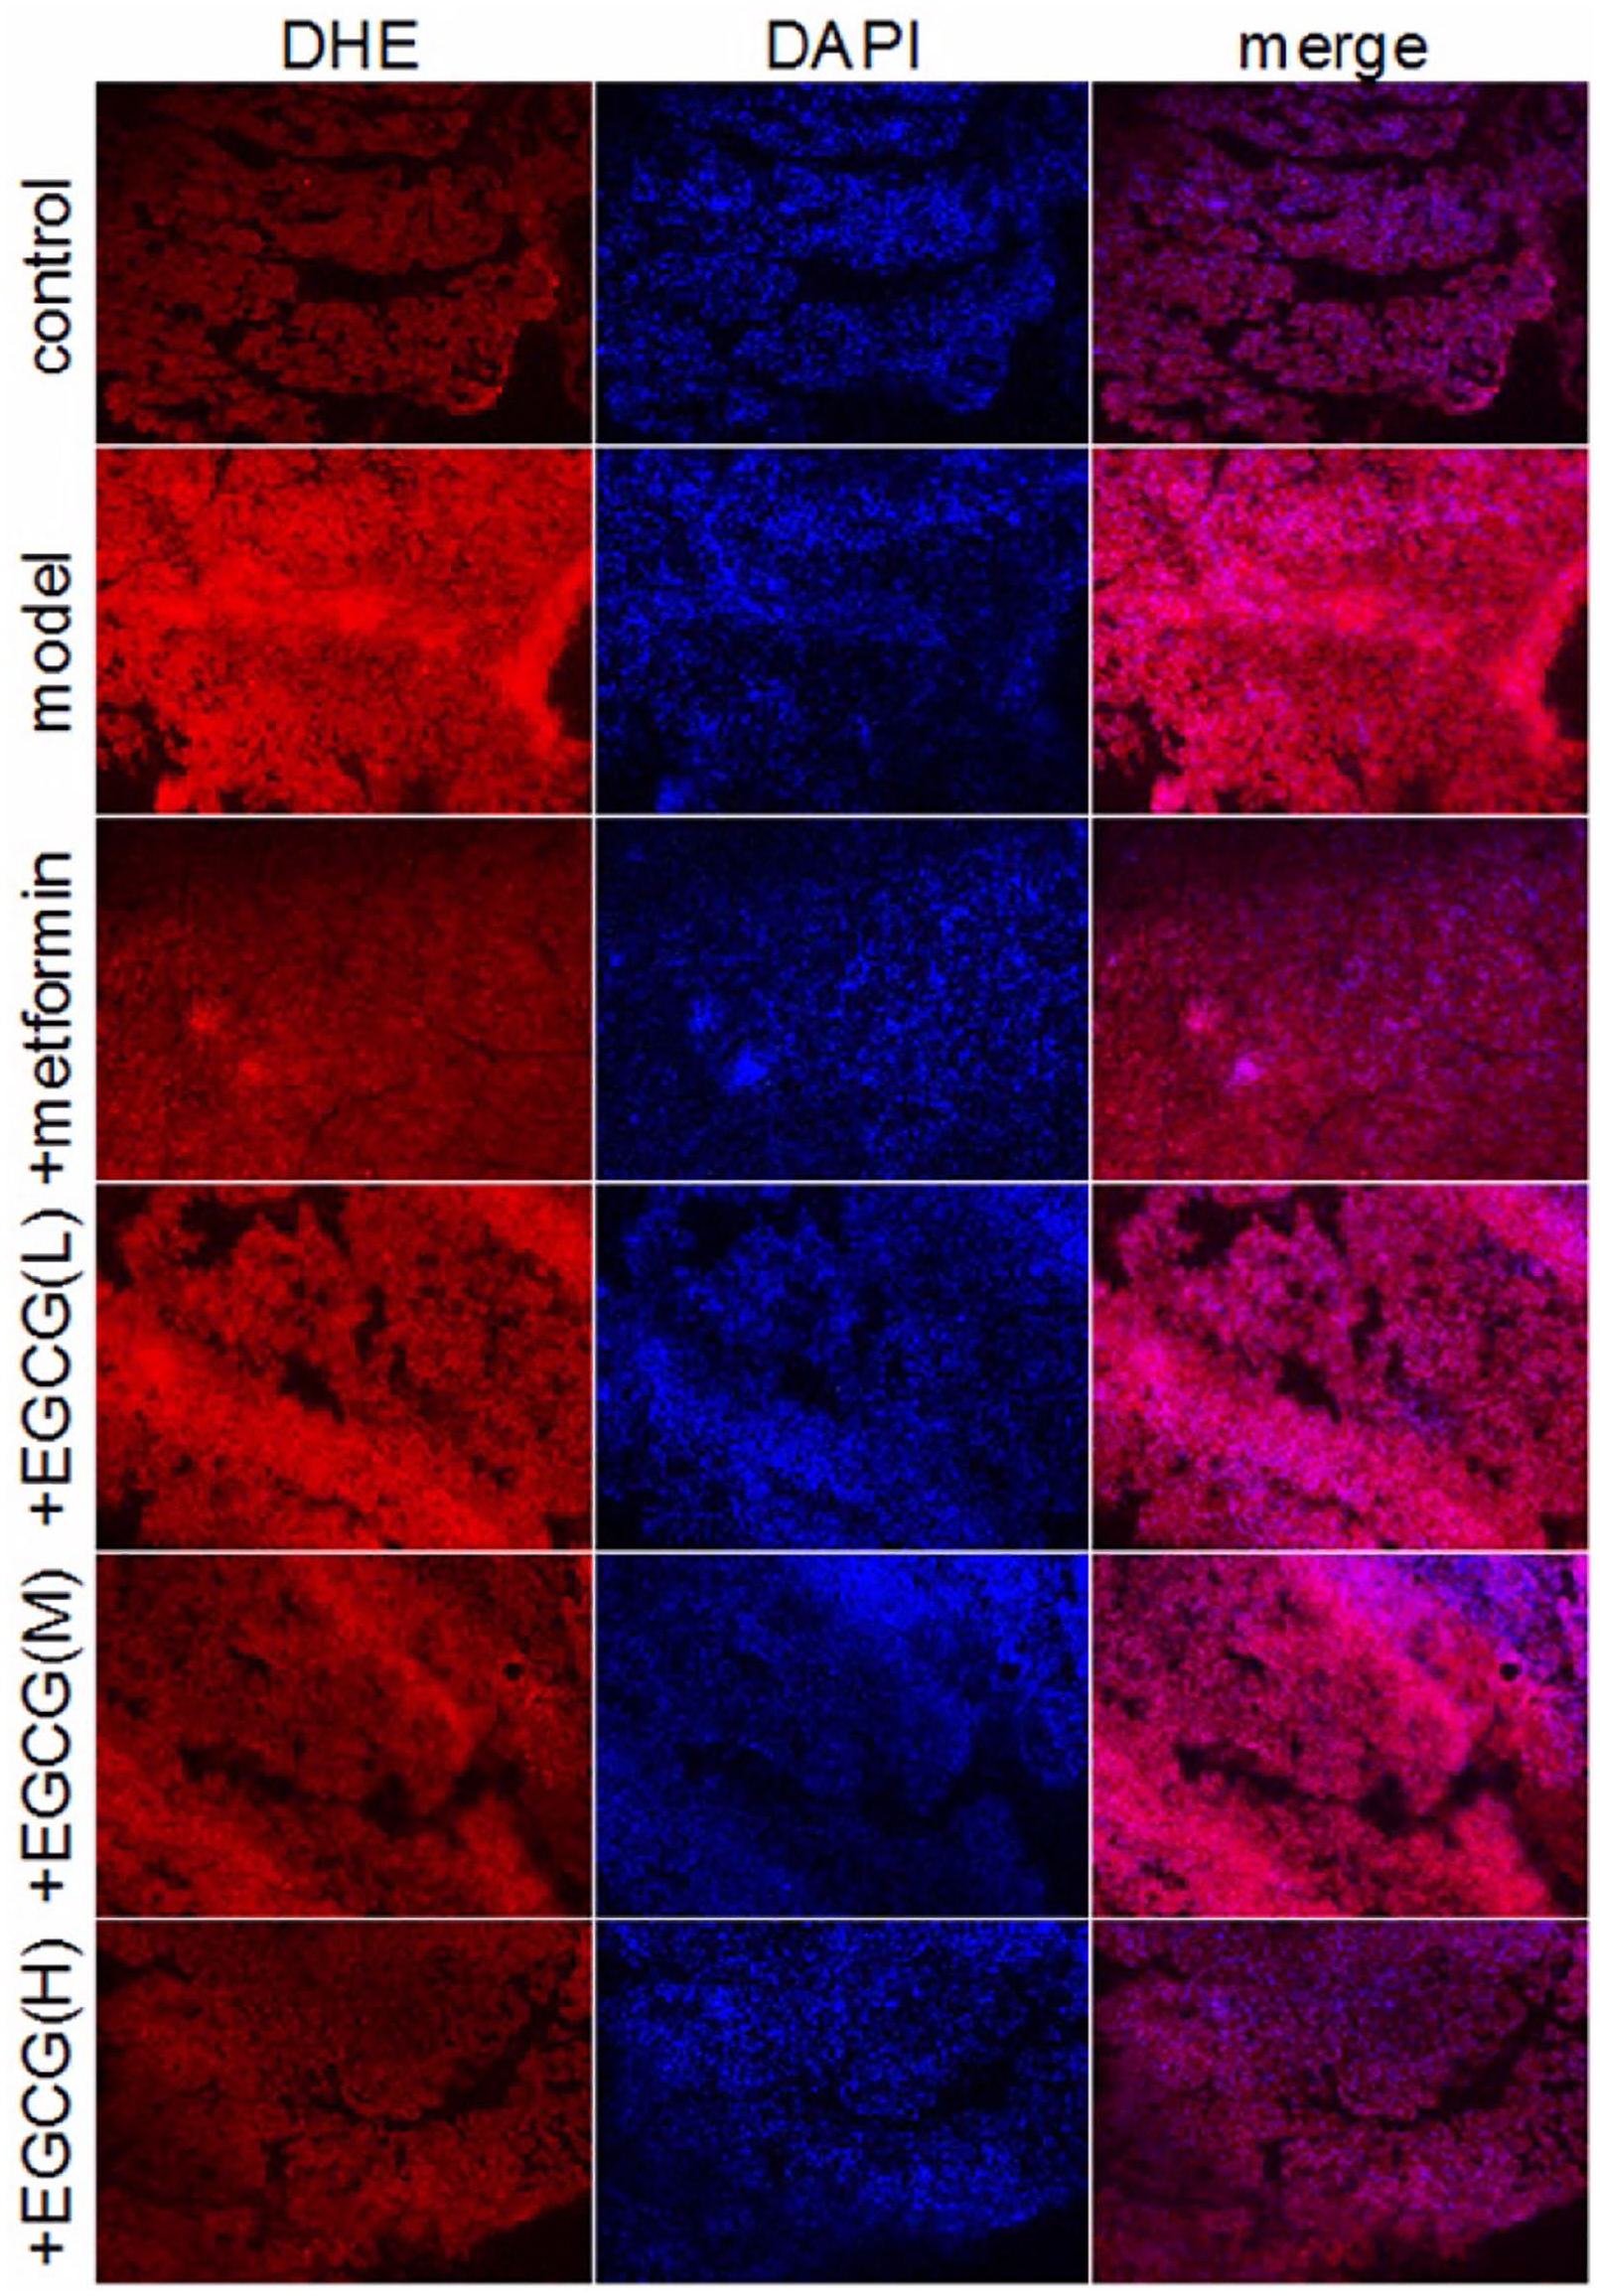
Effect of EGCG on pancreatic ROS levels, which were determined by dihydroethidium staining (200×).
Discussion
In this study, we first investigated the effect of EGCG on blood glucose regulation in type 2 diabetic rats. Previous studies demonstrated that the effect of EGCG on blood glucose was dose-dependent. 14 Here, the levels of FBG, PBG, and HbA1c were decreased significantly and muscle and liver glycogen were increased in diabetic rats treated with metformin (500 mg/kg/day) or EGCG (50 and 100 mg/kg/day) compared with the model group. In addition, the effects of EGCG (50 and 100 mg/kg/day) and metformin (500 mg/kg/day) on FBG were similar. Interestingly, the effect of EGCG (50 and 100 mg/kg/day) on PBG was significantly higher than that of metformin (500 mg/kg/day), and PBG is closely related to cardiovascular disease. 15 There is a strong association between abnormal glucose metabolism and mortality. 16 Metformin had a stronger effect at reducing HbA1c levels than EGCG during the early stage of diabetes, whereas EGCG had a stronger effect during the later stages of diabetes. HbA1c is an important risk factor for the occurrence and development of chronic diseases. 17 An increased risk of diabetic complications has been observed even in the normal concentrations of HbA1c. 18 Therefore, even a reduction of HbA1c within the normal values may be useful to reduce the risk of diabetes, vascular diseases and death, which suggests that EGCG exhibits cardiovascular protective effects. Muscle liver and muscle glycogen are lower in T2DM. 19 For the regulation of liver and muscle glycogen, although the effect of EGCG was not as powerful as metformin, it still increased the liver and muscle glycogen content compared with the model group. Diabetes is a chronic disease that requires the long-term use of hypoglycemic drugs; thus, EGCG has an advantage over metformin for long-term use. Taken together, these data suggest that EGCG has great potential for the long-term use of hypoglycemia in patients with type 2 diabetes.
The pathogenesis of T2DM is mainly insulin resistance, which is related mitochondrial damage. 7 EGCG possesses insulin-like activity and attenuates TNF-α-triggered insulin resistance by activating the insulin/IGF-1 signaling pathway, balancing the redox state, and regulating mitochondrial function. 20 FSI levels decreased significantly in the diabetic group as diabetes progressed. Although metformin and EGCG had no significant effects on insulin at the beginning of the experiment, both treatments increased FSI levels in the tenth week. In the last stage of the experiment, HOMA-IR decreased in diabetes rats, but it was still higher compared with the control group. However, after the treatment of metformin and EGCG (50 and 100 mg/kg/day), HOMA-IR decreased and nearly reached the normal level. This suggests that EGCG may be similar to metformin in terms of increasing insulin sensitivity. 21
Obesity is the most dangerous factor leading to type 2 diabetes, 22 and metformin can control body mass. In the current study, 10 weeks of treatment with EGCG (50 and 100 mg/kg/day) and metformin had the same inhibitory effect on body weight compared with the model group. The follow evidences may illuminate the mechanism. The non-covalent bond between EGCG and lipase changes the molecular conformation of lipase, thus reducing the catalytic activity of lipase. 23 EGCG can regulate host TGR-5 and FXR signaling, leading to reduced fatty acid uptake and adipogenesis and increased fatty acid metabolism. 11 In addition, many studies have shown that EGCG can increase energy consumption and fat utilization, 24 thereby reducing body weight, fat mass, and triglycerides.
Cardiovascular disease is a common cause of disability and death in diabetes. 25 More than 50% of newly diagnosed diabetic patients had signs of cardiovascular disease, and atherosclerosis was the leading cause of diabetes-related deaths. 26 T2DM can cause metabolic disorders that result in an imbalance in the regulation of lipoproteins and specifically an increase in LDL and VDLD levels. Increased LDL levels are the main cause of atherosclerosis. 9 HDL alleviates atherosclerosis by inhibiting the cellular uptake of LDL-C, thereby reducing cholesterol deposition in the arterial wall. 27 Compared with the model group, treatment with metformin and EGCG (50 and 100 mg/kg/day) significantly decreased TC, LDL-C, and FFA levels and significantly increased HDL-C; however, neither treatment affected TG and VLDL. Oral administration of EGCG (25, 50, 100 mg/kg/day) or metformin significantly alleviated the diabetes-induced changes in cardiovascular risk indices and AAI.
Oxidative stress is an important factor in the occurrence and development of T2DM. 28 EGCG attenuates oxidative stress and apoptosis in the bladder and also diminishes mitochondrial and endoplasmic reticulum (ER) apoptotic signaling. 29 Furthermore, EGCG regulates mitochondria-involved autophagy, thus improving insulin resistance and glucose homeostasis in Goto–Kakizaki (GK) diabetic rats. 30 The peroxide ions produced by oxidative stress attack the mitochondria, interfere with insulin action and secretion, and cause insulin resistance. EGCG exerts antioxidant effects by scavenging various free radicals, 31 inhibiting the formation of ROS, 28 Nitric oxide (NO) synthesis, and enhancing the activity of antioxidant enzymes. Compared with the control group, SOD levels are increased significantly in diabetic rats. The effects of EGCG on the formation of ROS are bidirectional. 32 Although low concentrations of EGCG can reduce the production of ROS, higher concentrations can significantly increase ROS formation; 33 thus, we should select the appropriate dosage of EGCG that is effective but has no side effects. After 10 weeks of metformin or EGCG (25, 50, 100 mg/kg/day) treatment, SOD levels increased significantly when compared with the model group, indicating that EGCG and metformin had antioxidant capacity. In addition, EGCG (100 mg/kg/day) significantly reduced the level of MDA, which destroyed cell membranes and led to hepatocyte swelling and necrosis. This suggests that EGCG might have a better clinical application in the fight against oxidative stress.
The results of this study indicate that EGCG has great potential as an alternative or adjuvant therapy for T2DM in the future. However, the mechanism is unclear. Sundaram et al. found that green tea extract has modulatory effects on hepatic key enzymes of glucose metabolism in STZ and high fat diet induced diabetic rats. 34 Ren et al. demonstrated that CD36 is a treatment target of EGCG in T2DM mice. EGCG down-regulated glucose levels and up-regulated C-peptide levels in T2DM mice. 35 In summary, the current study demonstrated that EGCG modulates blood glucose in T2DM rats. Lowering blood sugar, helping maintain body mass, and reducing oxidative stress is of great significance for lipid regulation, insulin resistance, and cardiovascular protection. Therefore, EGCG may be a new type of insulin sensitizer, providing a foundation for further studies into the mechanism of action of EGCG and the molecular targets of therapeutic drugs for insulin resistance-related diseases.
Conclusion
This study demonstrated that EGCG can ameliorate glycemic control, insulin resistance, lipid profile, and oxidative stress in diabetic rats. Our results provide evidence for the clinical use of EGCG to treat T2DM. The mechanisms underlying the hypoglycemic effects of EGCG need further elucidation.
Footnotes
Appendix
Acknowledgements
Authorship
All authors meet the International Committee of Medical Journal Editors (ICMJE) criteria for authorship for this article, take responsibility for the integrity of the work as a whole and have given their approval for this version to be published.
Declaration of conflicting interests
The author(s) declared no potential conflicts of interest with respect to the research, authorship, and/or publication of this article.
Funding
The author(s) disclosed receipt of the following financial support for the research, authorship, and/or publication of this article: This work was supported by grants from the National Natural Science Foundation of China (81800051, 81874312, 81960015, U1804197, 81673423, 1704168, 81571696, U1704175, 182300410332), Research Foundation of Henan Province (194200510005, 18HASTIT047, 2018GGJS102, 2017GGJS108) and Research Foundation of Xinxiang Medical University (XYBSKYZZ201812, XYBSKYZZ505319, XYBSKYZZ201626).