
Abstract
Thiamine prevents high glucose-induced damage in microvasculature, and progression of retinopathy and nephropathy in diabetic animals. Impaired thiamine availability causes renal damage in diabetic patients. Two single-nucleotide polymorphisms in SLC19A3 locus encoding for thiamine transporter 2 are associated with absent/minimal diabetic retinopathy and nephropathy despite long-term type 1 diabetes. We investigated the involvement of thiamine transporter 1 and thiamine transporter 2, and their transcription factor specificity protein 1, in high glucose-induced damage and altered thiamine availability in cells of the inner blood–retinal barrier. Human endothelial cells, pericytes and Müller cells were exposed to hyperglycaemic-like conditions and/or thiamine deficiency/over-supplementation in single/co-cultures. Expression and localization of thiamine transporter 1, thiamine transporter 2 and transcription factor specificity protein 1 were evaluated together with intracellular thiamine concentration, transketolase activity and permeability to thiamine. The effects of thiamine depletion on cell function (viability, apoptosis and migration) were also addressed. Thiamine transporter 2 and transcription factor specificity protein 1 expression were modulated by hyperglycaemic-like conditions. Transketolase activity, intracellular thiamine and permeability to thiamine were decreased in cells cultured in thiamine deficiency, and in pericytes in hyperglycaemic-like conditions. Thiamine depletion reduced cell viability and proliferation, while thiamine over-supplementation compensated for thiamine transporter 2 reduction by restoring thiamine uptake and transketolase activity. High glucose and reduced thiamine determine impairment in thiamine transport inside retinal cells and through the inner blood–retinal barrier. Thiamine transporter 2 modulation in our cell models suggests its major role in thiamine transport in retinal cells and its involvement in high glucose-induced damage and impaired thiamine availability.
Introduction
Diabetic microangiopathy is a major cause of blindness, renal failure and nerve damage. Duration of diabetes, poor glycaemic control and high blood pressure are the most important risk factors for its development. Although intervention studies have clearly linked the severity of microvascular complications with the duration and severity of hyperglycaemia,1–3 a sub-analysis of The Diabetes Control Complications Trial (DCCT) showed that 10% of patients developed a three-step Early Treatment Diabetic Retinopathy Study (ETDRS) progression of diabetic retinopathy (DR) despite being in the lowest HbA1c quintile (<6.87%), whereas 43% of those in the worst quintile (HbA1c > 9.49%) did not develop any. 4 This and other findings showing familial clustering of microvascular complications5,6 suggest that other factors may play a major role in the pathogenesis of diabetic microangiopathy.
High glucose (HG) induces vascular damage through different mechanisms, among which increased activation of the polyol, diacylglycerol-protein kinase C and hexosamine pathways, and overproduction of advanced glycation end-products seem to play a major role. Reactive oxygen species (ROS) overproduction by mitochondria, as a result of increased flux through the Krebs cycle, was reported as the unifying mechanism of these biochemical pathways. 7
Thiamine is an essential coenzyme for key enzymes of intracellular glucose metabolism, in particular, transketolase (TK), which shifts excess potentially damaging metabolites from glycolysis into the pentose phosphate cycle.8,9 Thiamine and its lipophilic derivative benfotiamine normalize the four branches of the above-described unifying mechanism of glucose damage, 7 by reducing ROS production in cell and animal studies.10,11 In vivo, thiamine/benfotiamine administration reduced the progression of DR and nephropathy in diabetic animals.10,12
Thus, reduced thiamine availability may facilitate metabolic damage. Renal loss of thiamine due to disposal via proximal tubules, resulting in reduced thiamine/TK activity, was described in diabetic patients. 13 Hence, diabetes might be described as a thiamine-deficient state, relative to the increased coenzyme requirements deriving from amplified glucose metabolism, especially in non-insulin-dependent tissues prone to complications. 9
Thiamine is present in free form and very low concentrations in the intestinal lumen; absorption takes place mainly in the proximal part of the small intestine, through two mechanisms. 14 At high, pharmacological concentrations, non-saturable passive diffusion may occur. 15 At low concentrations, it is carried into the cells by high-affinity active transport, involving phosphorylation of the vitamin, and mediated by two transporters, thiamine transporter 1 (THTR1) and thiamine transporter 2 (THTR2), encoded by the SLC19A2 and SLC19A3 genes, respectively. 16 Transcription factor specificity protein 1 (Sp1) is responsible for the basal expression of THTR1 and THTR2.17,18 Both THTR1 and THTR2 are widely distributed but their expression may vary in different tissues. 19
Susceptibility to develop DR and/or nephropathy may correlate with impaired ability to achieve intracellular thiamine levels sufficiently high to cope with increased glucose inflow. This might be particularly relevant in insulin-independent tissues, such as retinal capillary endothelium, pericytes and neuroretina because they cannot regulate glucose uptake and are more exposed to hyperglycaemic damage.
Some evidence for modulation of thiamine transporters in HG has been reported. Glucose-induced down-regulation of THTR1 and THTR2, and Sp1, linked to thiamine insufficiency, was shown in human kidney proximal tubular epithelium. 20 On the other hand, adaptive regulation of thiamine uptake consequent to extracellular substrate levels was described, with overexpression of THTR2 and Sp1, but not THTR1, in human intestinal epithelial cells maintained in low thiamine medium. 21
Finally, the minor alleles of two single-nucleotide polymorphisms (SNPs) in the SLC19A3 locus are strongly associated with absent/minimal DR and diabetic nephropathy despite type 1 diabetes of more than 20 years of duration, suggesting a role for genetic variations of THTR2 in the pathogenesis of severe DR and end-stage renal disease, eventually explaining why some diabetic patients are less prone than others to develop microvascular complications. Such association reached genome-wide significance in the combined analysis of the FinnDIANE and Wisconsin Epidemiologic Study of Diabetic Retinopathy (WESDR) cohorts, the largest series of fully genotyped type 1 diabetic patients available today. 22
The aim of this work was to investigate the involvement of the two thiamine transporters THTR1 and THTR2 and their transcription factor Sp1 in HG-induced damage and altered thiamine availability in cell models belonging to the inner blood–retinal barrier, cultured in conditions mimicking the DR microenvironment.
Materials and methods
Cell cultures
A human retinal pericyte (HRP) line had been stabilized and characterized in our laboratory. 23 Human microvascular endothelial cells (HMEC) were from ATCC (Cat# CRL-3243, RRID:CVCL_0307), and human Müller cell line Moorfields/Institute of Ophthalmology-Müller 1 (MIO-M1) cells were obtained from the UCL Institute of Ophthalmology, London, UK (RRID:CVCL_0433). 24 HRP and MIO-M1 cells were cultured in Dulbecco’s modified Eagle’s medium (DMEM) + 10% foetal calf serum (FCS); HMEC were cultured in endothelial cell growth medium-2 (EBM-2) growth medium (Lonza, Basel, Switzerland) for expansion and switched to DMEM + 10% FCS for experiments. All cell types were mycoplasma-free as detected by quantitative real-time polymerase chain reaction (qRT-PCR).
Cells were cultured for 8 days in physiological D-glucose concentration (NG; 5.6 mmol/L), high D-glucose concentrations (HG; 28 mmol/L) or intHGt (48 h HG/48 h NG twice) D-glucose concentrations, to mimic the diabetic microenvironment. To investigate substrate influence on the expression of thiamine transporters, thiamine was added at a pharmacological dose of 50 µmol/L [high thiamine concentrations (HT)], while custom-made thiamine-deficient (TD) media (Thermo Fisher Scientific, Waltham, MA, USA) was used to test the effects of low thiamine environment.
In order to create an in vitro model of the inner blood–retinal barrier and study the interactions among the different cell types involved, we also established tri-co-cultures, by growing HMEC on the inner membrane surface, and HRP on the outer surface, of transwell inserts, while Müller cells were plated on the bottom of the well, as previously described. 25 Co-cultures were maintained for 8 days in the above-described experimental conditions. At the end of the incubation period, inserts were shifted to new wells; trypsin-EDTA was added inside the insert to detach HMECs, and inside the well at a volume sufficient to wet the bottom of the insert, to detach HRPs. MIO-M1 cells were collected by trypsinization from the bottom of the original wells.
Modulation of the expression of thiamine transporters THTR1/THTR2 and Sp1
Quantitative real-time polymerase chain reaction
THTR1/THTR2 and Sp1 mRNA expression was evaluated by qRT-PCR. Total RNA was extracted by High Pure RNA Isolation Kit (Sigma-Aldrich, St. Louis, MO, USA) and 200 ng RNA were reverse-transcribed using High Capacity cDNA Reverse Transcription Kits (Thermo Fisher Scientific). qRT-PCR was performed by 48-well StepOne Real-Time System (Applied Biosystems, Foster City, CA, USA) using Power SYBR™ Green PCR Master Mix (Thermo Fisher Scientific). Relative gene expression was determined using the 2–ΔΔCT method and normalized against β-actin. Primers used were as follows: THTR1 forward: 5′-AGCCAGACCGTCTCCTTGTA-3′; reverse: 5′-TAGAGAGGGCCCACCACAC-3′; 26 THTR2 forward: 5′-CTGGCTCTGGTGGTCTTCTC-3′, reverse: 5′-AGGCATAGCGTTCCACATTC-3′; Sp1 forward: 5′-TGCAGCAGAATTGAGTCACC-3′, reverse: 5′-CACAACATACTGCCCACCAG-3′. 20
Western blot analysis
THTR1/THTR2 and Sp1 protein expression was evaluated by Western blot analysis. To extract total proteins, cells were lysed using M-PER Mammalian Protein Extraction Reagent (Thermo Fisher Scientific) added with 10 µL/mL Protease Inhibitor Cocktail Kit (Thermo Fisher Scientific). Extracts were kept ice-cold and cleared by centrifugation at 20,000g for 15 min at 4°C. The supernatant was aliquoted and stored at −80°C. Protein content was measured through Bradford’s reaction.
Thirty micrograms of protein was loaded on pre-cast gels (4%–20% Mini-PROTEAN® TGX™ Precast Gel; Bio-Rad, Hercules, CA, USA), separated by electrophoresis and transferred to nitrocellulose membranes. Immunoblotting was performed by incubating the membranes with rabbit polyclonal antibody anti-SLC19A2 (Abcam Cat# ab123246, RRID:AB_10972351) 1:1000, anti-SLC19A3 (Abcam Cat# ab103950, RRID:AB_10711742) 1:500, and anti-SP1 (Thermo Fisher Scientific Cat# PA5-27243, RRID:AB_2544719) 1:2000. Immunoreactive bands were visualized using the enhanced chemiluminescence (ECL) Western blotting protocol (Merck Millipore, Darmstadt, Germany). The relative signal strength was quantified by densitometric analysis (1D Image Analysis System, Kodak), and values normalized against β-actin.
Localization of thiamine transporters THTR1/THTR2 and Sp1
Cells cultured as described above were transferred to chamber slides for the last 24 h. They were then fixed in ice-cold methanol for 5 min at −20°C, dried at RT for 15 min and rehydrated in phosphate-buffered saline (PBS) for 15 min. Non-specific binding sites were blocked in PBS plus 0.2% bovine serum albumin (BSA; blocking solution) for 1 h at RT. Cells were incubated overnight at 4°C with 1 µg/mL rabbit polyclonal anti-SLC19A2 (Cat# HPA006119, RRID:AB_1079996; Sigma-Aldrich), 2 µg/mL rabbit polyclonal anti-SLC19A3 (Cat# HPA038898, RRID:AB_10673481; Sigma-Aldrich) or 1:250 rabbit polyclonal anti-SP1 (Cat# PA5-27243, RRID:AB_2544719; Thermo Fisher Scientific), as appropriate. Following three washings with blocking solution, 1:1000 fluorescein isothiocyanate (FITC)-conjugated goat anti-rabbit IgG (Abcam Cat# ab6717, RRID:AB_955238) was added for 1 h at RT. 4′,6-Diamidino-2-phenylindole (DAPI) was used to blue-stain the cell nuclei. Images were taken under a Leica DM 2000 microscope (Leica, Wetzlar, Germany), equipped with a Leica DFC 320 camera and Leica QWin Plus 2003 digital processing and analysis software.
Intracellular thiamine uptake
Intracellular thiamine uptake was measured in cell lysates through the DRG® Vitamin B1 (Thiamine) (BIO-5136) kit (DRG International, Springfield, NJ, USA). In total, 150 µL of 1:5 diluted lysate and 150 µL medium from the kit were added to 96-well plates coated with Lactobacillus fermentum. The presence of thiamine in samples gives a thiamine-dependent growth response until the vitamin is consumed. After incubation at 37°C for 48 h, the growth of L. fermentum was measured turbidimetrically at 630 nm. Thiamine concentration is directly proportional to the turbidity. Values were normalized by protein content.
TK activity
TK activity was evaluated using a modification of the enzymatic kinetic method of Chamberlain et al., 27 as previously described. 11 The enzyme reaction was started by the addition of 15 µL cell lysate to 85 µL reaction mixture (15 mmol/L ribose-5-phosphate, 250 µmol/L NADH, 0.1 mol/L Tris–HCl pH 7.8, 200 U/mL glycerol-3-phosphate dehydrogenase/triose phosphate isomerase) and the 340 nm absorbance measured at 10-min interval for 90 min. TK activity was deduced from the difference in the absorbance at t = 0 min and t = 30 min for HMEC/MIO-M1 cells, and t = 0 min and t = 60 min as regards HRP. Values were normalized by protein content.
Permeability to thiamine of HMEC/HRP bilayers
Permeability to thiamine of HMEC/HRP bilayers was measured in transwell inserts, by culturing cells on either side of the membrane, as described above. Once confluence was reached, the medium was changed to TD medium. 50 µmol/L of thiamine were added to the upper chamber and thiamine content measured in the lower chamber after 1-h incubation, as described above.
Effects of thiamine deficiency on cell function
To evaluate the role of thiamine depletion on cell function, retinal cells were cultured for 8 days in physiological glucose/thiamine concentrations (NG ctrl), physiological glucose/thiamine deficiency (NG TD), stable high glucose/thiamine deficiency (HG TD) and intermittent high glucose/thiamine deficiency (intHG TD), as described above.
Cell number was assessed by cell counting in Bürker chambers after Trypan blue staining, by two independent operators. Proliferation was evaluated by bromo-deoxy-uridine (BrdU) incorporation into the DNA (Cell Proliferation Assay, BrdU; Roche Applied Science, Mannheim, Germany), according to the manufacturer’s instructions. Apoptosis, in terms of DNA fragmentation, was assessed by enzyme-linked immunosorbent assay (ELISA), according to instructions (Cell Death Detection ELISAplus; Roche). With regard to migration, at the end of the incubation period, retinal cells were seeded inside 8-µm-pore polycarbonate membrane transwells in DMEM without FCS. DMEM + 10% FCS was used as a chemoattractant in the lower chamber. After 24 h, their migration rate was measured using the colorimetric QCM Chemotaxis Cell Migration Assay (Merck-Millipore, Darmstadt, Germany). Cell proliferation, apoptosis and migration were normalized to cell number.
Statistics
Statistical comparison was performed by one-way analysis of variance (ANOVA) with Bonferroni post hoc correction. Results were expressed as mean ± standard deviation (SD) of five independent experiments, as previously established through power analysis, and normalized against cells cultured in physiological conditions (NG).
Results
Expression and localization of thiamine transporters and Sp1 in retinal cells in physiological conditions
ECs, pericytes and Müller cells express all the two thiamine transporters and their transcription factor Sp1 in physiological conditions (Figure 1). THTR1 and Sp1 are expressed similarly in all cell types, while THTR2 expression is lower in ECs and higher in pericytes (Figure 1(a) and (b)). Sp1 concentration is higher in all cell types, in comparison with thiamine transporters.
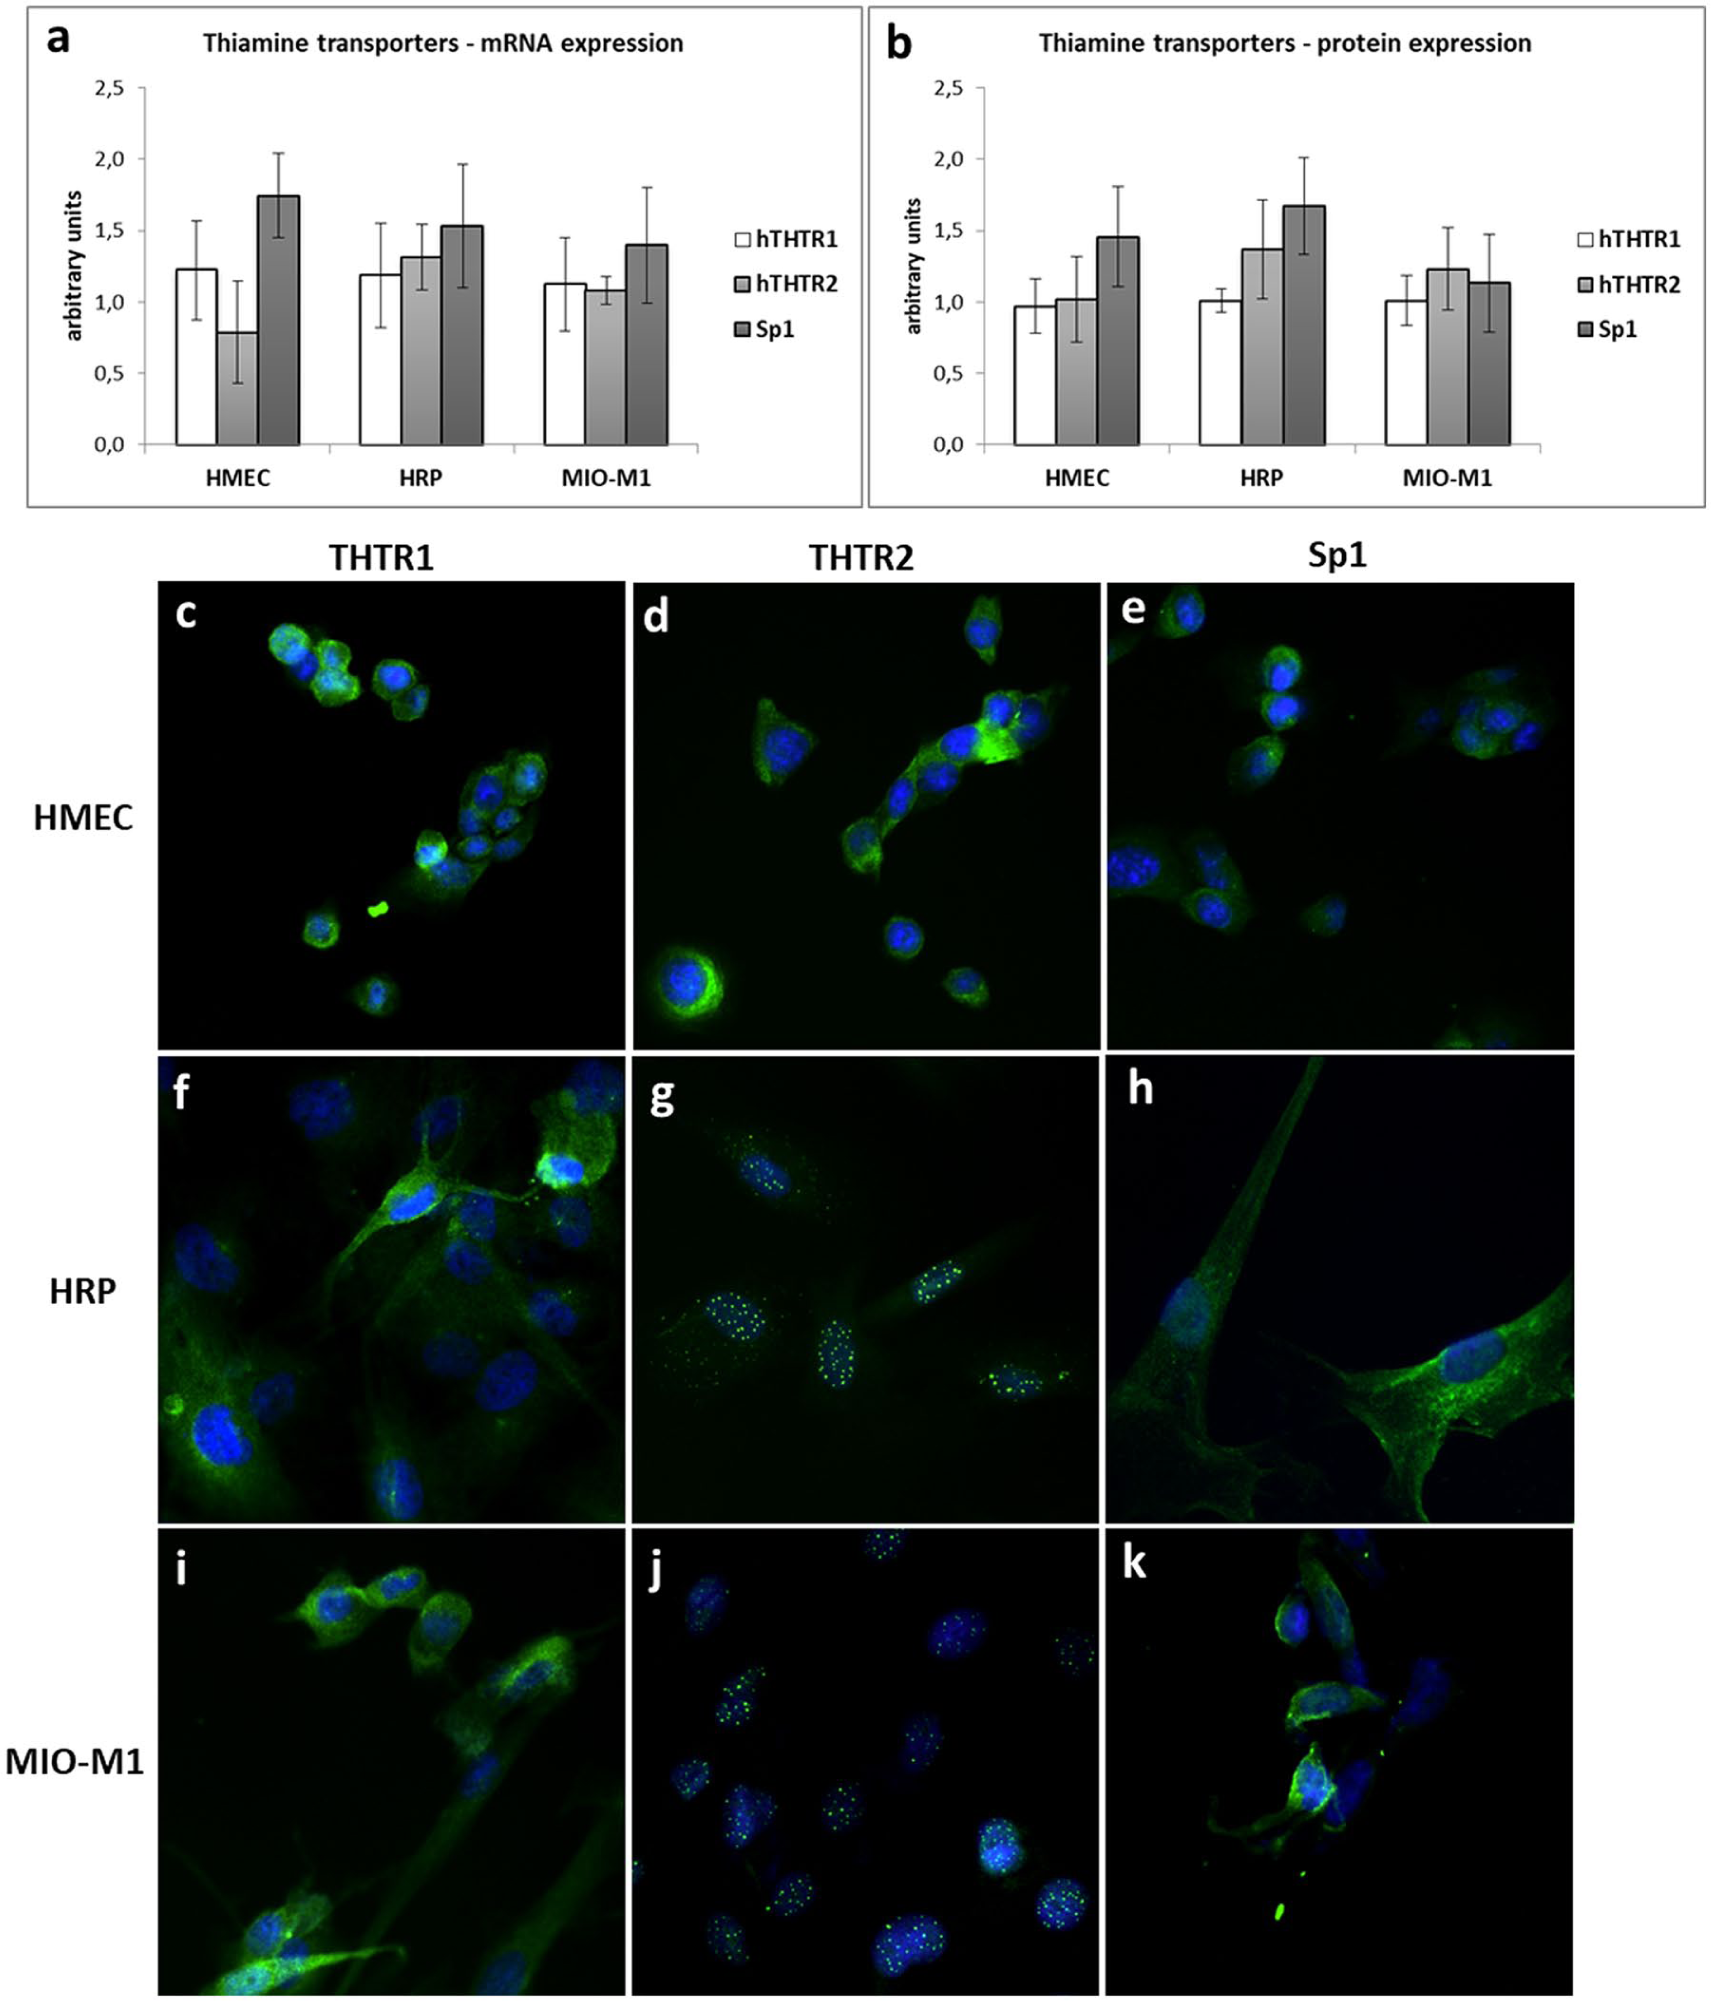
Expression of thiamine transporters and Sp1 in retinal cells in physiological conditions: comparison of mRNA (a) and protein expression (b) in the different cell types. (c–k) Localization of thiamine transporters and Sp1 inside retinal cells in physiological conditions. Immunofluorescence with Ab (c, f, i) anti-THTR1, (d, g, j) anti-THTR2 and (e, h, k) anti-Sp1 in (c–e) HMEC, (f–h) HRP and (i–k) MIO-M1 cells (green). Nuclei are counterstained with DAPI (blue). Magnification 400×.
With regard to their localization inside the cells, THTR1 presents a cytoplasmic distribution in all cell types (Figure 1(c), (f) and (i)), but while in HMEC, it locates closer to the cell membrane (Figure 1(c)), and in HRP and Müller cells, it seems to remain mostly close to the Golgi apparatus (Figure 1(f) to (i)). THTR2 localizes to cytosol in HMEC (Figure 1(d)), while in pericytes and Müller cells it shows a nuclear body distribution (Figure 1(g) to (j)). Sp1 has a cytoplasmic distribution in ECs and pericytes (Figure 1(e) to (h)), while in Müller cells it locates along the cell membrane (Figure 1(k)).
Expression and localization of thiamine transporters and Sp1 in retinal cells under different experimental conditions
Cells were cultured in physiological, high or intermittent low glucose/HG concentrations, to mimic the diabetic microenvironment. In addition, substrate influence on the expression of thiamine transporters was investigated adding to each glucose condition thiamine at pharmacological doses or using TD media. mRNA and protein expression of each transporter and Sp1 was evaluated in all experimental conditions. THTR1 mRNA and protein expressions were unchanged in all cases and in all cell types (Figure 2), while THTR2 (Figure 3) and Sp1 (Figure 4) showed different behaviours in the three cell types.
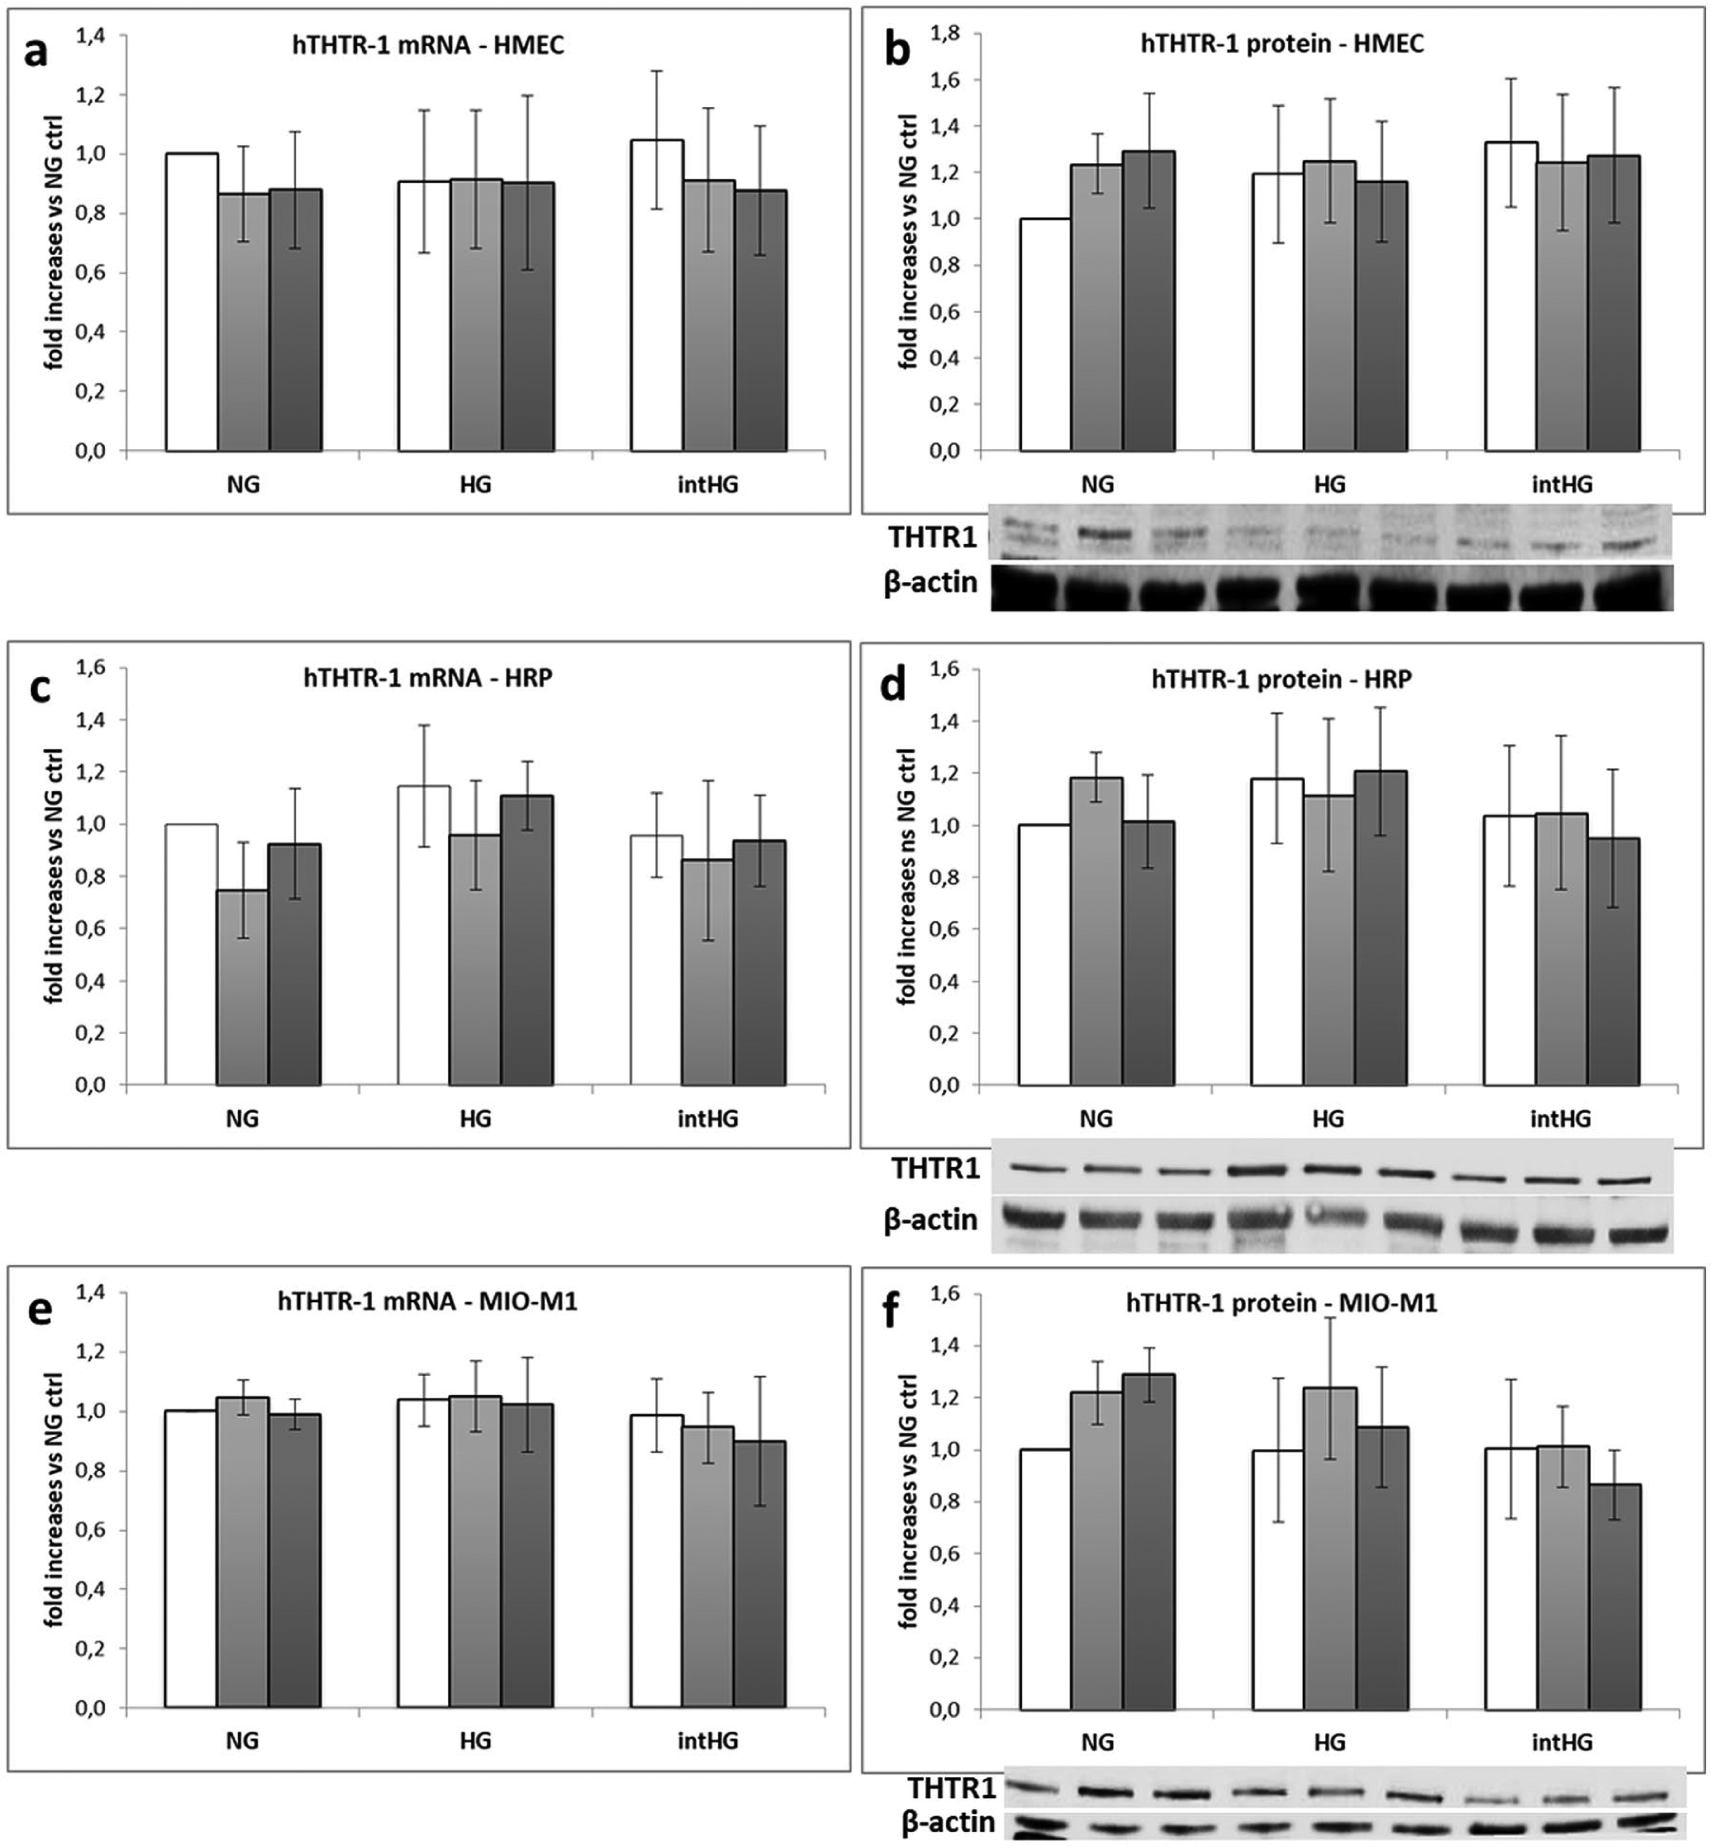
THTR1 expression in retinal cells under different experimental conditions: (a) THTR1 mRNA and (b) protein expression in HMEC; (c) THTR1 mRNA and (d) protein expression in HRP; (e) THTR1 mRNA and (f) protein expression in MIO-M1 cells. Mean of five experiments ± SD, plus representative images of one relevant WB experiment.
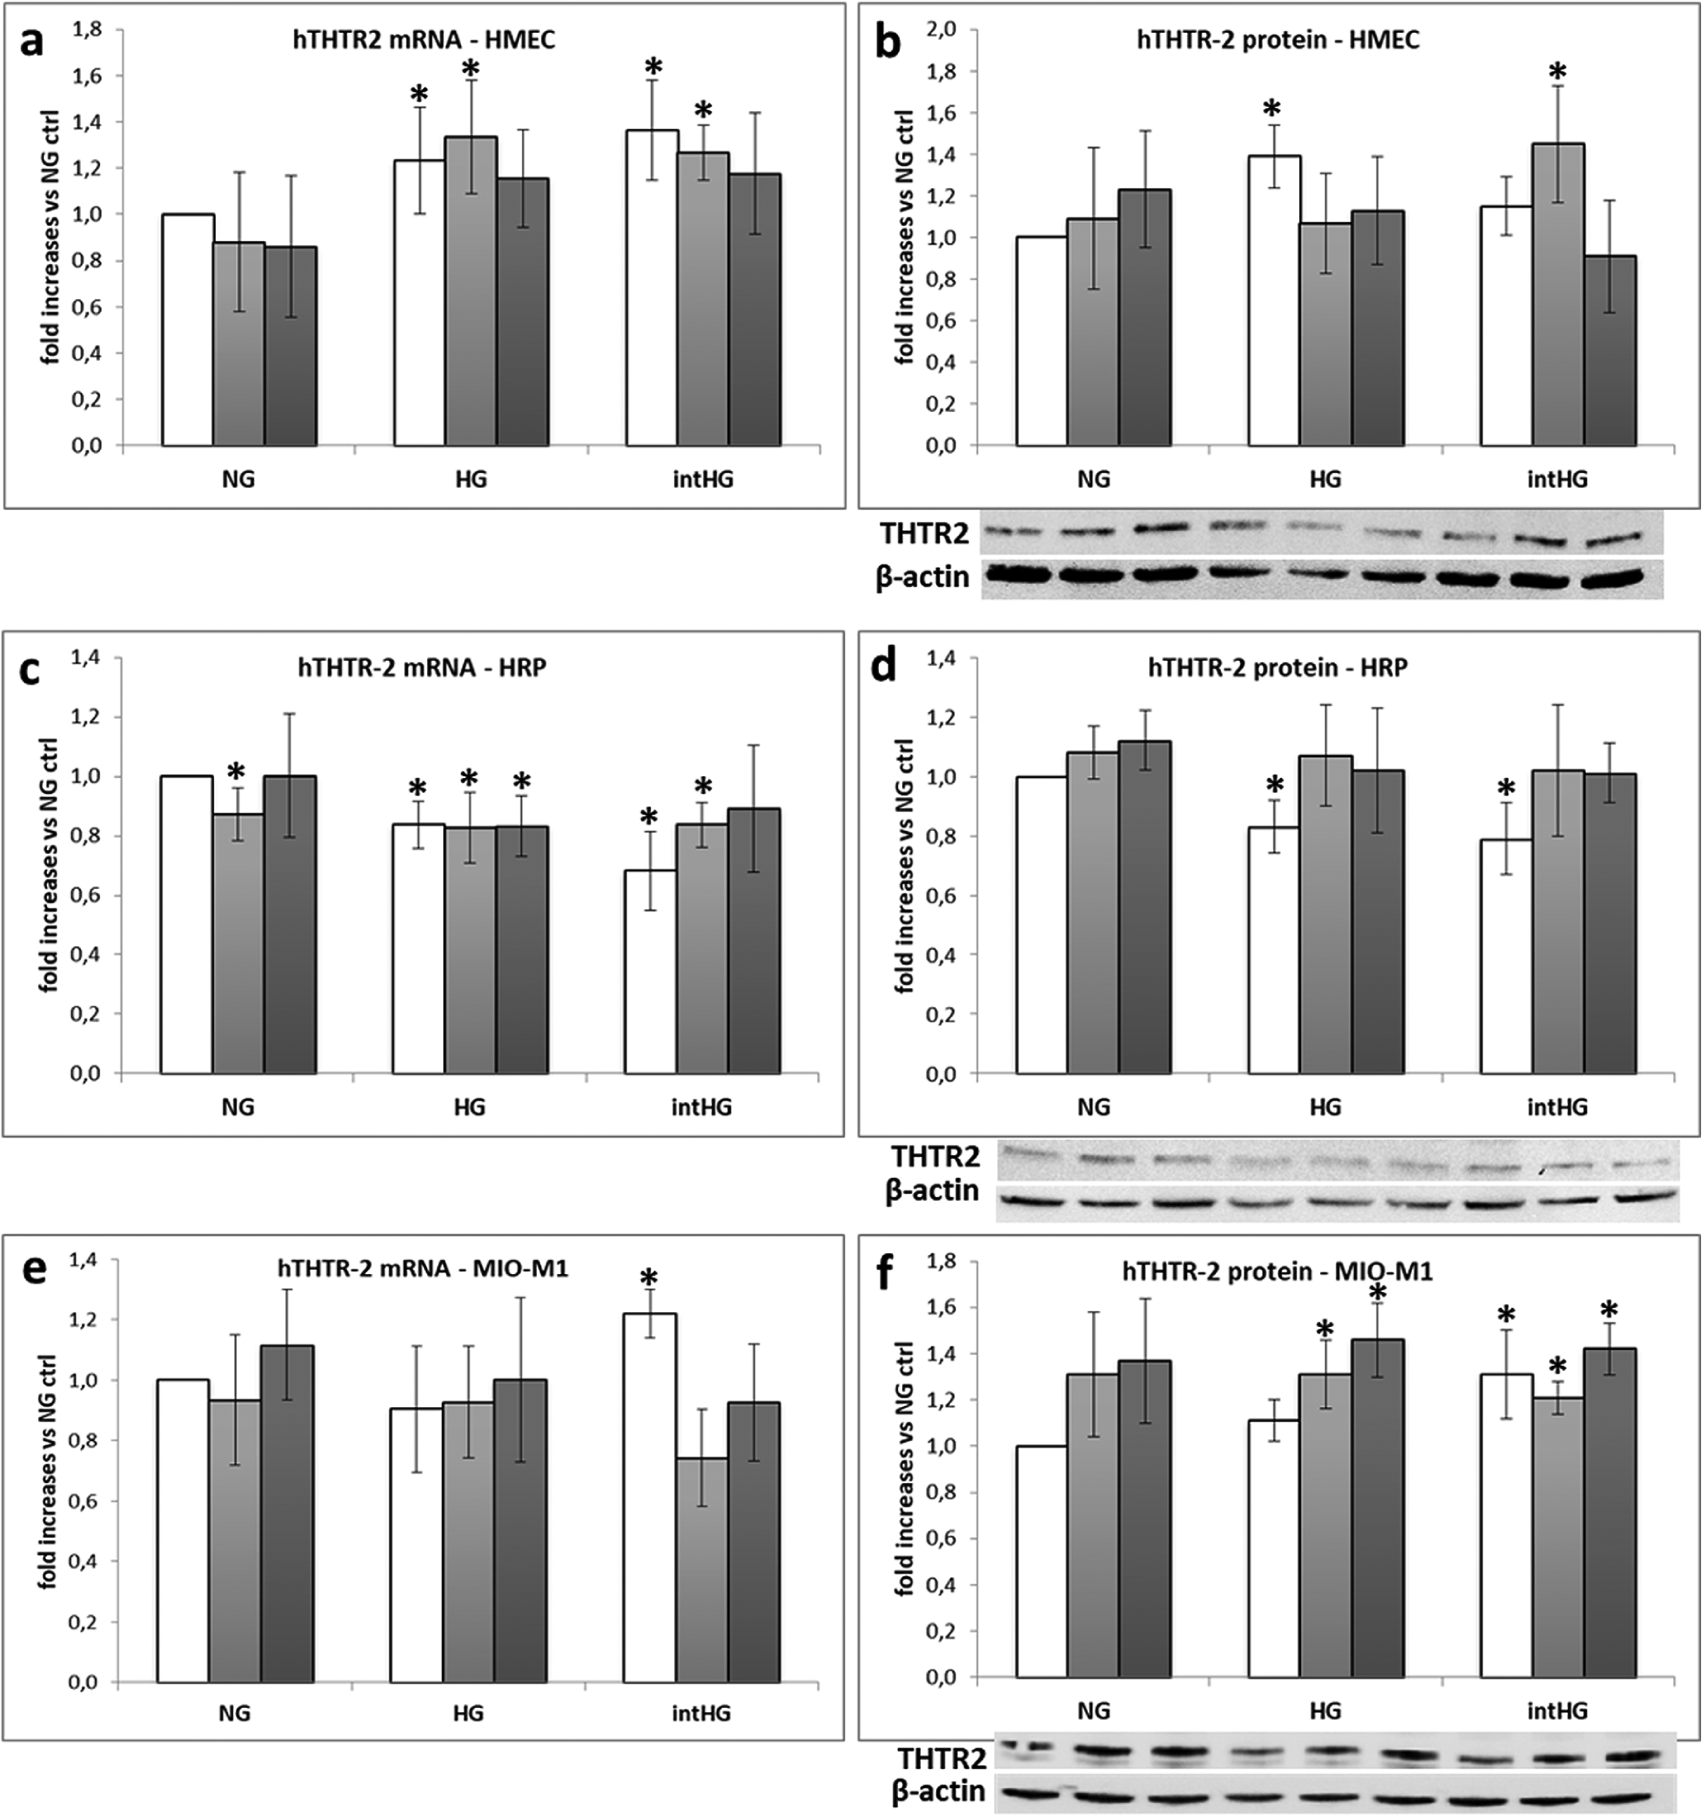
THTR2 expression in retinal cells under different experimental conditions: (a) THTR2 mRNA and (b) protein expression in HMEC; (c) THTR2 mRNA and (d) protein expression in HRP; (e) THTR2 mRNA and (f) protein expression in MIO-M1 cells. Mean of five experiments ± SD, plus representative images of one relevant WB experiment.
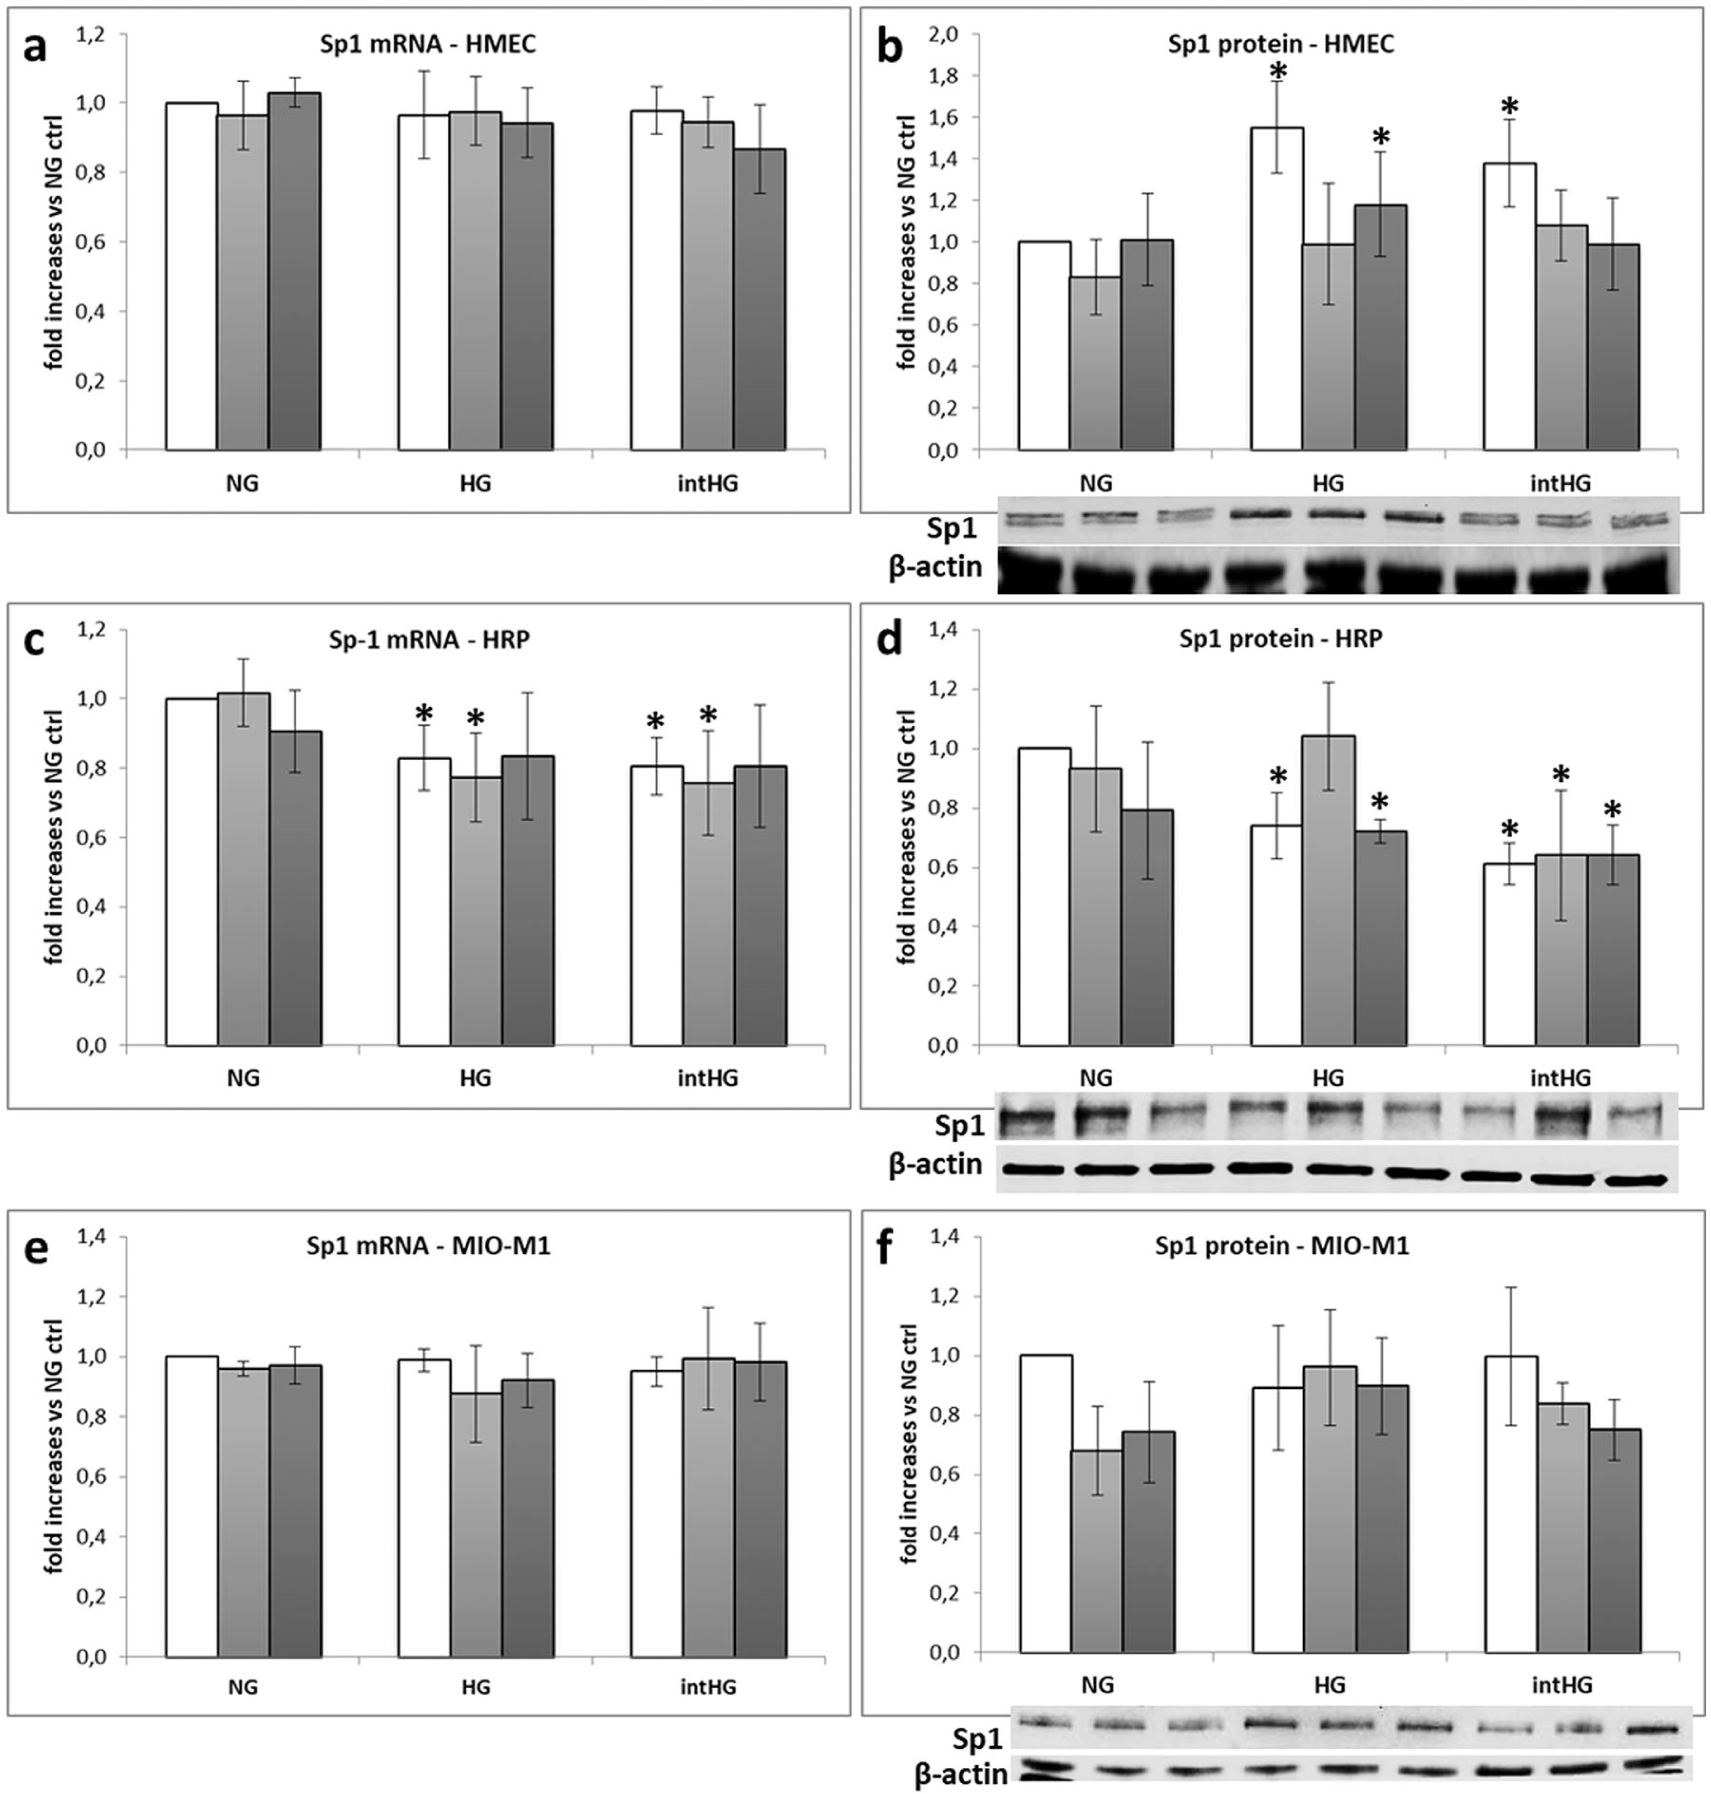
Sp1 expression in retinal cells under different experimental conditions: (a) Sp1 mRNA and (b) protein expression in HMEC; (c) Sp1 mRNA and (d) protein expression in HRP; (e) Sp1 mRNA and (f) protein expression in MIO-M1 cells. Mean of five experiments ± SD, plus representative images of one relevant WB experiment.
THTR2 mRNA expression decreased in HRP cultured in HG in all thiamine conditions (–17% vs NG ctrl in all cases, p < 0.05), in intHG in standard thiamine (–32% vs NG ctrl, p < 0.05) and TD conditions (–16% vs NG ctrl, p < 0.05), and in NG TD (‒13%, p < 0.05) (Figure 3(c)). On the contrary, THTR2 mRNA expression increased in HMEC in HG and intHG in standard thiamine concentrations (+20% and +30% vs NG ctrl, respectively, p < 0.05) and TD (+30% and +27%, respectively, p < 0.05) (Figure 3(a)). Increased THTR2 expression was also found in Müller cells in intHG (+22% vs NG ctrl, p < 0.05), while intHG TD conditions decreased THTR2 expression (–26% vs NG ctrl, p < 0.05) (Figure 3(e)).
THTR2 protein expression showed a 40% increase in HMEC cultured in HG and intHG TD conditions (p < 0.05 vs NG ctrl) (Figure 3(b)) and a 20% decrease in HRP in HG and intHG with standard thiamine concentrations (p < 0.05 vs NG ctrl) (Figure 3(d)). In Müller cells, THTR2 protein expression increased by an average 30% in HG TD, HG HT and in intHG in all thiamine conditions (p < 0.05 vs NG ctrl) (Figure 3(f)).
Sp1 mRNA expression was unchanged in HMEC and MIO-M1 cells in all experimental conditions (Figure 4(a) and (e)), while it decreased of a 20%–25% in HRP cultured in HG, HG TD, intHG, intHG TD conditions (p < 0.05 vs NG ctrl) (Figure 4(c)). Sp1 protein expression increased in HMEC in HG, HG HT and intHG (p < 0.05 vs NG ctrl) (Figure 4(b)), decreased in HRP in HG, HG HT and intHG in all thiamine conditions (p < 0.05 vs NG ctrl) (Figure 4(d)) and was unchanged in Müller cells (Figure 4(f)). With regard to the intracellular localization of thiamine transporters and Sp1 examined by immunofluorescence staining, no modifications were found among the different experimental conditions (data not shown).
Expression of thiamine transporters and Sp1 in co-cultured retinal cells in different experimental conditions
HMEC, HRP and MIO-M1 cells were cultivated all together in a tri-co-culture system, to mimic the inner blood–retinal barrier microenvironment. We meant to understand if co-culture might influence thiamine transporter expression differently from single cultures. As our previous data in single cultures seemed to rule out a primary involvement of different thiamine concentrations on transporters and Sp1 expression, cells were cultured in NG, HG and intHG only. THTR1 mRNA and protein expression were again unchanged in all cases and in all cell types (Figure 5(a) and (b)).
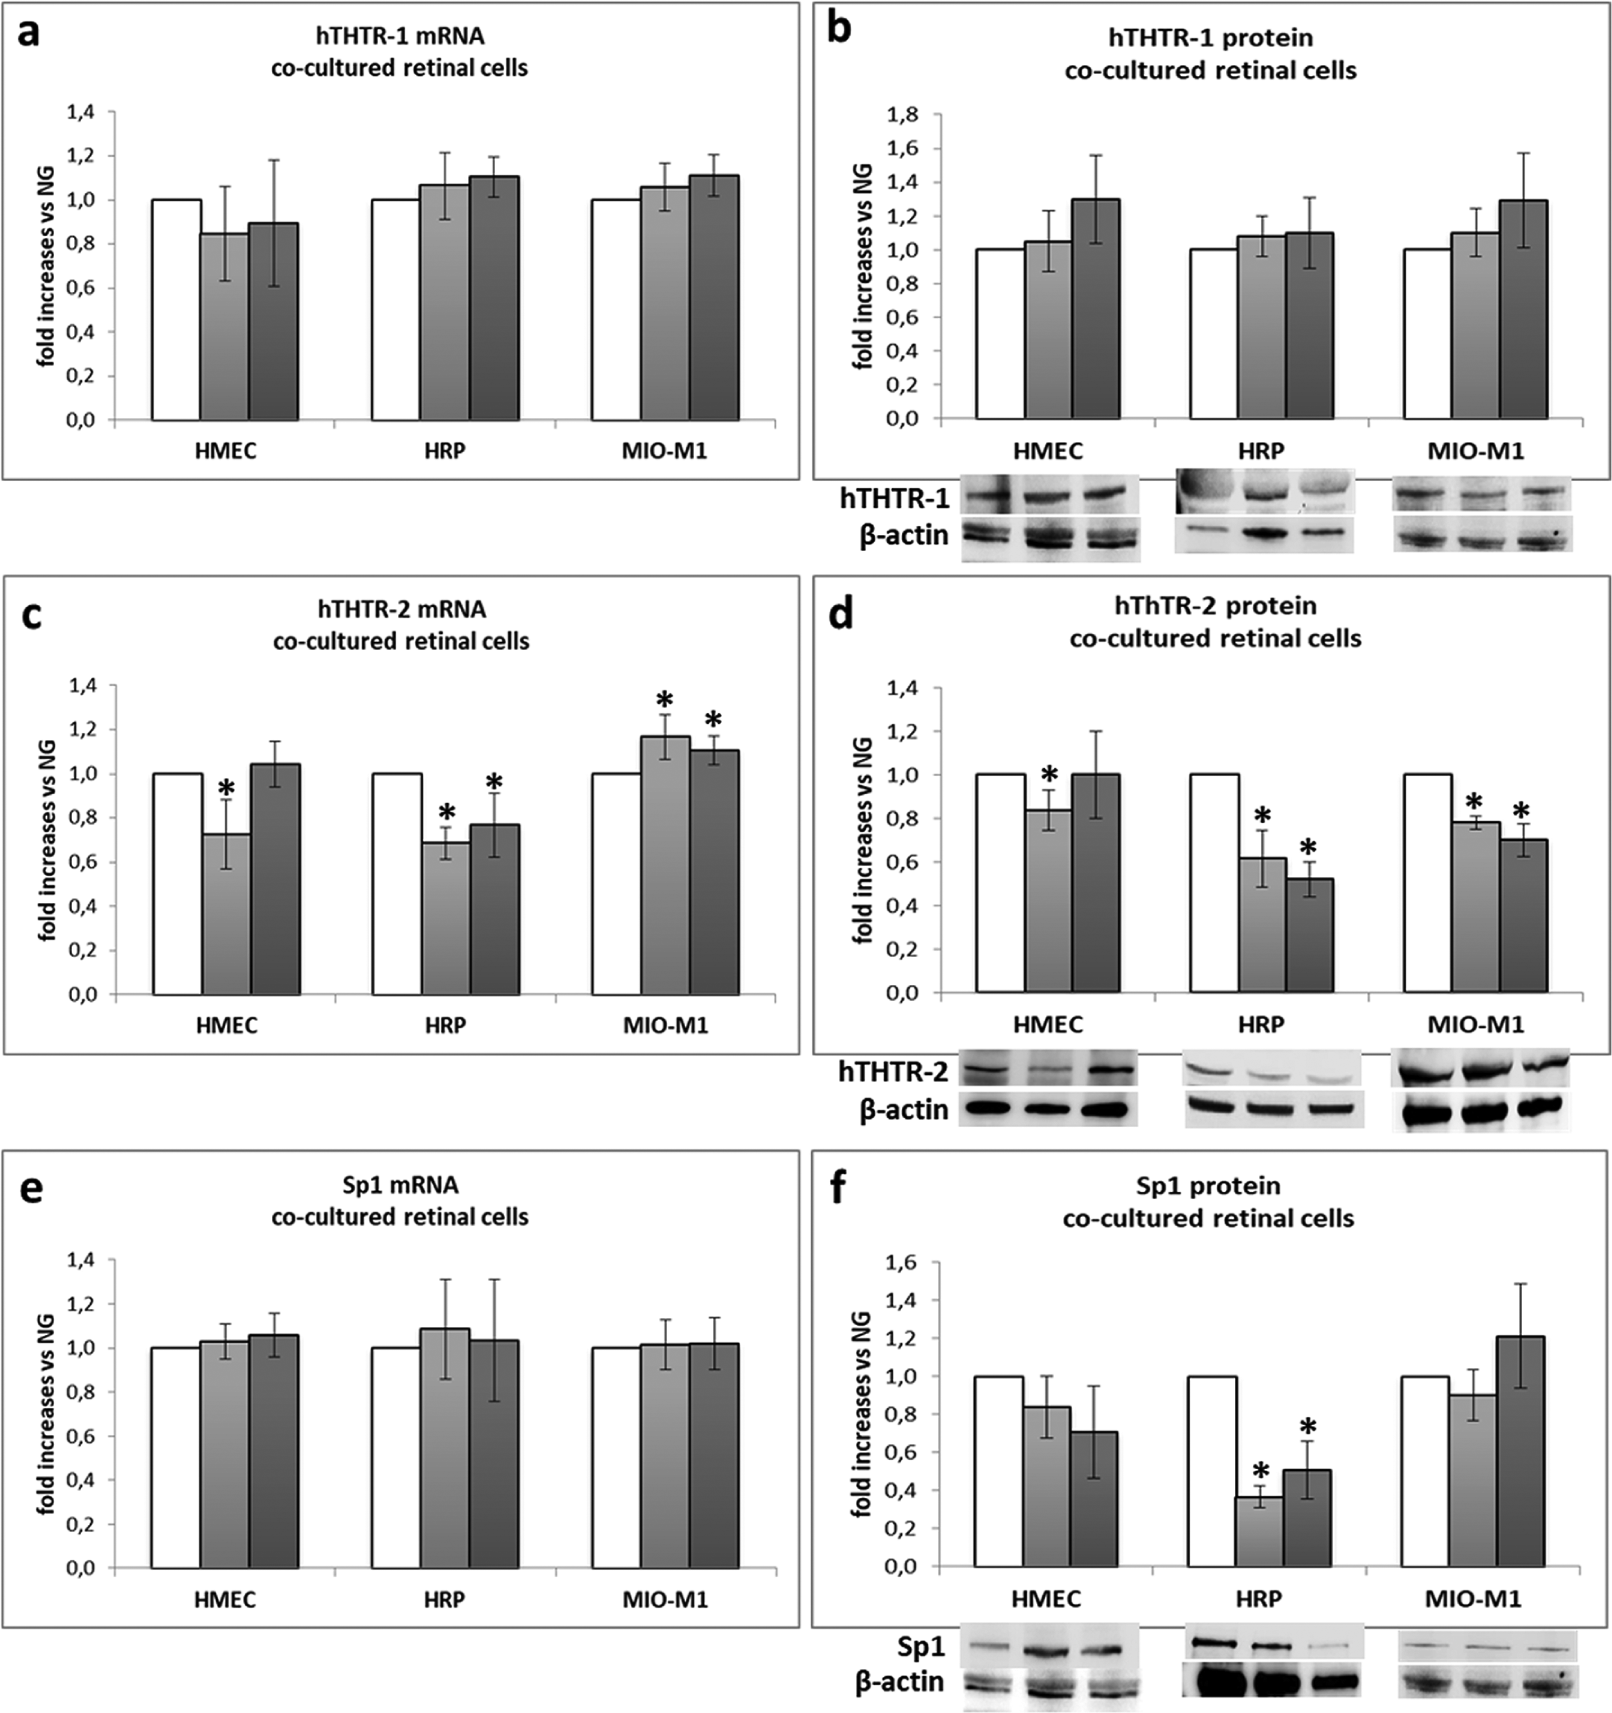
Expression of thiamine transporters and Sp1 in co-cultured retinal cells: (a) THTR1 mRNA and (b) protein expression; (c) THTR2 mRNA and (d) protein expression; (e) Sp1 mRNA and (f) protein expression. Mean of five experiments ± SD, plus representative images of one relevant WB experiment.
THTR2 mRNA expression showed a superimposable behaviour in co-cultured HRP and MIO-M1 cells with respect to single cultures. On the contrary, THTR2 mRNA expression in HMEC, which was increased in single cultures, appeared to decrease when cells were cultured in HG in the tri-co-culture system (Figure 5(c)). With regard to THTR2 protein expression, it decreased in HRP in HG and intHG (p < 0.05 vs NG), confirming single culture data, while it was unchanged in HMEC and even decreased in Müller cells in HG and intHG conditions (p < 0.05 vs NG) (Figure 5(d)). Sp1 mRNA expression was unchanged in all cell types (Figure 5(e)), while its protein expression decreased in HRP in HG and intHG conditions (p < 0.05 vs NG) (Figure 5(f)).
Intracellular thiamine uptake and TK activity in retinal cells
As indirect measures of thiamine transporter function, we investigated intracellular thiamine uptake and TK activity in retinal cells under all the different experimental conditions.
As expected, we found a dramatic decrease in thiamine uptake and a concomitant reduction in TK activity when HMEC and HRP were cultured in TD conditions (p < 0.001) (Figure 6(a) to (d)). Moreover, HRP showed a decrease in both parameters, when cultured in intHG conditions in comparison with physiological conditions (–15% and ‒13%, respectively, p < 0.05), while HT addition to intHG restored them (Figure 6(b) and (c)).
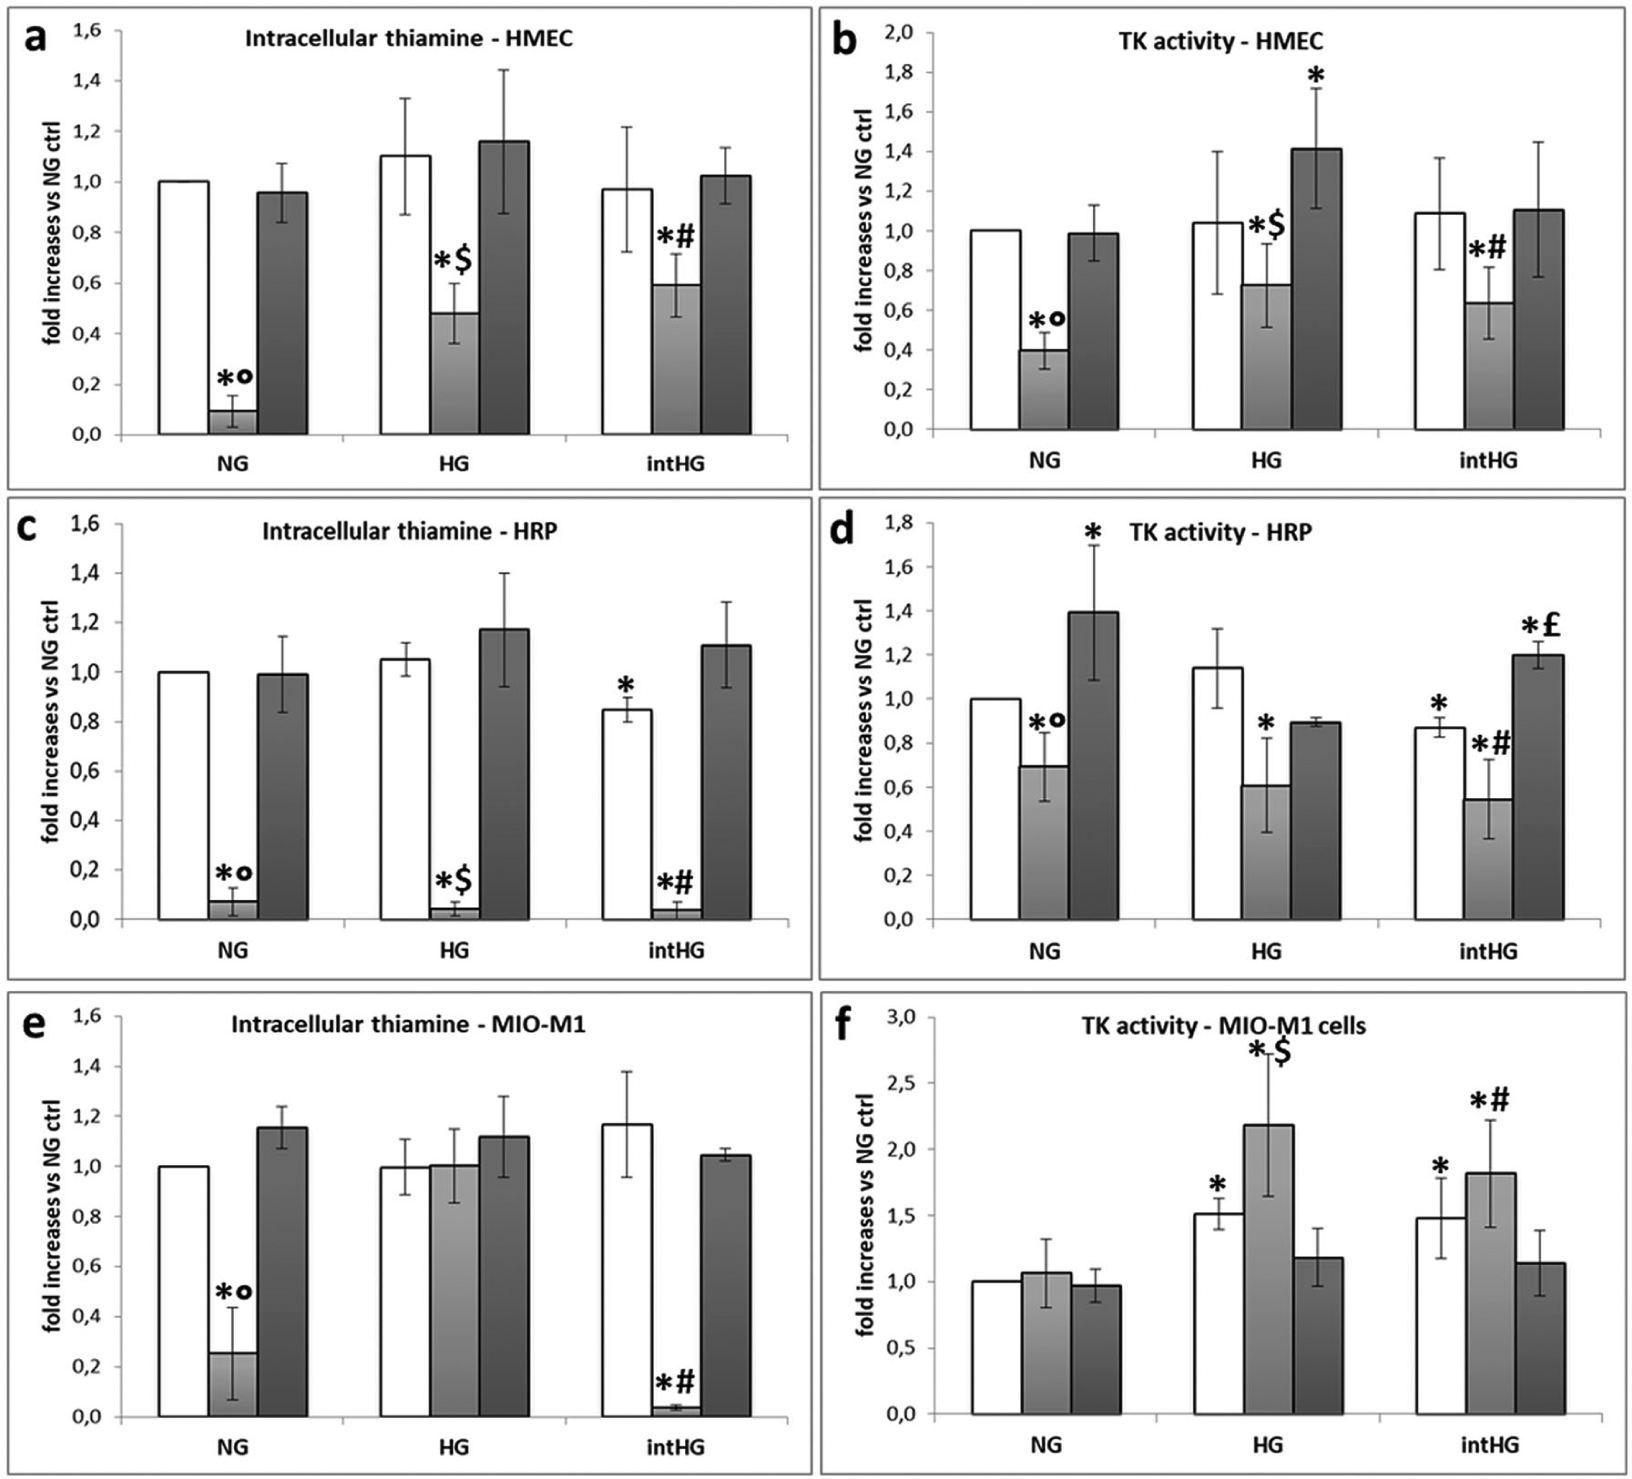
Intracellular thiamine uptake and transketolase (TK) activity in retinal cells: (a) intracellular thiamine uptake in HMEC, (b) TK activity in HMEC, (c) intracellular thiamine uptake in HRP, (d) TK activity in HRP, (e) intracellular thiamine uptake in MIO-M1 cells, and (f) TK activity in MIO-M1 cells.
Müller cells showed a different behaviour: thiamine uptake was decreased in NG TD and intHG TD, and unchanged when cells were grown in HG HT (Figure 6(e)). Moreover, TK activity was even increased in HG TD and intHG TD in comparison with physiological conditions (p < 0.05) (Figure 6(f)).
Permeability to thiamine of HMEC/HRP co-cultures
We assessed thiamine passage through HMEC/HRP confluent bilayers that had been previously exposed to all experimental conditions. As shown in Figure 7, thiamine release through the bilayer was decreased when HMEC/HRP had been previously exposed to TD, in all glucose conditions (p < 0.05 vs NG ctrl), and also when cells had been pre-treated with intHG (p < 0.05 vs NG ctrl).
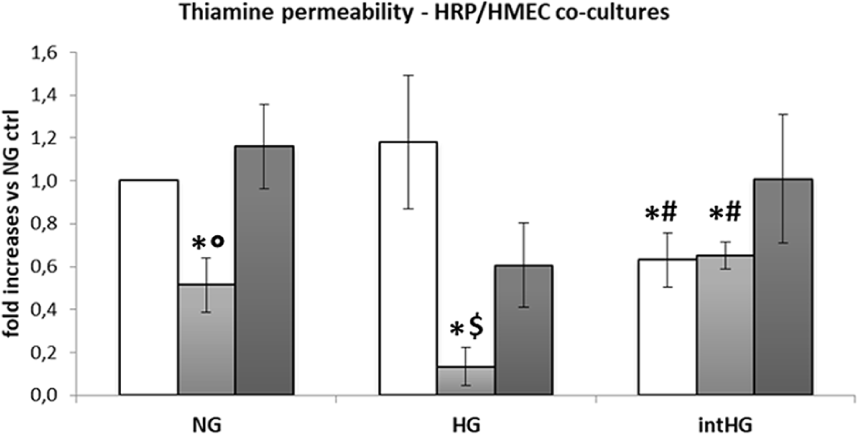
Permeability to thiamine of HMEC/HRP co-cultures.
Effects of thiamine deficiency on cell function
To evaluate the effects of thiamine depletion on cell function, we cultured HMEC, HRP and MIO-M1 cells in the three different glucose conditions in TD medium. As shown in Figure 8(a), cell number after 8-day incubation was significantly decreased in all cell types in TD media in comparison with physiological control (p < 0.05 vs NG ctrl). In HMEC, both HG and intHG conditions worsened this effect of a further 33% (p < 0.05 vs NG TD), while HRP number was decreased of a further 25% by intHG TD only (p < 0.05 vs NG TD and HG TD). Superimposable results were found in HMEC and HRP with regard to cell proliferation (Figure 8(b)), while MIO-M1 proliferation was not affected by TD. Thiamine depletion had no effect on apoptosis (Figure 8(c)) or migration (Figure 8(d)) in all cell types. Nevertheless, apoptosis was increased in HRP cultured in intHG TD conditions (+96% vs NG ctrl, p < 0.05 vs NG ctrl, NG TD, HG TD).
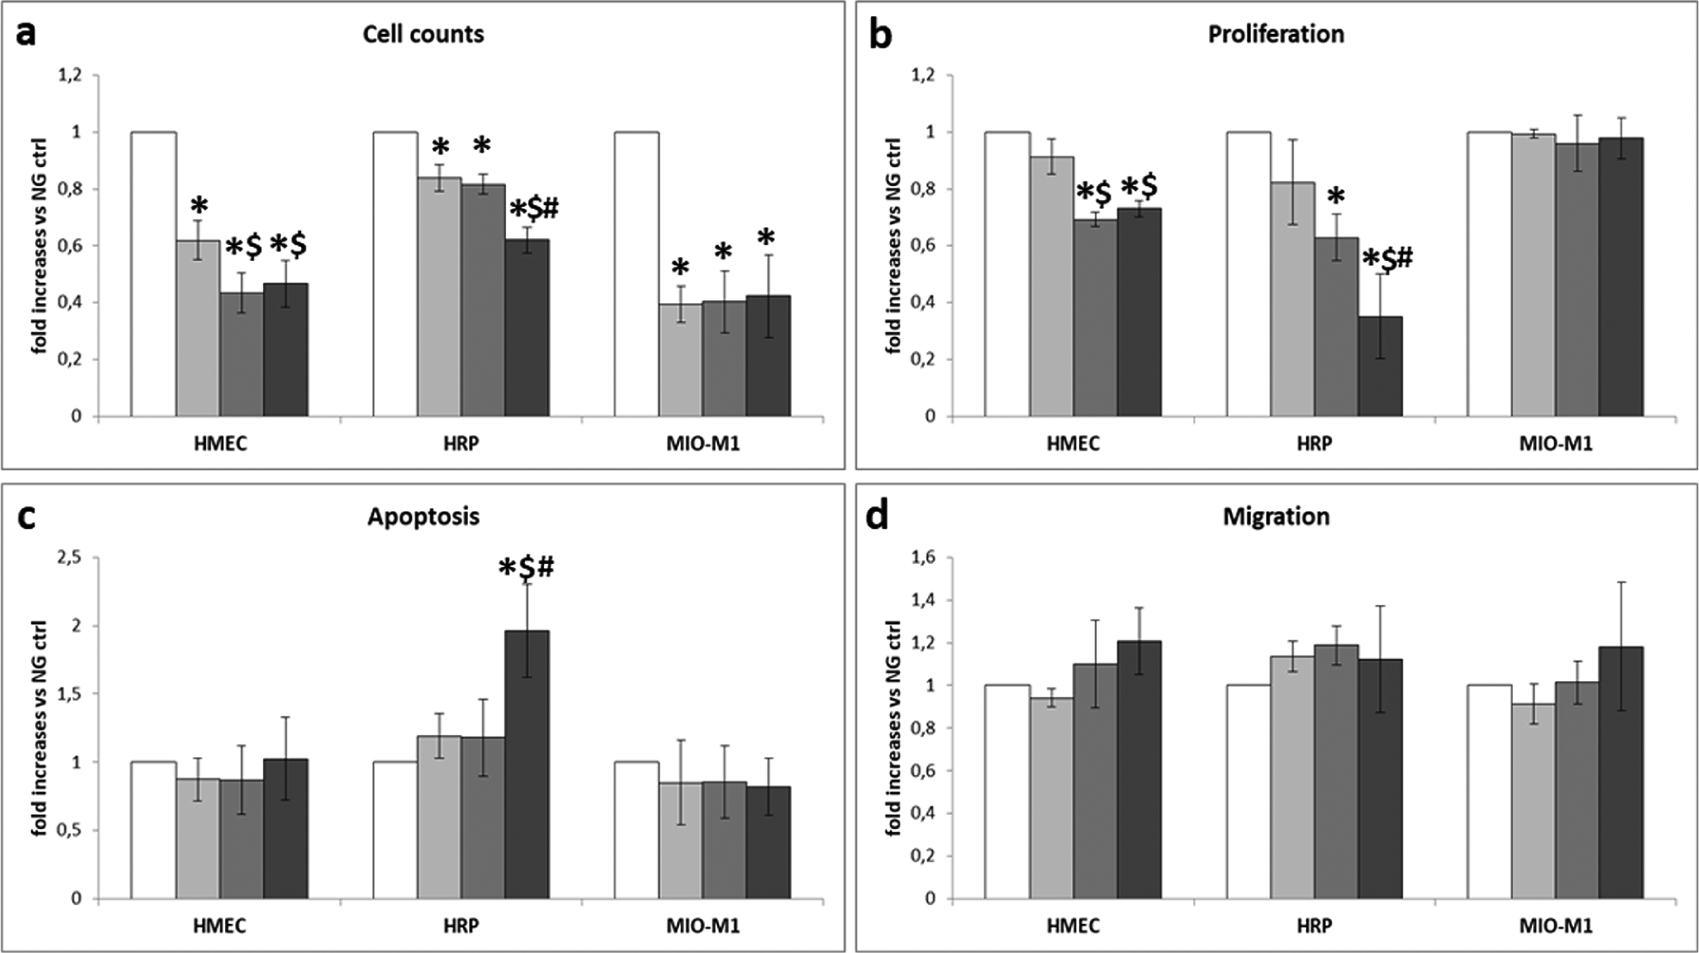
Metabolic effects of reduced thiamine availability in retinal cells: (a) number of cells, (b) cell proliferation, (c) apoptosis and (d) migration.
Discussion
In this work, we show that conditions mimicking a diabetic retinal microenvironment may influence the expression of thiamine transporters; in particular, THTR2 seems to be mainly affected by HG-induced damage in retinal cells. In addition, thiamine supplementation may help to by-pass THTR2 reduction by restoring, in pericytes, impaired thiamine uptake and TK activity due to damage induced by hyperglycaemic-like conditions.
We had previously demonstrated that HRPs are more sensitive to intermittent than to stable HG concentrations, in terms of survival and apoptosis. 28 This is not surprising, as diabetic patients undergo glycaemic fluctuations during the day. Similar results were also found with endothelial cells. 29 With regard to Müller cells, however, we have no evidence yet of major sensitivity to one or another HG model. Therefore, we decided to culture all cell types in both stable and intermittent HG concentrations, in order to obtain comparable data.
A major role for thiamine in the prevention of diabetic complications has been widely described.9,10 In particular, thiamine is able to counteract HG-induced damage in microvascular cells, by normalizing the four metabolic pathways enhanced by excess glucose, 7 and thus reducing ROS production.10,11 Moreover, its administration in diabetic animals reduces the progression of DR and nephropathy,10,12 and renal loss of this vitamin, with consequent reduced TK activity, was shown in diabetic patients. 13
Since thiamine is a water-soluble vitamin, non-saturable passive diffusion through the cell membrane may occur at pharmacological concentrations only. 15 Usually, at low, physiological concentrations, its internalization inside the cells involves phosphorylation and is mediated by two specific transporters, THTR1 and THTR2, 16 the expression of which is in turn mediated by the transcription factor Sp1.17,18 THTR1 deficiency is known to cause thiamine-responsive megaloblastic anaemia (TRMA), also called Rogers syndrome, characterized by megaloblastic anaemia, diabetes and sensorineural deafness.30,31 On the other hand, defects in SLC19A3 gene encoding for THTR2 and resulting in truncated proteins are responsible for biotin-responsive basal ganglial disease 32 and thiamine-responsive encephalopathy. 33 More recently, it has been demonstrated that two SNPs located in intronic regions of SLC19A3 are strongly associated with absent or minimal DR and DN despite long-duration type 1 diabetes, but their functional meaning is still unknown. 22
The distribution of the two transporters and their kinetics vary in different tissues. 19 While THTR1 and the transcription factor Sp1 seem to be more ubiquitous, THTR2 has been described mainly in the intestine, liver, kidney and placenta but is absent from marrow stem cells, pancreatic beta cells and cochlear hair cells of the inner ear.20,34-36 Predisposition to the development of diabetic microvascular complications may be related to the relative capacity of insulin-independent tissues to uptake enough thiamine to counteract excess glucose exposition. Our results demonstrate the presence of both transporters and Sp1 in all cells of the inner blood–retinal barrier, that is, endothelial cells, pericytes and Müller cells. THTR1 presents a cytoplasmic distribution in all cell types, consistently with the approved distribution by The Human Protein Atlas (https://www.proteinatlas.org/). On the contrary, THTR2 shows different locations: to the cytosol in ECs, while showing a nuclear bodies distribution in pericytes and Müller cells. These data are partially consistent with the approved distribution of THTR2 in the Human Protein Atlas which reports THTR2 to be mainly localized to the nucleoplasm and in addition to the cytosol. Also, the localization of Sp1 to the cytosol in our cell types differs from the nucleoplasm distribution reported by the Atlas. However, to our knowledge, this is the first time that thiamine transporter localization has been addressed in EC, pericytes and Müller cells, which are not comprised among those examined by the Atlas. Consequently, we can hypothesize that protein localization may present differences in such a peculiar microenvironment as the inner blood–retinal barrier. The internal cell localization of the transporters and Sp1 was confirmed in all experimental conditions, regardless of glucose and/or thiamine concentrations.
Previous findings show a certain degree of cell specificity as regards modulation of transporters and Sp1 in response to environmental changes in the concentration/availability of either glucose or thiamine. THTR1 expression was not affected by either thiamine supplementation or deficiency in epithelial Caco-2 cells, 21 while the same work reported increased THTR1 expression in ARPE-19 cells, inversely correlated to extracellular thiamine concentrations. 26 Decreased THTR1 expression was demonstrated in human primary proximal tubule epithelial cells cultured in HG concentrations. 20 Our data show no changes in THTR1 mRNA and protein expression in our cells in different glucose and/or thiamine concentrations. On the contrary, THTR2 expression shows different, cell-specific behaviours: overall increase in ECs and Müller cells and decrease in pericytes, in the presence of high/intermittent glucose conditions, independent from extracellular thiamine concentration. This apparent paradox can be again interpreted as cell specificity, and as such supported by the literature: THTR2 expression is down-regulated by HG conditions in human primary proximal tubule epithelial cells 20 and human umbilical vein endothelial cells (HUVECs), 37 and up-regulated by thiamine deficiency in Caco-2 21 and ARPE-19 cells. 26 Moreover, THTR2 expression is reported to be differently affected by other pathological conditions: down-regulated in the intestine, heart, liver and brain of Sprague-Dawley rats with chronic kidney disease 38 and up-regulated in breast cancer, 39 while no differences were recently found in erythrocytes and plasma levels of THTR2 in diabetic versus non-diabetic subjects. 37 THTR1 and THTR2 expression are modulated by their transcription factor Sp1: in our experimental setting, Sp1 expression is consistent with THTR2 expression in both ECs and pericytes, and substantially unchanged in Müller cells.
To investigate their possible mutual influence, we subsequently studied THTR1, THTR2 and Sp1 expression in ECs, pericytes and Müller cells cultured all together in a tri-co-culture system, aimed at partially mimicking the complex milieu of the inner blood–retinal barrier. In these conditions, pericytes showed the same behaviour as in single cultures: a decrease in THTR2 and Sp1 expression, and no variation in THTR1. On the contrary, ECs and Müller cells were influenced by the surrounding cell types, with both THTR2 mRNA and protein expression decreased in ECs co-cultured in HG, showing an opposite behaviour from single cultures. In Müller cells, while THTR2 mRNA expression increased consistently with single cultures, its protein concentration decreased in HG and intHG conditions. These findings confirm the need for using cell models as similar as possible to the retinal microenvironment.
As expected, intracellular thiamine concentration, and consequently TK activity, was dramatically decreased in ECs and pericytes exposed to TD media. In these cells, thiamine depletion strongly affects also viability and proliferation, while it has no effect on apoptosis and migration. However, these results were obtained in cells still attached to the wells; therefore, we cannot exclude that a part of the cells could have undergone apoptosis and detached during incubation. In pericytes, moreover, thiamine uptake and TK activity were also decreased in intermittent HG; in accordance with the decreased THTR2 expression, we found in these cells, while thiamine supplementation was able to restore physiological values when added to intHG. During DR, the hypoxic retinal environment induces the activation of hypoxia-inducible transcription factor-1 alpha (HIF-1α), which in turn causes vascular endothelial growth factor (VEGF) accumulation. VEGF is the main actor of neo-angiogenesis that is facilitated by the loss of pericyte control on endothelial proliferation. Recent evidence suggests that consistently with hypoxia, thiamine deficiency may determine increased HIF-1α and, consequently, VEGF expression, through an excess accumulation of pyruvate and lactate, 40 thus concurring to the worsening of DR.
On the contrary, Müller cells cultured in HG showed no decrease in intracellular thiamine concentration, even in TD conditions. This was associated with increased TK activity and THTR2 expression in Müller cells kept in the same conditions and suggests an adaptive regulation of thiamine uptake mediated by increased expression of the transporter, consistently with previous results on ARPE-19 cells, in which thiamine uptake was found to be inversely correlated with extracellular thiamine availability. 26 Moreover, Müller cells seem to be less affected by thiamine deficiency also in terms of proliferation, suggesting an overall reduced sensitivity of Müller cells to thiamine depletion, in comparison with microvascular cells.
Permeability to thiamine of ECs/pericytes co-cultures, that is, release of excess thiamine at the opposite side of the bilayer, was reduced in cells that had been previously grown in TD medium, probably due to an attempt of the cells, after 8-day starvation, to restore physiological intracellular concentrations of the vitamin. Concurrently, permeability to thiamine was also decreased in co-cultures exposed to intermittent HG conditions, and prevented by thiamine over-supplementation. This may be explained by the major requirement of thiamine inside the cell to counteract intermittent hyperglycaemia-induced damage. 9
We are aware that each model used to mimic diabetic retinal microenvironment has its own weaknesses. We have re-created a cell model of the inner blood–retinal barrier, as close as possible to retinal microvessels in diabetes, using human cells only. Moreover, pericytes and Müller cells are of retinal origin, even though they are cell lines and not primary cells. Our pericyte line was indeed validated for glucose metabolism studies, 23 and it showed superimposable behaviour towards glucose-induced damage to the primary cells from which it was derived. 28 The same applies to the Müller cell line. 24 With regard to HMEC, they are a cell line of dermal origin, but widely used as a model of microvascular ECs in works regarding several districts of the body, including DR. 41 In the future, the development of a reliable human retinal EC line will help avoiding this potential pitfall.
In conclusion, HG conditions concur with reduced substrate availability to determine impairment in thiamine transport inside retinal cells and through the inner blood–retinal barrier. The main actor of this damage seems to be THTR2, whose modulation in cell models mimicking the diabetic retinal microenvironment suggests its major role in thiamine transport in retinal cells and its involvement in HG-induced damage and impaired thiamine availability. Of the three retinal cell types we examined, pericytes seem to be the most sensitive to the impaired environmental conditions in terms of THTR2 modulation and altered thiamine uptake, confirming once more to be the first target of metabolic damage in the retinal microenvironment. Thiamine supplementation to diabetic patients may thus be foreseen as a strategy to prevent or counteract microvascular complications.
Key messages
Hyperglycaemia concurs with reduced thiamine availability to determine impairment in thiamine transport inside retinal cells and through the inner blood–retinal barrier.
Thiamine transporter 2 (THTR2) is modulated in cell models mimicking the diabetic retinal microenvironment.
THTR2 modulation suggests its primary role in thiamine transport inside retinal cells and its involvement in high glucose-induced damage and impaired thiamine availability.
Retinal pericytes are the most sensitive to the impaired environmental conditions in terms of THTR2 modulation and altered thiamine uptake, confirming to be the first target of metabolic damage in the retinal microenvironment.
Thiamine administration to diabetic subjects may help to prevent or counteract microvascular complications.
Supplemental Material
Beltramo_Suppl._mat.1 – Supplemental material for Thiamine transporter 2 is involved in high glucose-induced damage and altered thiamine availability in cell models of diabetic retinopathy
Supplemental material, Beltramo_Suppl._mat.1 for Thiamine transporter 2 is involved in high glucose-induced damage and altered thiamine availability in cell models of diabetic retinopathy by Elena Beltramo, Aurora Mazzeo, Tatiana Lopatina, Marina Trento and Massimo Porta in Diabetes & Vascular Disease Research
Footnotes
Declaration of conflicting interests
The author(s) declared no potential conflicts of interest with respect to the research, authorship and/or publication of this article.
Funding
The author(s) disclosed receipt of the following financial support for the research, authorship and/or publication of this article: This work was supported by the EFSD/Boehringer Ingelheim European Research Programme in Microvascular Complications of Diabetes, an EFSD/Lilly Research Fellowship, and the Italian Ministry of Education, Universities and Research (MIUR, Ricerca locale ex-60% 2016–2017).
Supplemental material
Supplemental material for this article is available online.
References
Supplementary Material
Please find the following supplemental material available below.
For Open Access articles published under a Creative Commons License, all supplemental material carries the same license as the article it is associated with.
For non-Open Access articles published, all supplemental material carries a non-exclusive license, and permission requests for re-use of supplemental material or any part of supplemental material shall be sent directly to the copyright owner as specified in the copyright notice associated with the article.