
Abstract
Objective
We evaluated the association of glucose control with changes in arterial stiffness, inflammatory markers, and oxidative stress markers.
Methods
Sixty-four patients with uncontrolled type 2 diabetes mellitus (glycated hemoglobin [HbA1c] ≥ 9%) and hypertension were enrolled in this study. The patients were divided into two groups based on their post-treatment HbA1c level: HbA1c ≤ 7% (well-controlled group, n = 28) and HbA1c > 7% (uncontrolled group, n = 36). The pulse wave velocity, augmentation index, and markers of inflammation and oxidative stress were measured and analyzed.
Results
The patients’ mean baseline HbA1c level was 11.7%. There were no differences in any baseline parameters between the two groups except the duration of diabetes. The mean HbA1c level was significantly lower at 12 weeks in the well-controlled than uncontrolled group (6.1% vs. 9.0%, respectively), but there were no significant differences in the pulse wave velocity (0.33 ± 0.95 vs. 0.36 ± 1.44 m/s), aortic augmentation index (5.1 ± 8.3 vs. 0.7 ± 11.6), or markers of inflammation and oxidative stress.
Conclusions
Short-term glycemic control did not influence the arterial stiffness in patients with type 2 diabetes mellitus and hypertension.
Keywords
Introduction
Type 2 diabetes mellitus (T2DM) and hypertension are two major risk factors for cardiovascular disease. Modification of these risk factors has been shown to reduce cardiovascular morbidity and mortality.
Glucose control, especially in patients with T2DM, is associated with decreased cardiovascular morbidity and mortality. 1 Although some large randomized controlled studies have shown that intensive blood glucose control does not improve cardiovascular mortality in patients with long-term diabetes and cardiovascular risks, extended studies have shown some benefit in cardiovascular events with intensive control.2–4 Specifically, early intensive glucose control in patients with newly diagnosed diabetes resulted in cardiovascular benefits that continued after 10 years in the United Kingdom Prospective Diabetes Study (UKPDS). 5 Thus, intensive glucose control from the early stage of diabetes is very important to prevent vascular complications. However, the exact mechanisms of how to reduce the incidence of cardiovascular disease by intensive control of hyperglycemia remain unknown.
Arterial stiffness, the pulse wave velocity (PWV), and central blood pressure are predictors of cardiovascular morbidity and mortality. 6 T2DM is one factor that increases arterial stiffness. A study in China showed a positive association between glycated hemoglobin (HbA1c) and arterial stiffness in patients with T2DM. 7 Another study showed that patients with T2DM and hypertension have greater arterial stiffness than patients with either T2DM or hypertension. 8 However, whether glycemic control in patients with T2DM improves arterial stiffness has not been determined. The purpose of the present study was to evaluate the change in arterial stiffness with glucose control and identify changes in inflammation and oxidative stress markers that may be influenced by arterial stiffness. Thus, we attempted to determine the direct effect of glucose control on arterial stiffness as an indicator of cardiovascular disease.
Methods
Study design and patients
This study was performed at St. Paul’s Hospital Diabetes Center at the Catholic University of Korea (Seoul, Korea). The inclusion criteria were the presence of T2DM, a diabetes duration of <10 years, an age of 30 to 70 years, an HbA1c level of >9%, body mass index of 20 to 30 kg/m2, and blood pressure of <140/90 mmHg with hypertensive medication. Patients who received medications that influenced their blood glucose level (e.g., steroids) and those with a serum creatinine level of >1.5 mg/dL, anemia, hepatic disease, ischemic heart disease, congestive heart failure (New York Heart Association class 2), or severe diabetic complications were excluded. Written informed consent was obtained from all patients before they participated in the study. The consent form and study protocol were approved by the hospital’s ethical review committee.
Patients with uncontrolled blood glucose levels (HbA1c > 9%) received insulin, oral hypoglycemic agents (metformin, sulfonylurea, alpha-glucosidase inhibitor, or dipeptidyl peptidase-4 inhibitor), or combined insulin and oral agents for 3 months. After the 3-month blood glucose-lowering intervention, the patients were divided into two groups according to their HbA1c level at 12 weeks: the well-controlled group (HbA1c < 7%) and the uncontrolled group (HbA1c ≥ 7%). We compared the arterial stiffness index, PWV, central blood pressure, and markers of inflammation and oxidative stress between the two groups before and after improvement in glycemic control.
Measurements
All patients underwent a standard physical examination and routine clinical laboratory tests. Arterial blood pressure was measured twice in the right arm using a mercury sphygmomanometer in the morning when patients were resting, and the mean systolic and diastolic pressures were calculated. The body mass index was calculated as body weight divided by the square of the height (kg/m2).
Arterial stiffness
Arterial stiffness was measured using an applanation tonometer (SphygmoCor; AtCor Medical Inc., Sydney, Australia). One examiner measured the PWV, augmentation index, and central blood pressure before and after the 3-month glucose-lowering intervention.
Laboratory measurements
After an overnight fast, venous blood samples were obtained from each patient. The fasting glucose, HbA1c, total cholesterol, triglycerides, and high-density lipoprotein cholesterol levels were measured using standard techniques.
Adiponectin, interleukin-6, C-reactive protein, and plasminogen activator inhibitor-1
Morning blood samples were collected from each patient before and after the study following overnight fasting. Serum samples were immediately frozen and stored at −70°C until analysis.
Adiponectin was measured by enzyme-linked immune assay (ELISA) (R&D Systems, Minneapolis, MN, USA) according to the manufacturer’s instructions. The levels of interleukin (IL)-6 (Cayman Chemical Company, Ann Arbor, MI, USA), high-sensitivity C-reactive protein (hs-CRP) (Abnova, Taipei City, Taiwan), and plasminogen activator inhibitor (PAI)-1 (R&D Systems) were measured using an ELISA kit.
Urinary 8-hydroxy-2′-deoxyguanosine
After an overnight fast, morning urine samples were collected from each patient before and after the study. Urine samples were stored at −70°C until analysis. Urinary 8-hydroxy-2′-deoxyguanosine (8-OHDG) was measured using a commercial ELISA kit (Cayman Chemical Company).
Statistical analysis
Baseline clinical characteristics were compared between the two groups. Continuous variables are expressed as mean ± standard deviation. Univariate statistical analysis was performed using the Mann–Whitney U test for continuous independent samples and the chi-square test for categorical variables. Repeated-measures analysis of variance using a hierarchical linear model was performed to analyze changes in the central hemodynamic parameters, PWV, and markers of oxidative stress and inflammation in each group. Statistical analyses were performed using SPSS for Windows, version 11.0 (SPSS Inc., Chicago, IL, USA). A P value of <0.05 was considered to indicate a statistically significant difference with a 95% confidence interval.
Results
Eighty patients were enrolled. Sixteen patients were excluded because they were lost to follow-up or withdrew consent. Sixty-four patients completed the study.
The patients’ baseline characteristics are summarized in Table 1. The mean age was 54.5 years, and the mean baseline HbA1c level was 11.7%. Twenty-eight patients (44%) were included in the well-controlled group and 36 (56%) were included in the uncontrolled group according to the HbA1c level at 12 weeks. The blood pressure levels were not different between the two groups. However, the mean duration of T2DM was significantly shorter in the well-controlled than uncontrolled group (1.3 vs. 6.6 years, respectively; P = 0.001).
Baseline characteristics of the patients

Data are expressed as mean ± standard deviation or n (%).
Controlled group, HbA1c ≤ 7.0% after 12 weeks; uncontrolled group; HbA1c > 7.0% after 12 weeks.
BMI, body mass index; T2DM, type 2 diabetes mellitus; HbA1c, glycated hemoglobin; HDL, high-density lipoprotein; LDL, low-density lipoprotein.
Baseline measurements of the PWV, augmentation index, and other arterial stiffness markers were not different except for the central aortic pulse pressure and augmentation pressure. The pulse pressure and augmentation pressure were significantly lower in the well-controlled than uncontrolled group (P = 0.007 and P = 0.016, respectively) (Table 2). There were also no differences in the baseline levels of inflammation markers (hs-CRP and IL-6), adiponectin, PAI-1, and urinary 8-OHDG between the two groups.
Baseline central hemodynamic parameters, PWV, and markers of oxidative stress in the two groups
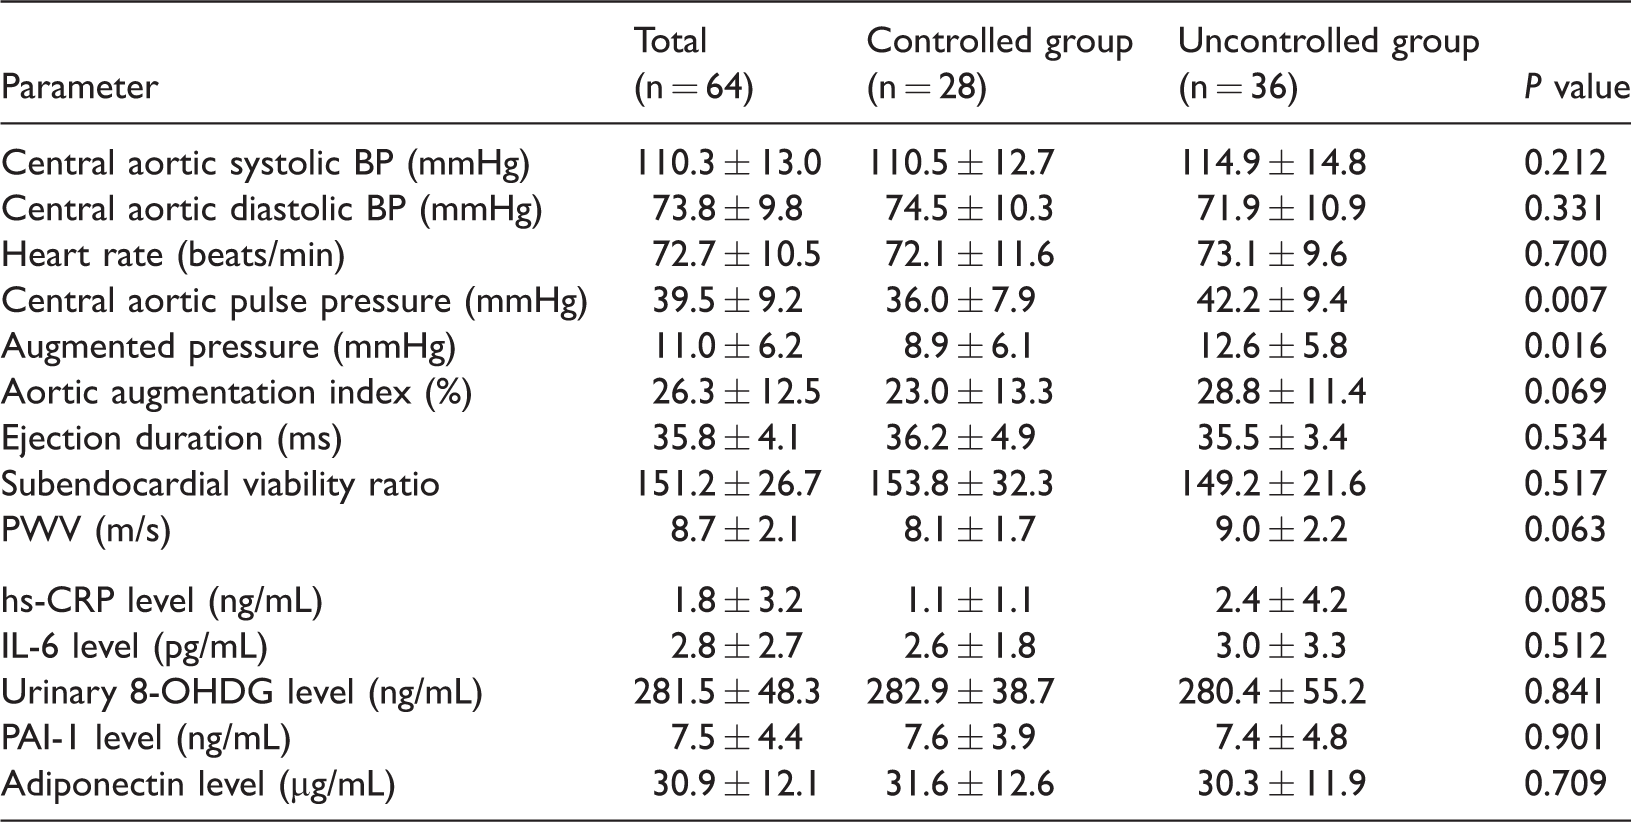
Data are expressed as mean ± standard deviation.
Controlled group, HbA1c ≤ 7.0% after 12 weeks; uncontrolled group; HbA1c > 7.0% after 12 weeks.
BP, blood pressure; hs-CRP, high-sensitivity C-reactive protein; IL, interleukin; PAI-1, plasminogen activator inhibitor-1; PWV, pulse wave velocity; 8-OHDG, 8-hydroxy-2′-deoxyguanosine
After 12 weeks, the mean HbA1c level was 6.1% in the well-controlled group and 9.0% in the uncontrolled group. Table 3 shows the changes in the arterial stiffness indexes between the two groups. There were no between-group differences in the changes in the arterial stiffness indexes except for the central aortic pulse pressure and augmentation pressure, which were maintained at a lower level in the well-controlled than uncontrolled group (P = 0.039 and P = 0.044, respectively). There were no significant changes in the PWV or aortic augmentation index.
Changes in the central hemodynamic parameters and PWV in the two groups for 12 weeks

Data are expressed as mean ± SD.
P value is for difference between data at baseline and after 12 weeks in the controlled group
Controlled group, HbA1c ≤ 7.0% after 12 weeks; uncontrolled group; HbA1c > 7.0% after 12 weeks.
PWV, pulse wave velocity; BP, blood pressure
The markers of oxidative stress and inflammation, including the urinary 8-OHDG, hs-CRP, IL-6, PAI-1, and adiponectin levels, did not improve in the well-controlled group compared with the uncontrolled group during the 12-week study period (Table 4).
Changes in markers of oxidative stress and inflammation in the two groups after 12 weeks

Data are expressed as mean ± standard deviation.
P value is for difference between data at baseline and after 12 weeks in the well-controlled group
Controlled group, HbA1c ≤ 7.0% after 12 weeks; uncontrolled group, HbA1c > 7.0% after 12 weeks.
hs-CRP, high-sensitivity C-reactive protein; IL-6, interleukin-6; PAI-1, plasminogen activator inhibitor-1; 8-OHDG, 8-hydroxy-2′-deoxyguanosine
Discussion
In the present study, the degree of glycemic control for 12 weeks did not significantly affect arterial stiffness in patients with T2DM. In addition, the markers of inflammation and oxidative stress did not change according to the patients’ post-treatment glycemic status after treatment.
Some studies have reported an association between arterial stiffness and glycemic changes. Yamamoto et al. 9 reported that a 2-week admission program in patients with T2DM improved the brachial-ankle PWV (baPWV) and metabolic status. In particular, the baPWV was significantly associated with the systolic blood pressure and fasting glucose level. Tomiyama et al. 10 conducted a 3-year observational study of a middle-aged Japanese male cohort and reported synergistic acceleration of the baPWV in subjects with both a raised blood pressure and raised plasma glucose level compared with subjects with either a raised blood pressure or plasma glucose level alone. However, these studies did not directly evaluate whether glucose control improved the arterial stiffness indexes. Additionally, they measured peripheral artery indexes, not central artery indexes.
In the present study, no change was observed in the central arterial stiffness indexes according to the patients’ glucose control status for 12 weeks. Although arterial stiffness is an outcome of chronic progressive diabetes, we established a 12-week treatment period because the above-mentioned study by Yamamoto et al. 9 showed improvement of the baPWV and metabolic status within a shorter period of intensive treatment (2 weeks). However, 12 weeks of glucose control may be insufficient for observing a change in arterial stiffness. In the UKPDS, the cardiovascular benefit of intensive glucose control became apparent 10 years later. 11 Another study showed that intensive blood glucose control reduced cardiovascular events after a mean follow-up of 5.6 years. 12 Thus, short-term glycemic control might be insufficient for changing the cardiovascular indexes. However, T2DM was independently associated with arterial stiffness in roughly 52% of the reported studies compared with blood pressure and age, which were associated with arterial stiffness in 90% of the reported studies. 13 It is possible that diabetes is not a main determinant of arterial stiffness because it accounts for only 5% of the variation in PWV. 13 Therefore, the glycemic status may have little effect on arterial stiffness, as indicated by our results.
In terms of inflammatory and oxidative stress markers, several studies have shown that acute and low-grade chronic inflammation also increases arterial stiffness. 14 Chronic hyperglycemia can augment the production of proinflammatory cytokines and other inflammatory pathways in vascular endothelial cells by forming advanced glycation end products (AGEs) and AGE-modified proteins. 15 In the present study, the hs-CRP level tended to decrease in the well-controlled group, but this did not achieve statistical significance. This finding may have been significant if the duration of the well-controlled state had been longer. Schnell et al. 16 conducted a cluster-randomized study in the primary care setting and reported that a reduction in the hs-CRP level by 12 months was associated with a reduction in the HbA1c level. The other inflammation markers, IL-6 and PAI-1, were also not different between the groups. Diabetes-associated hyperglycemia promotes oxidative stress mediated by reactive oxygen formation and the carbonyl group. 17 However, the levels of urinary 8-OHDG and oxidative stress markers in the well-controlled group also did not differ from those in the uncontrolled group after treatment. Another reason for the lack of differences between the groups is that all patients received glucose-lowering treatment. Therefore, the HbA1c levels of the two groups were significantly lower than those at baseline. This may have made it difficult to detect differences between the two groups.
In the comparison of the parameters between baseline and 12 weeks, the data of both groups had deteriorated after 12 weeks of treatment. With the exception of the hs-CRP level, this finding is inconsistent with previous studies. Regardless of the substantial improvement in the HbA1c level in the well-controlled group, the inflammatory and oxidative stress markers tended to deteriorate. However, these changes were not significant. We considered that these results might have been caused by the small number of patients and the fact that 12 weeks was too short for correction of the insulin resistance. Additionally, the different treatment modalities (various antidiabetic drugs, various antihypertensive drugs, and insulin injection) might have influenced the patients’ insulin resistance.
The central pulse pressure is a predictive risk factor for cardiovascular morbidity because it reflects systolic afterload.18,19 The augmentation pressure also predicts major cardiovascular events and death independently of the pulse pressure. 20 At baseline, the well-controlled group had a shorter diabetic duration and lower pulse pressure and augmentation pressure than the uncontrolled group. The pulse pressure and augmentation pressure were still lower than those in the uncontrolled group after treatment. These findings are plausible because early glucose control helps to delay cardiovascular morbidity.
Conclusion
This study showed a significant difference not in arterial stiffness according to the change in the HbA1c level but in the diabetic duration between the well-controlled group and uncontrolled group. There are two major limitations of this study. The first is the short follow-up period used for evaluation of the arterial stiffness, which is a known outcome of chronic progressive diabetes. Thus, the results are not applicable to patients with long-term glycemic control. The second limitation is the small number of patients in whom the differences in the change in arterial stiffness were observed. The minor limitation is a result of the indiscriminate use of various oral hypoglycemic agents to correct the hyperglycemia. Some drugs (e.g., dipeptidyl peptidase-4 inhibitors) may influence arterial stiffness by improving endothelial dysfunction. However, the results of this study may suggest that intensive treatment to ensure good glycemic control from the early diabetic stage is important to improve the increased cardiovascular risk in patients with T2DM.
Footnotes
Authors' contributions
SA Chang and JM Lee designed the study; JH Kim, SA Chang, TS Sohn, and JM Lee performed the research; SA Chang and HS Son analyzed the data; and SA Change wrote the paper. All authors read and approved the final manuscript.
Declaration of conflicting interests
The authors declare that there is no conflict of interest.
Funding
This study was supported by an unrestricted grant from Daiichi Sankyo Co., Ltd., Korea.
No other potential conflicts of interest relevant to this article were reported.