
Abstract
Background:
This pooled analysis assessed the efficacy of ertugliflozin versus placebo as monotherapy or with other antihyperglycaemic agents across patient subgroups defined by demographic and disease characteristics.
Methods:
Data from three phase III randomised, placebo-controlled, double-blind studies (NCT01958671, NCT02033889 and NCT02036515) with similar designs and populations were pooled (N = 1544).
Results:
At Week 26, placebo-adjusted least squares mean changes from baseline in glycated haemoglobin with ertugliflozin 5 and 15 mg were −0.8% (95% confidence interval: −0.9, −0.7) and −0.9% (–1.0, −0.8), respectively. Reductions were consistent across subgroups. Placebo-adjusted least squares mean changes in body weight were −1.8 kg (−2.2, −1.4) for both ertugliflozin doses; for systolic blood pressure, these were −3.4 mmHg (−4.8, −2.0) and −3.5 mmHg (−4.9, −2.0) for ertugliflozin 5 and 15 mg, respectively. Higher proportions of patients receiving ertugliflozin had glycated haemoglobin <7.0%, weight loss ⩾5% and systolic blood pressure <130 mmHg versus placebo. Ertugliflozin and placebo safety profiles were similar, including incidences of hypoglycaemia, urinary tract infection and hypovolaemia. Genital mycotic infection and adverse events related to osmotic diuresis were more common with ertugliflozin.
Conclusion:
Ertugliflozin demonstrated efficacy as monotherapy or with other antihyperglycaemic agents in patients with different demographic and disease characteristics and was generally well tolerated.
Keywords
Introduction
Sodium–glucose cotransporter 2 (SGLT2) inhibitors are a class of antihyperglycaemic agents that has been associated with a low risk of hypoglycaemia and reductions in body weight and blood pressure.1,2 These agents inhibit renal glucose reabsorption, increasing urinary glucose excretion and reducing plasma glucose and glycated haemoglobin (HbA1c) levels.1,2 Improved cardiovascular outcomes with SGLT2 inhibitors have been observed in the three large, randomised, placebo-controlled studies reported to date3–5 and in two real-world studies.6–8 In accordance with treatment guidelines, SGLT2 inhibitors are recommended for use either alone or in combination with other antihyperglycaemic agents. 9
Ertugliflozin is a highly selective SGLT2 inhibitor that has been recently approved in the United States and the European Union to improve glycaemic control in adults with type 2 diabetes mellitus (T2DM).10,11 In phase III clinical studies in the VERTIS (eValuation of ERTugliflozin effIcacy and Safety) clinical programme, ertugliflozin improved glycaemic control either alone or in combination with metformin and/or the dipeptidyl peptidase-4 (DPP-4) inhibitor sitagliptin.12–17 Benefits beyond glycaemic control (i.e. reductions in blood pressure and body weight) were also demonstrated.12–17
In this article, we present a pooled analysis of the effect of ertugliflozin 5 and 15 mg on glycaemic control, body weight and blood pressure based on data up to Week 26 from three placebo-controlled studies in the VERTIS clinical programme.12–14 Ertugliflozin was administered as monotherapy in one study, as add-on therapy to metformin in a second study and as add-on to metformin plus sitagliptin in a third study.12–14 The analysis was designed to explore the effects of ertugliflozin in a larger patient population than in the individual primary studies, as well as in subgroups defined by baseline demographic and disease characteristics.
Materials and methods
The objective of this pooled analysis was to assess changes from baseline in glycaemic parameters, body weight and blood pressure with ertugliflozin 5 and 15 mg relative to placebo in the overall pooled population and in patient subgroups.
Data sources
Data were pooled from three phase III studies with similar study populations and designs: VERTIS MONO (protocol MK-8835-003; clinicaltrials.gov identifier NCT01958671); 12 VERTIS MET (protocol MK-8835-007; clinicaltrials.gov identifier NCT02033889) 13 and VERTIS SITA2 (protocol MK-8835-006; clinicaltrials.gov identifier NCT02036515). 14
All studies contributing data to this analysis were conducted in accordance with principles of Good Clinical Practice and were approved by the appropriate institutional review boards and regulatory agencies. Informed consent was obtained from individuals in each study. The analyses in this article are based on previously conducted studies and do not involve any new studies of human or animal subjects performed by any of the authors.
Patients and data sources
Details of inclusion criteria, exclusion criteria and study design for the individual studies have been previously reported.12–14 Briefly, adults with T2DM according to the American Diabetes Association criteria 18 with baseline HbA1c levels of 7.0–10.5% (inclusive) were enrolled. The requirements for background antihyperglycaemic therapy at study entry were no concomitant background antihyperglycaemic therapy (i.e. diet and exercise alone) in VERTIS MONO; 12 concomitant metformin monotherapy (⩾1500 mg/day) in VERTIS MET; 13 and concomitant metformin (⩾1500 mg/day) and sitagliptin (100 mg/day) in VERTIS SITA2. 14 Key exclusion criteria included mean value for triplicate sitting systolic blood pressure (SBP) > 160 mmHg and/or diastolic blood pressure (DBP) > 90 mmHg at any time during screening (patients receiving blood pressure medication must have had a stable regimen for ⩾4 weeks prior to randomisation), unstable body weight (defined as ⩾5% change in body weight in the previous 6 months), receipt of a weight loss medication or other medication associated with weight changes and bariatric surgery within 12 months of screening.
The primary efficacy time point of the three individual studies was Week 26 (double-blind, placebo-controlled treatment periods); data up to this time point are included in this pooled analysis.
Patients were randomised 1:1:1 to placebo, ertugliflozin 5 mg or ertugliflozin 15 mg once daily. Glycaemic rescue therapy was prescribed for patients who exceeded the following fasting plasma glucose (FPG) thresholds: >15.0 mmol/L after randomisation up to Week 6; >13.3 mmol/L after Week 6 and up to Week 12; and >11.1 mmol/L after Week 12 and up to Week 26.12–14
Endpoints and assessments
The efficacy endpoints reported for the pooled analysis were the changes from baseline in HbA1c, body weight and SBP at Week 26. The proportions of patients meeting specific targets for each efficacy endpoint (HbA1c <7.0%, body weight reduction from baseline of ⩾5% and SBP <130 mmHg [among patients with baseline SBP ⩾130 mmHg]) at Week 26 are also reported.
In each study, patients received counselling on diet and were asked to maintain a routine exercise programme with consistent physical activity throughout the study. Body weight was measured using a standardised digital scale; measurements were taken in duplicate at the same time of day after voiding and while wearing only a gown (or light clothing) and underwear. Sitting blood pressure was measured in triplicate with an automated oscillometric blood pressure measuring device.
Safety and tolerability of ertugliflozin across the pooled studies were assessed through the overall incidences of adverse events (AEs) and serious AEs (SAEs), the incidences of prespecified AEs of interest for SGLT2 inhibitors (symptomatic hypoglycaemia and AEs of urinary tract infection, genital mycotic infection [by gender] and hypovolaemia) and the incidence of AEs related to osmotic diuresis.
Statistical methods
Pooling of data from the three studies was prespecified in the analysis plan for the integrated analysis of efficacy with regard to change from baseline in HbA1c, percentage of patients with HbA1c <7.0% and change from baseline in body weight. The analyses of the proportions of patients meeting specific targets for each efficacy endpoint (body weight reduction from baseline of ⩾5%, change from baseline in SBP and proportion of patients with SBP <130 mmHg [among patients with baseline SBP ⩾130 mmHg]) in the pooled population were performed post hoc. The analyses of change from baseline in HbA1c and body weight conducted in patient subgroups were prespecified.
The efficacy analyses excluded measurements obtained after initiation of glycaemic rescue therapy in order to eliminate the confounding effect of rescue medication. Changes from baseline in efficacy parameters were analysed using a longitudinal data analysis (LDA) model with fixed effects for treatment, time, study, baseline eGFR and the interaction of time by treatment. The LDA model-based efficacy analyses were conducted on the population of all randomised and treated patients who had at least one measurement of the analysis endpoint at or after baseline. The LDA model uses the maximum likelihood principle to account for missing data without explicit imputation. The differences in least squares (LS) mean with 95% confidence interval (CI) for pairwise comparisons of ertugliflozin 5 or 15 mg versus placebo were calculated. Adjusted odds ratios (OR) relative to placebo were calculated for the endpoint of proportion of patients at Week 26 reaching HbA1c < 7.0% (using a logistic regression model with fixed effects for treatment, baseline A1C, baseline eGFR, and study and missing data were imputed using the constrained LDA model). For the endpoints of body weight reduction from baseline of ⩾5%, and SBP <130 mmHg (among patients with SBP ⩾130 mmHg at baseline) at Week 26, differences in proportions of patients were calculated, and 95% CI was determined using the Miettinen and Nurminen method. 19 Patients with missing data at Week 26 were considered nonresponders.
The following subgroups were analysed for change from baseline in HbA1c and body weight using a repeated measures analysis of covariance (RMANCOVA) model: age (<65 or ⩾65 years); sex; race (White, Black, Asian or other); ethnicity (Hispanic/Latino or not Hispanic/Latino); region (North America, Europe, Asia or other); baseline body mass index (BMI; <25, 25 to <30, 30 to <35 or ⩾35 kg/m2); baseline eGFR (<60, 60 to <90 or ⩾90 mL/min/1.73 m2); duration of T2DM (<5, 5 to <10 or ⩾10 years); and baseline HbA1c level (<8.0%, 8.0% to <9.0% or ⩾9.0%). The RMANCOVA model was adjusted for treatment, time, study, baseline eGFR, baseline value of the response variable and the interaction of time by treatment. These subgroup analyses were conducted in the population of all randomised and treated patients in the three studies who had a baseline measurement and at least one post-baseline measurement.
The safety analyses conducted in the pooled population of all randomised and treated patients in the three studies were prespecified. The analyses included data obtained after the initiation of glycaemic rescue therapy, with the exception of symptomatic hypoglycaemia. The incidences of prespecified AEs of interest were analysed using the Miettinen and Nurminen method. 19
Results
Patient population
A total of 1544 randomised and treated patients were included in the analysis (461 from VERTIS MONO, 621 from VERTIS MET and 462 from VERTIS SITA2). Of these, 515 received placebo, 519 received ertugliflozin 5 mg and 510 received ertugliflozin 15 mg. Patient demographic and baseline clinical characteristics were well balanced across treatment groups (Table 1). Overall, two-thirds of patients had a history of hypertension.
Baseline demographics and clinical characteristics.
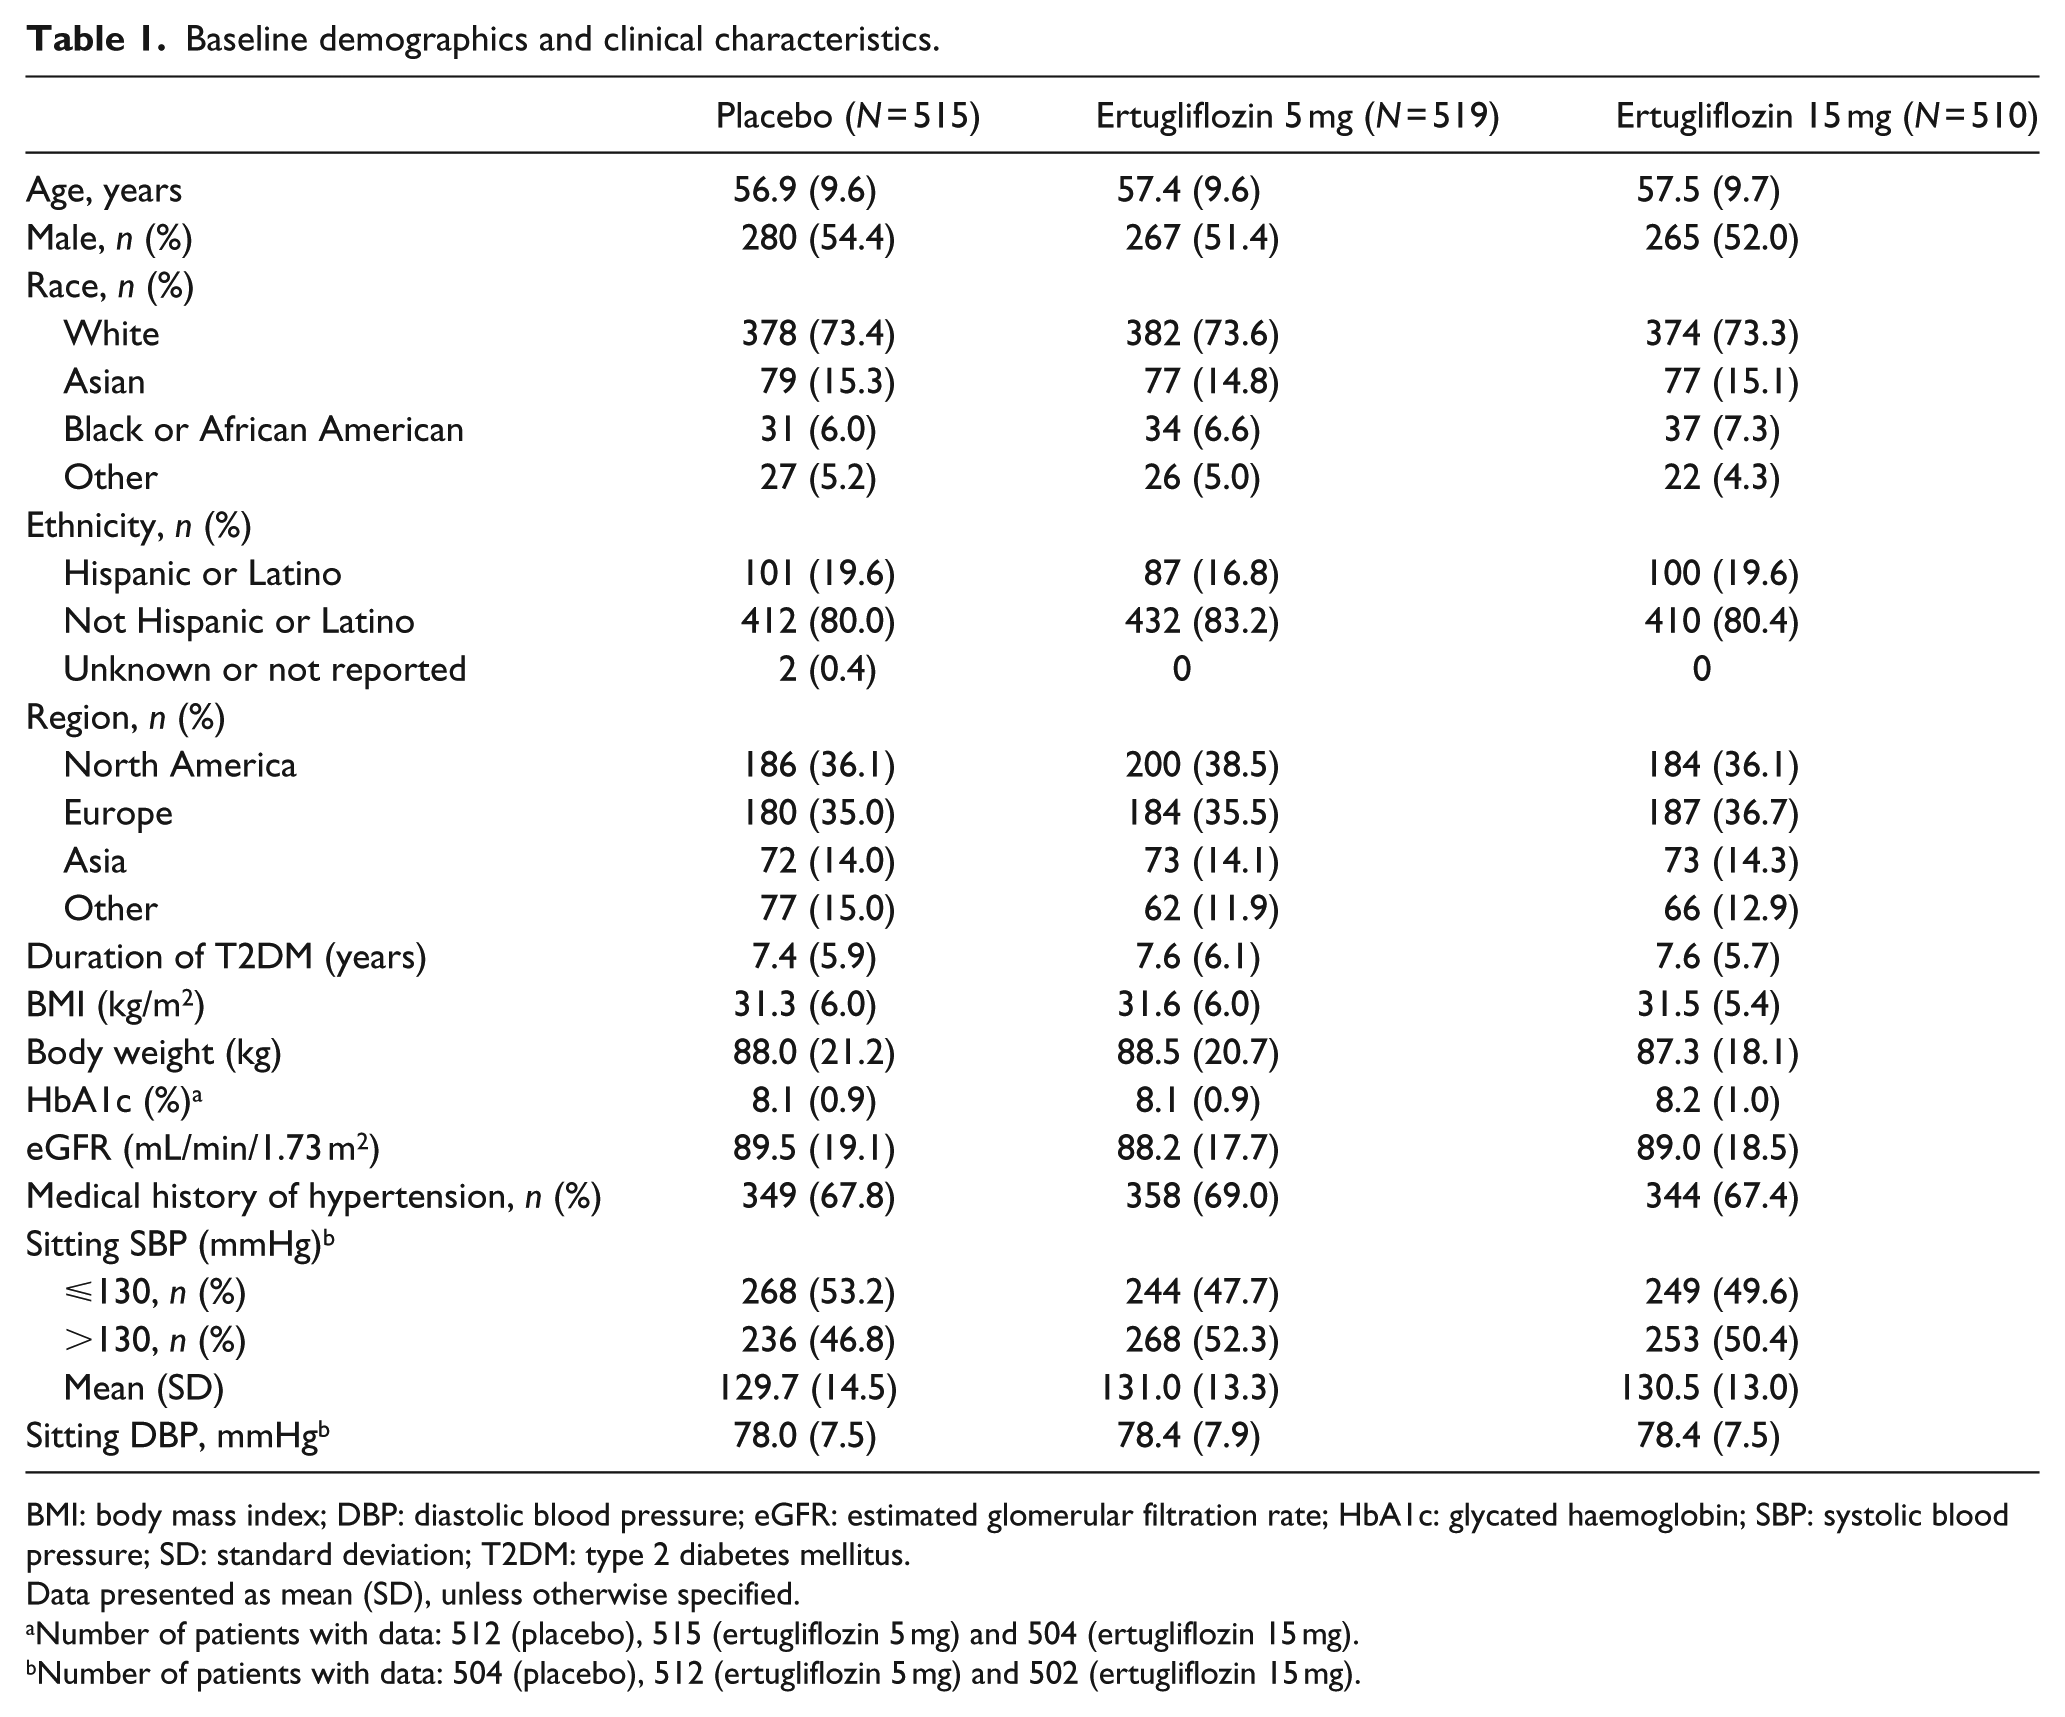
BMI: body mass index; DBP: diastolic blood pressure; eGFR: estimated glomerular filtration rate; HbA1c: glycated haemoglobin; SBP: systolic blood pressure; SD: standard deviation; T2DM: type 2 diabetes mellitus.
Data presented as mean (SD), unless otherwise specified.
Number of patients with data: 512 (placebo), 515 (ertugliflozin 5 mg) and 504 (ertugliflozin 15 mg).
Number of patients with data: 504 (placebo), 512 (ertugliflozin 5 mg) and 502 (ertugliflozin 15 mg).
Glycaemic control
At Week 26, the reduction in HbA1c from baseline was greater with both doses of ertugliflozin than with placebo. The LS mean change from baseline in HbA1c was 0.0% (95% CI: −0.1, 0.1) for placebo, −0.8% (–0.8, −0.7) for ertugliflozin 5 mg and −0.9% (–1.0, −0.8) for ertugliflozin 15 mg (Figure 1(a)). The results were consistent with those of the individual studies (Figure 1(b)).12–14 A higher proportion of patients receiving ertugliflozin had an HbA1c < 7.0% at Week 26 compared with placebo (Figure 1(c)); the adjusted ORs (95% CI) relative to placebo were 2.9 (2.1, 4.0) for ertugliflozin 5 mg and 4.7 (3.4, 6.5) for ertugliflozin 15 mg.
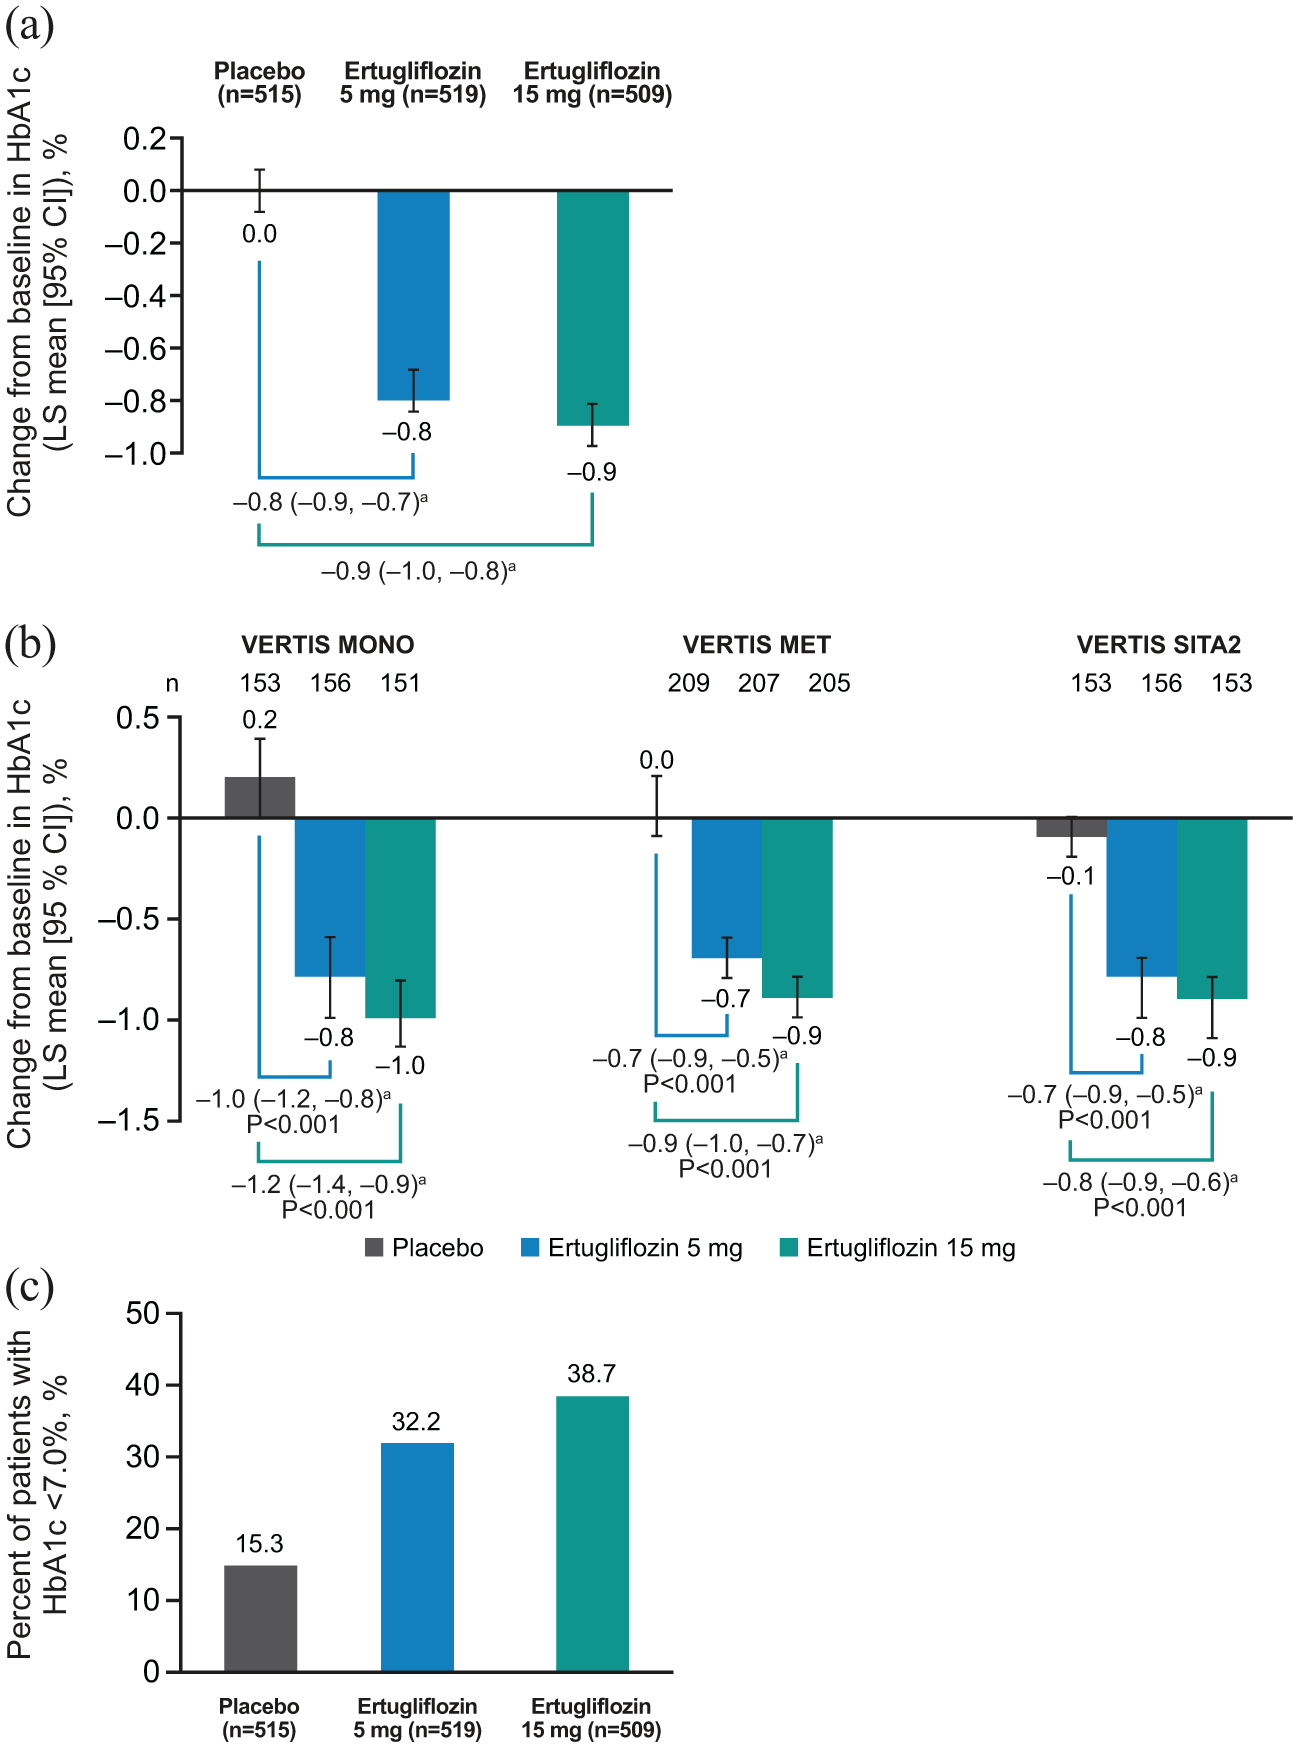
Change from baseline in HbA1c at Week 26 in (a) the pooled population and (b) the individual studies; (c) percentage of patients with HbA1c <7.0% at Week 26 in the pooled population.
In patients treated with ertugliflozin, reductions from baseline in HbA1c were observed across all subgroups. The 95% CIs of the placebo-adjusted LS mean change excluded zero for all subgroup categories, except eGFR < 60 mL/min/1.73 m2 for both ertugliflozin doses and race (other, which included American Indian, Alaska Native, Native Hawaiian, Other Pacific Islander and Multi-Racial) for ertugliflozin 5 mg (Figure 2(a)), although it should be noted that patient numbers were small in some subgroups. In the subgroup analysis according to baseline HbA1c, the LS mean placebo-adjusted change from baseline was greater in patients with the highest baseline HbA1c level (⩾9.0%) compared with patients who had lower baseline levels (<8.0% and 8.0% to <9.0%; Figure 2(b)).
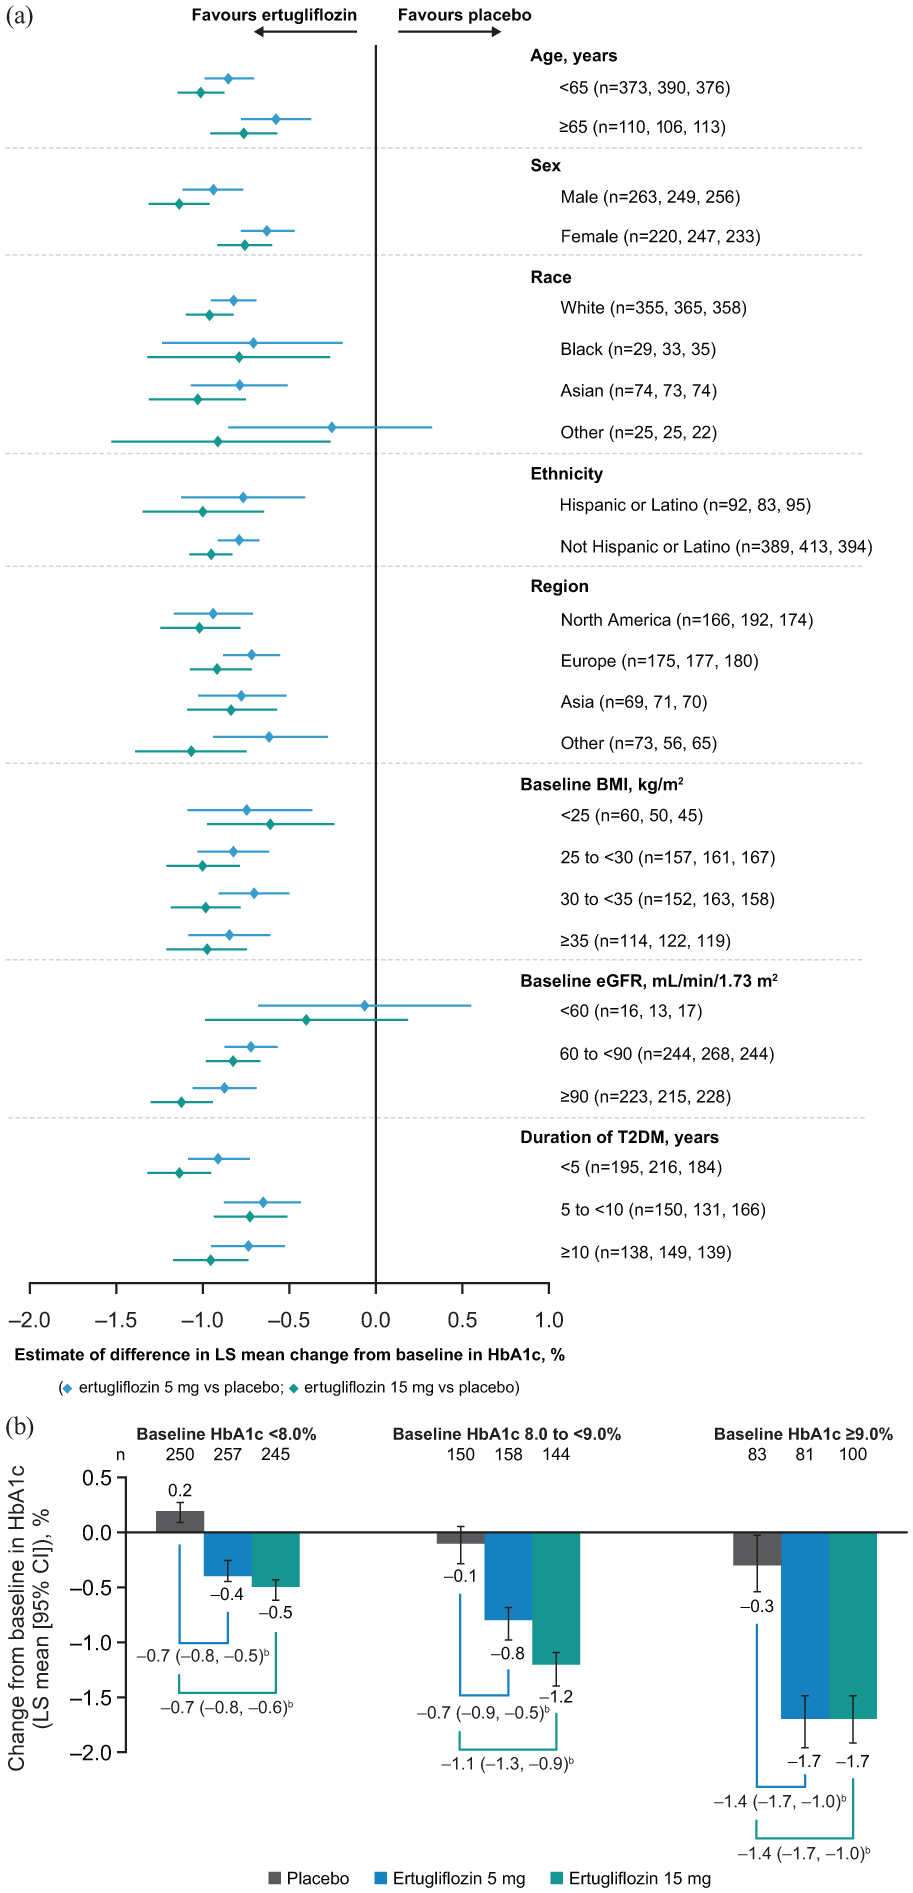
(a) Estimate of placebo-adjusted change from baseline in HbA1c at Week 26 in the pooled population by subgroup categorya and (b) change from baseline in HbA1c at Week 26 in the pooled population by baseline HbA1c.
Across the three studies, the proportion of patients who received glycaemic rescue ranged from 16.3% to 25.5% in the placebo groups and was <3% in both ertugliflozin groups in each study.12–14
Body weight
After 26 weeks, treatment with both doses of ertugliflozin resulted in a greater reduction in body weight from baseline than placebo. The LS mean (95% CI) change from baseline was −1.4 kg (–1.6, −1.1) for placebo, −3.2 kg (−3.4, −2.9) for ertugliflozin 5 mg and −3.2 kg (−3.4, –2.9) for ertugliflozin 15 mg (Figure 3(a)). Almost one-third of patients who received either dose of ertugliflozin achieved body weight reductions of ⩾5% from baseline at Week 26 compared with only 10.5% of patients who received placebo (Figure 3(b)). The differences in proportions (95% CI) relative to placebo for body weight reductions of ⩾5% from baseline were 19.4% (14.6, 24.1) for ertugliflozin 5 mg and 18.3% (13.6, 23.1) for ertugliflozin 15 mg.
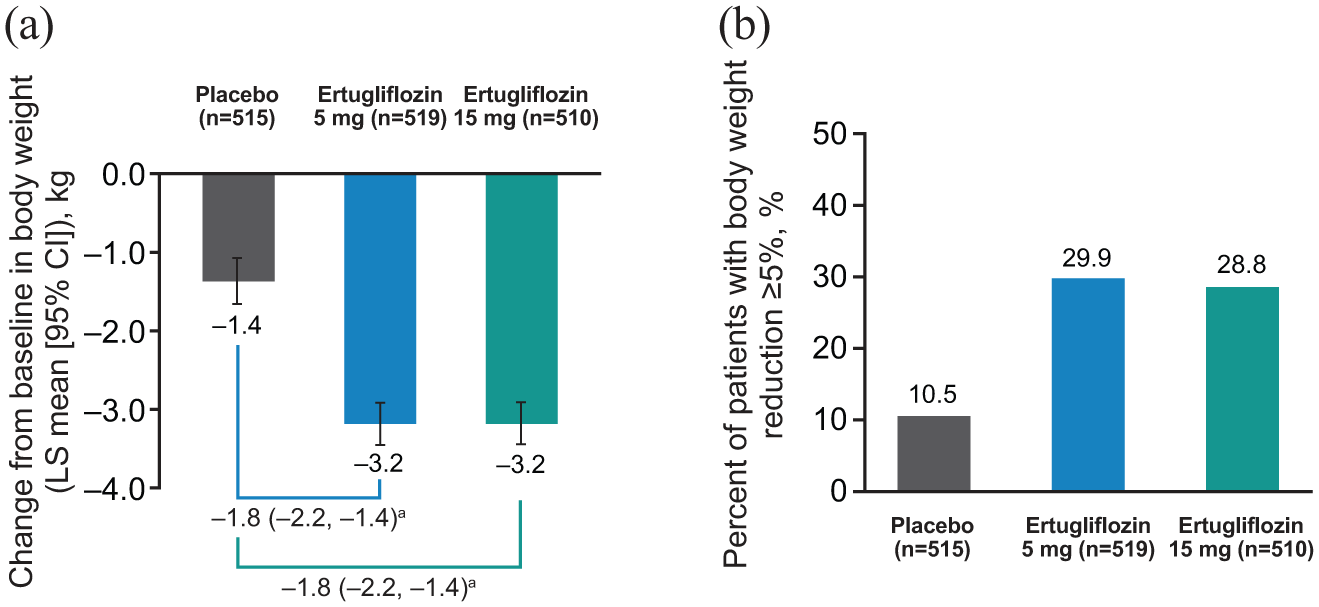
(a) Change from baseline in body weight at Week 26 in the pooled population. (b) Percentage of patients achieving body weight reduction from baseline ⩾5% at Week 26 in the pooled population.
The change in body weight from baseline was generally consistent across the subgroup categories tested, while acknowledging that subgroups with small patient numbers had wide 95% CIs (Supplementary Figure 1).
Blood pressure
Treatment with ertugliflozin 5 and 15 mg resulted in a greater reduction from baseline in SBP compared with placebo at Week 26. The LS mean change from baseline (95% CI) was −1.2 mmHg (−2.3, −0.1) for placebo, −4.6 mmHg (−5.6, −3.6) for ertugliflozin 5 mg and −4.7 mmHg (−5.7, −3.7) for ertugliflozin 15 mg (Figure 4(a)). The proportion of patients among those with SBP ⩾130 mmHg at baseline who subsequently achieved SBP < 130 mmHg at Week 26 was higher in the two ertugliflozin groups than in the placebo group (Figure 4(b)). The differences in proportions (95% CI) relative to placebo were 16.9% (9.3, 24.4) and 18.0% (10.2, 25.6) for ertugliflozin 5 and 15 mg, respectively.
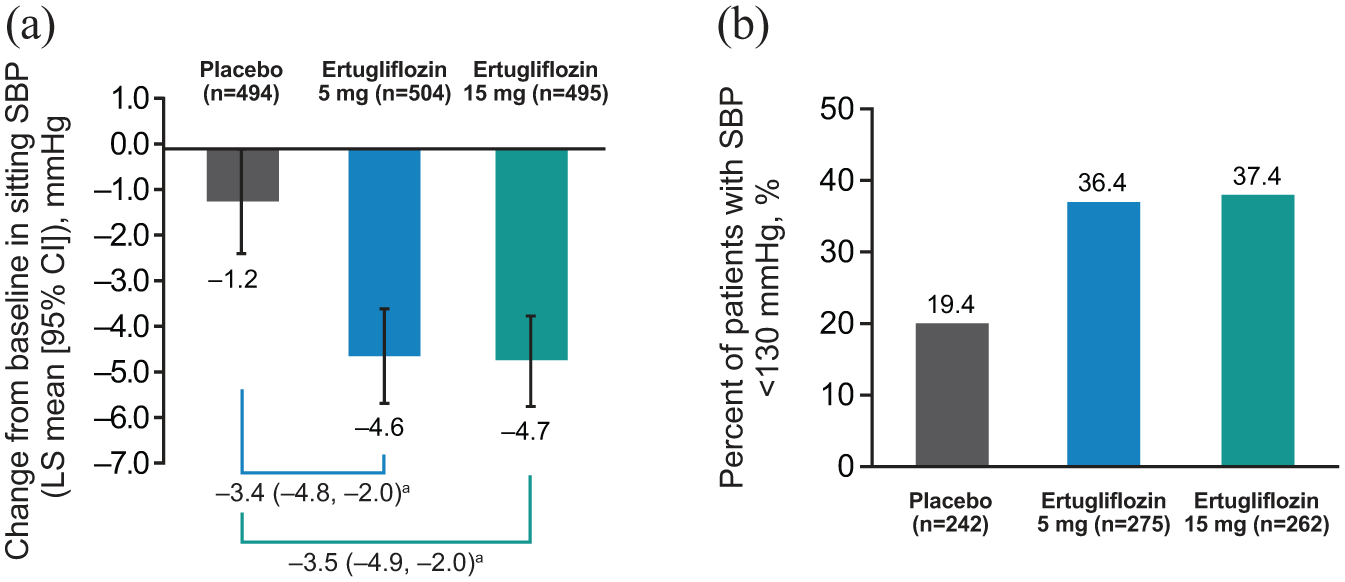
(a) Change from baseline in sitting SBP at Week 26 in the pooled population. (b) Percentage of patients achieving SBP <130 mmHg at Week 26 in the pooled population (of those with baseline SBP ⩾130 mmHg).
Safety
The overall safety profile of ertugliflozin was generally similar to that of placebo, with a similar rate of AEs, SAEs and discontinuations due to AEs (Table 2). However, drug-related AEs occurred in a higher proportion of patients in the ertugliflozin groups than in the placebo group. Among the prespecified AEs of interest, the incidences of symptomatic hypoglycaemia, urinary tract infection and hypovolaemia were similar in the placebo and ertugliflozin groups, but there was a higher rate of genital mycotic infections with ertugliflozin than with placebo in both men and women. AEs related to osmotic diuresis were also more common with ertugliflozin (Table 2).
Summary of overall safety and prespecified AEs.
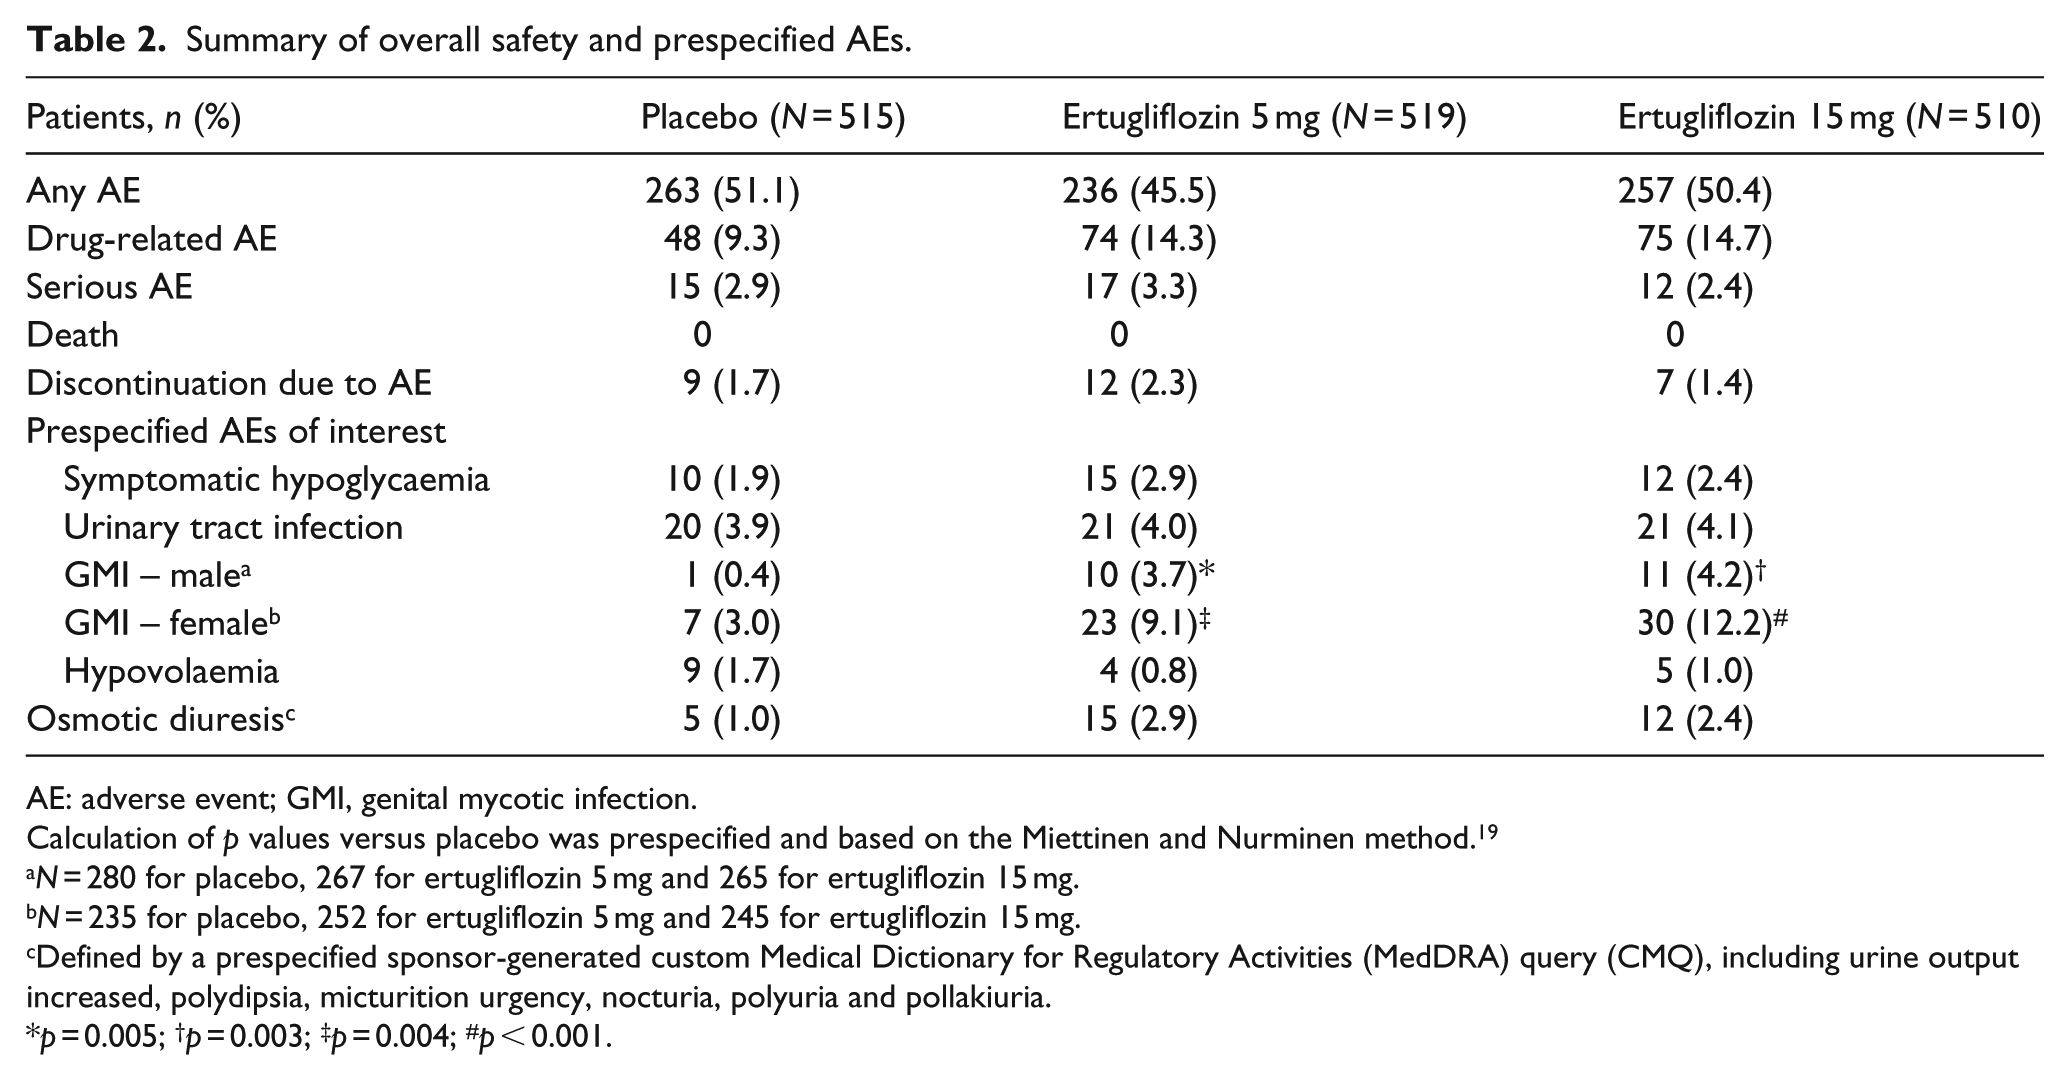
AE: adverse event; GMI, genital mycotic infection.
Calculation of p values versus placebo was prespecified and based on the Miettinen and Nurminen method. 19
N = 280 for placebo, 267 for ertugliflozin 5 mg and 265 for ertugliflozin 15 mg.
N = 235 for placebo, 252 for ertugliflozin 5 mg and 245 for ertugliflozin 15 mg.
Defined by a prespecified sponsor-generated custom Medical Dictionary for Regulatory Activities (MedDRA) query (CMQ), including urine output increased, polydipsia, micturition urgency, nocturia, polyuria and pollakiuria.
p = 0.005; †p = 0.003; ‡p = 0.004; #p < 0.001.
Discussion
In this pooled analysis of data from three phase III placebo-controlled, randomised studies, ertugliflozin 5 and 15 mg (as monotherapy, dual therapy with metformin or triple therapy with metformin and sitagliptin) resulted in greater reductions in HbA1c after 26 weeks of treatment compared with placebo; these reductions were consistent across patient subgroups. Greater mean reductions in body weight and SBP were also observed with ertugliflozin versus placebo. In general, the results of this pooled analysis are consistent with those of the individual studies,12–14 other phase III studies of ertugliflozin,15–17 and systematic meta-analyses and pooled analyses of other SGLT2 inhibitors.20–26
Greater reductions in HbA1c relative to placebo were seen in patients with higher baseline levels of HbA1c, as seen with all classes of antihyperglycaemic drugs, including other SGLT2 inhibitors.27,28 Overall, the data indicate that ertugliflozin 5 and 15 mg provide reductions from baseline in HbA1c in patients with a wide range of baseline HbA1c levels when used as monotherapy or as dual or triple therapy in combination with different background therapies. This is important because the progressive nature of T2DM means that as beta-cell function declines and HbA1c levels rise over time, different background therapies need to be combined to maintain glycaemic control.
Greater reductions in HbA1c levels were also observed in patients with normal renal function compared with those with renal impairment, as observed in other studies of SGLT2 inhibitors,29,30 although these results should be interpreted with caution due to the small number of patients in the subgroup with eGFR <60 mL/min/1.73 m2. This was because patients with eGFR <60 mL/min/1.73 m2 were excluded from the VERTIS SITA2 study, and patients with eGFR < 55 mL/min/1.73 m2 were excluded from VERTIS MONO and VERTIS MET. A dedicated study of ertugliflozin in patients with renal impairment has been conducted separately and found no significant difference overall in HbA1c reduction between ertugliflozin and placebo groups although evaluation of the endpoint was impacted by prohibited metformin use. 31
This analysis confirmed that patients treated with ertugliflozin were more likely to achieve metabolic goals related to HbA1c levels and weight loss. Similarly, of patients with SBP ⩾130 mmHg at baseline, more patients treated with ertugliflozin achieved the recommended SBP <130 mmHg at Week 26 compared with placebo. Cardiovascular morbidity is the major contributor to death in patients with T2DM, and a substantial proportion of such morbidity is related to poor glycaemic control, obesity and hypertension. 32 Management of such cardiovascular risk factors can reduce the excess risk of death in patients with T2DM. 33 This analysis and many others have shown the benefits of ertugliflozin and other SGLT2 inhibitors on these endpoints.12–17, 20–24
In this pooled analysis, both doses of ertugliflozin were generally well tolerated, with an overall safety profile similar to that of placebo. Of the prespecified AEs of interest for SGLT2 inhibitors, only the incidence of genital mycotic infections in both men and women showed a significant difference from placebo. The occurrence of genital mycotic infections is a known class effect of SGLT2 inhibitors. 34 The incidences of symptomatic hypoglycaemia and hypovolaemia were low and similar in all groups. AEs related to osmotic diuresis were more common with ertugliflozin compared with placebo.
A strength of the analysis was that the similar design and endpoints of the three primary studies allowed data to be pooled, providing a larger group of patients than in each individual study. This allowed for a more robust analysis of ertugliflozin efficacy in a variety of patient subgroups. All results of the pooled analysis were, in general, consistent with those of the individual studies and were as expected based on previous ertugliflozin clinical studies.12–17 The present analysis has some limitations, including the post hoc nature of the analysis of the proportions of patients with body weight reduction from baseline of ⩾5%, change from baseline in SBP and proportion of patients with SBP <130 mmHg (among patients with baseline SBP ⩾130 mmHg). The results of subgroup analysis should be interpreted with caution given the lack of within-subgroup randomisation, the lower precision of the estimates for small sample sizes for subgroups and the impact of unadjusted multiple subgroup analyses.
In conclusion, treatment with ertugliflozin 5 and 15 mg over 26 weeks across three placebo-controlled trials with different background therapies resulted in clinically meaningful reductions in HbA1c, body weight and SBP relative to placebo, with more patients achieving metabolic goals. Efficacy was generally consistent across patient subgroups. Ertugliflozin was generally safe and well tolerated, with a similar safety profile to that of placebo, except for a higher incidence of genital mycotic infections and AEs related to osmotic diuresis.
Supplemental Material
453_Supplementary_Fig1 – Supplemental material for Efficacy of ertugliflozin in monotherapy or combination therapy in patients with type 2 diabetes: A pooled analysis of placebo-controlled studies
Supplemental material, 453_Supplementary_Fig1 for Efficacy of ertugliflozin in monotherapy or combination therapy in patients with type 2 diabetes: A pooled analysis of placebo-controlled studies by Jie Liu, Lisa Tarasenko, Steven G Terra, Susan Huyck, Larry Wu, Annpey Pong, Roberto A Calle, Silvina Gallo, Amanda Darekar and James P Mancuso in Diabetes & Vascular Disease Research
Footnotes
Acknowledgements
The authors would like to thank the patients, their families and all investigators involved in the studies. The results from this analysis were presented in part at the American College of Cardiology 67th Annual Scientific Session & Expo, at the 100th Annual Meeting of the Endocrine Society and at the 54th Annual Meeting of the European Association for the Study of Diabetes.
Medical writing support, including assisting authors with the development of the initial draft and incorporation of comments, was provided by Mary Greenacre, PhD and Camille Bonomelli, PhD and editorial support, including figure preparation, formatting, proofreading and submission, was provided by Annabel Ola, MSc, all of Scion, London, UK. This assistance was supported by Merck Sharp & Dohme Corp., a subsidiary of Merck & Co, Inc., Kenilworth, NJ, USA. Edward O’Neill, PhD (Merck Sharp & Dohme Corp., a subsidiary of Merck & Co, Inc., Kenilworth, NJ, USA) provided additional editing.
The Sponsor was involved in the study design, collection, analysis and interpretation of data, as well as data checking of information provided in the manuscript
Author Contributions
J.L. contributed to the acquisition of the data. J.L., J.P.M. and S.G.T. contributed to the conception and design of the study. J.L., L.T., S.G.T., S.H., L.W., A.P., R.A.C., S.G., A.D. and J.P.M contributed to the analysis and/or interpretation of data.
All authors drafted the article or revised it critically for important intellectual content and provided final approval of the published version.
Data sharing statement
Merck Sharp & Dohme Corp., a subsidiary of Merck & Co., Inc., Kenilworth, NJ, USA (MSD), is committed to providing qualified scientific researchers access to anonymized patient-level data and clinical study reports from the company’s clinical trials for the purpose of conducting legitimate scientific research. The company is also obligated to protect the rights and privacy of trial participants and, as such, has a procedure in place for evaluating and fulfilling requests for sharing company clinical trial data with qualified external scientific researchers. The process includes submission of data requests to the MSD data sharing website (available at: ![]() ). Data will be made available for request after product approval in the United States and EU or after product development is discontinued. There are circumstances that may prevent MSD from sharing the requested data.
). Data will be made available for request after product approval in the United States and EU or after product development is discontinued. There are circumstances that may prevent MSD from sharing the requested data.
Declaration of conflicting interests
J.L., S.H., L.W. and A.P. are employees of Merck Sharp & Dohme Corp., a subsidiary of Merck & Co., Inc., Kenilworth, NJ, USA, who may own stock in the Company. L.T., S.G.T., R.A.C., S.G., A.D. and J.P.M. are employees and shareholders of Pfizer Inc.
Funding
The author(s) disclosed receipt of the following financial support for the research, authorship, and/or publication of this article: Merck Sharp & Dohme Corp., a subsidiary of Merck & Co., Inc., Kenilworth, NJ, USA, in collaboration with Pfizer Inc. financially supported this study.
Supplemental material
Supplemental material for this article is available online.
References
Supplementary Material
Please find the following supplemental material available below.
For Open Access articles published under a Creative Commons License, all supplemental material carries the same license as the article it is associated with.
For non-Open Access articles published, all supplemental material carries a non-exclusive license, and permission requests for re-use of supplemental material or any part of supplemental material shall be sent directly to the copyright owner as specified in the copyright notice associated with the article.