
Abstract
Aim:
The aim of this study was to gain insight into the pathophysiological significance of elevated plasma glucose concentrations (mmol/L) 60 min post oral glucose load in apparently healthy individuals.
Methods:
Comparison of resistance to insulin action and associated cardio-metabolic risk factors in 490 apparently healthy persons, subdivided into those with a plasma glucose concentration 60 min following a 75-g oral glucose challenge of <8.6 versus ⩾8.6.
Results:
Insulin resistance was significantly greater in persons with normal glucose tolerance whose 60-min glucose concentration was ⩾8.6, associated with higher blood pressure, plasma concentrations of glucose, insulin, triglyceride and lower high-density lipoprotein cholesterol concentrations. Similar differences were seen in persons with impaired fasting glucose, but not in those with impaired glucose tolerance or both impaired fasting glucose and impaired glucose tolerance. The group whose 60-min glucose was <8.6 (n = 318) contained primarily persons with normal glucose tolerance (88%), whereas the majority of those whose 60-min value was ⩾8.6 (n = 172) had prediabetes (59%) and in particular combined impaired fasting glucose and impaired glucose tolerance.
Conclusion:
Plasma glucose concentration of ⩾8.6 mmol/L 60 min post oral glucose identifies higher proportions of combined impaired fasting glucose and impaired glucose tolerance individuals as well as normal glucose tolerance and impaired fasting glucose individuals with a more adverse cardio-metabolic profile, contributing to observed increased overall risk of type 2 diabetes and other metabolic diseases.
Introduction
Several recent reports1–13 have emphasized the ability of an elevated plasma glucose concentration 60 min after an oral glucose challenge to identify apparently healthy persons at enhanced risk of type 2 diabetes (T2DM) and cardiovascular disease (CVD). A plasma glucose concentration of ⩾8.6 mmol/L, 60 min after a 75-g oral glucose load, has been used in several of these studies to identify the high risk group,1–7 and the utility of this specific cut-point evaluated in experimental populations consisting entirely of individuals with normal glucose tolerance (NGT), as well as in populations expanded to include recognized categories of prediabetes (PreDM). However, analysis has largely centred around the usefulness of this cut-point in the NGT population1,3,8,10–12 or in the population as a whole,5–7 without considering how 60-min post-load plasma glucose levels might interact with the traditional glycaemic categories of NGT, impaired fasting glucose (IFG), impaired glucose tolerance (IGT) and IFG-IGT. This analysis was initiated to explore three specific issues concerning the relationship between a plasma glucose cut-point concentration of 8.6 mmol/L 60 min after glucose load and identification of increased cardio-metabolic risk. The first goal was to compare the ability of a 60-min plasma glucose concentration of ⩾8.6 mmol/L to identify enhanced cardio-metabolic risk in experimental groups limited to subjects with NGT versus an expanded group containing individuals with either NGT or PreDM. Second, the cardio-metabolic risk profiles of individuals whose 60-min plasma glucose concentration was ⩾8.6 mmol/L were compared as a function of conventional glycaemic categories. 14 The third goal was to consider the pathophysiological implications of subdividing individuals who do not have diabetes into those above and below a plasma glucose concentration of 8.6 mmol/L, 60 min after a 75-g oral glucose challenge.
Methods
This study is based on the analysis of data collected in 490 individuals who had volunteered for studies of the role of insulin resistance in human disease approved by the Institutional Review Board at Stanford University. All study participants provided informed consent. Individuals considered for inclusion were non-Hispanic White (86%), Asian (11%), Hispanic (2%) and non-Hispanic Black (1%); without diabetes; not taking glycaemic or cardiovascular medications; and in good general health with no history of coronary artery, kidney or liver disease. All had completed the following measurements: body mass index (BMI), blood pressure, fasting plasma lipid and lipoprotein concentrations (Stanford Clinical Laboratory), an oral glucose tolerance test (OGTT) and an insulin suppression test (IST) to quantify insulin-mediated glucose disposal.
All metabolic testing was performed in the General Clinical Research Center of Stanford Medical Center after an overnight fast of 12 h. During the OGTT, blood was obtained for measurement of plasma glucose and insulin concentrations before (fasting) and 30, 60, 120 and 180 min after oral ingestion of 75 g of glucose. Individuals were classified (10) as having NGT (fasting glucose < 5.6 mmol/L, 2 h glucose < 7.8 mmol/L), IFG (fasting glucose = 5.6–7.0 mmol/L, 2 h glucose < 7.8mmol/L), IGT (fasting glucose < 5.6 mmol/L, 2 h glucose = 7.8–11.1 mmol/L) and IFG-IGT (fasting glucose = 5.6–7.0, 2 h glucose = 7.8–11.1 mmol/L). Insulin resistance was directly measured with the modified version of the IST, 15 initially introduced and validated by our research group. 16 The values for insulin-mediated glucose disposal obtained with this approach are highly correlated (r > 0.9) with the euglycaemic clamp technique. 17 Briefly, after an overnight fast, an intravenous catheter is placed in each of the subject’s arms: one arm used for the administration of a 180-min infusion of octreotide (0.27 mcg/m2/min), insulin (32 mU/m2/min) and glucose (267 mg/m2/min) and the other arm for collecting blood samples. Blood is drawn at 10-min intervals from 150 to 180 min of the infusion to determine the steady-state plasma glucose (SSPG) and steady-state plasma insulin (SSPI) concentrations. Because SSPI concentrations are similar in all subjects, the SSPG concentration provides a direct measure of the ability of insulin to mediate disposal of an infused glucose load; therefore, the higher the SSPG concentration, the more insulin resistant the individual.
The results obtained from subjects were divided into two groups based on whether their 60-min plasma glucose concentration was ⩾8.6 mmol/L. Comparisons of various markers of insulin resistance and cardio-metabolic risk factors were made between these two groups using independent samples t-tests. These analyses were first performed on a subset of subjects who had NGT and subsequently repeated on an expanded population of subjects who had both NGT and PreDM as traditionally defined by their fasting and 2 h plasma glucose concentrations. To further delineate these differences, analyses were conducted on the population of subjects with 60-min plasma glucose concentration of ⩾8.6 mmol/L. Subjects were split into categories of NGT, IFG, IGT and IFG-IGT. Means for markers of insulin resistance and cardio-metabolic risk were compared by one-way analysis of variance (ANOVA) with post hoc pair-wise comparisons using Fisher’s least significant difference test. All statistical tests with p < 0.05 were considered statistically significant. A natural log transformation was performed on fasting insulin and triglyceride levels before these values were compared by t-tests or one-way ANOVA. Summary statistics are reported as proportion of subjects, mean ± SD or geometric mean (95% confidence interval). All analyses were performed using the SPSS statistical software (version 24; IBM, USA).
Results
The study population consisted of 490 apparently healthy volunteers: 352 (72%) persons with NGT and 138 (28%) with PreDM, subdivided into IFG (n = 67; 49%), IGT (n = 38; 28%) and IFG-IGT (n = 33; 24%).
Table 1 compares the demographic characteristics and cardio-metabolic risk factors in persons with NGT, divided on the basis of a 60-min plasma glucose concentration of 8.6 mmol/L after a 75-g oral glucose challenge. There were 71 individuals (20%) with a 60-min plasma glucose concentration of ⩾8.6 mmol/L, and they were significantly more insulin resistant (higher SSPG concentration), with higher plasma glucose and triglyceride concentrations, and blood pressures than the remainder of the NGT group. However, total and both low- and high-density cholesterol concentrations did not differ significantly between the two groups.
Cardio-metabolic risk profiles in individuals with normal glucose tolerance (n = 352).
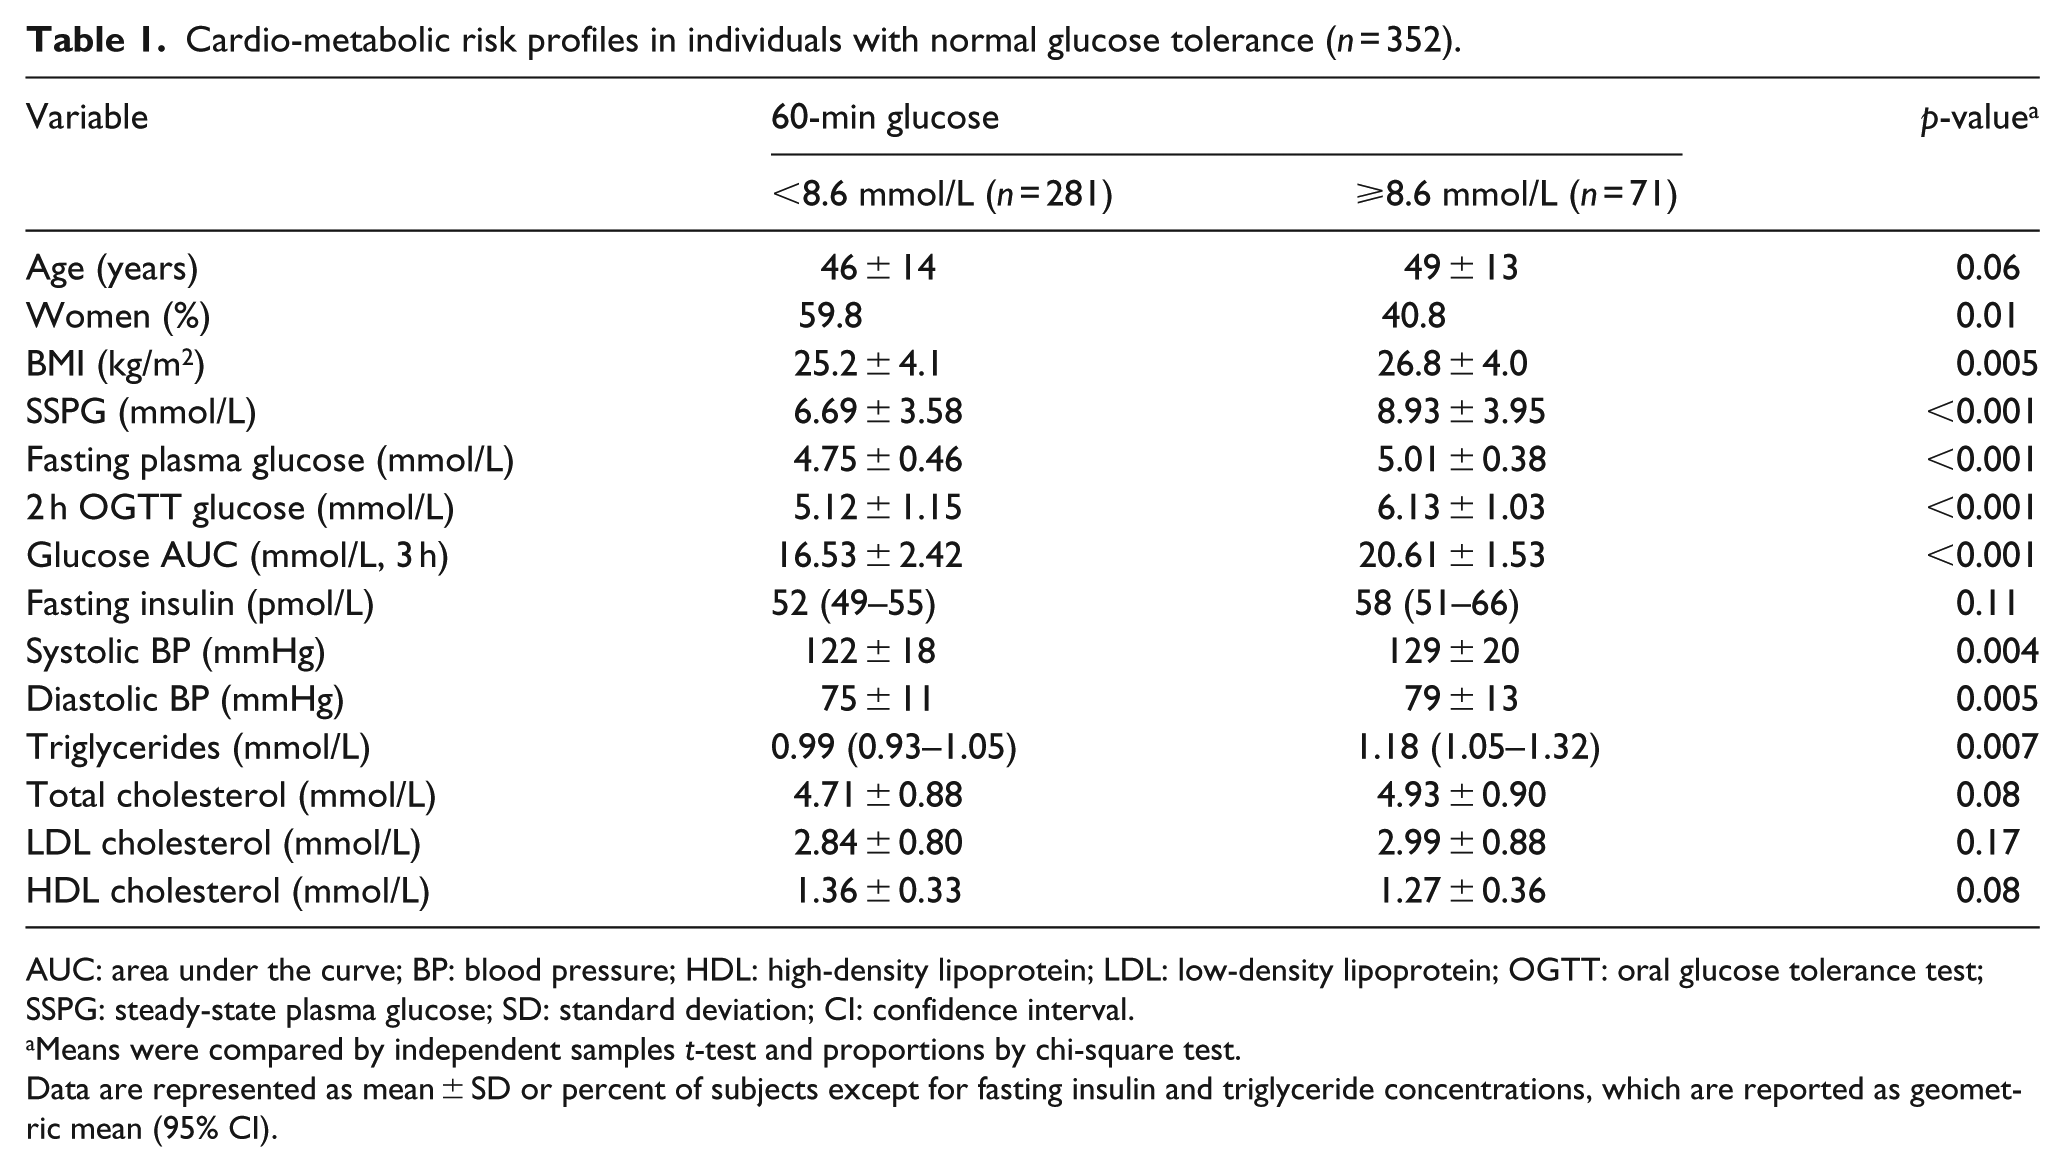
AUC: area under the curve; BP: blood pressure; HDL: high-density lipoprotein; LDL: low-density lipoprotein; OGTT: oral glucose tolerance test; SSPG: steady-state plasma glucose; SD: standard deviation; CI: confidence interval.
Means were compared by independent samples t-test and proportions by chi-square test.
Data are represented as mean ± SD or percent of subjects except for fasting insulin and triglyceride concentrations, which are reported as geometric mean (95% CI).
The comparisons in Table 2 are similar to those in Table 1, but include the entire population – NGT and PreDM. There were 172 (35%) individuals in this expanded population whose 60-min plasma glucose concentration was ⩾8.6 mmol/L. As before, the cardio-metabolic risk profile was more adverse in this subset of the population, but the differences between the two groups were substantially accentuated when persons with PreDM were included; with significantly more adverse values (p < 0.001) for every variable measured in those with a 60-min glucose concentration of ⩾8.6 mmol/L.
Cardio-metabolic risk profile in individuals with normal glucose tolerance or prediabetes (n = 490).
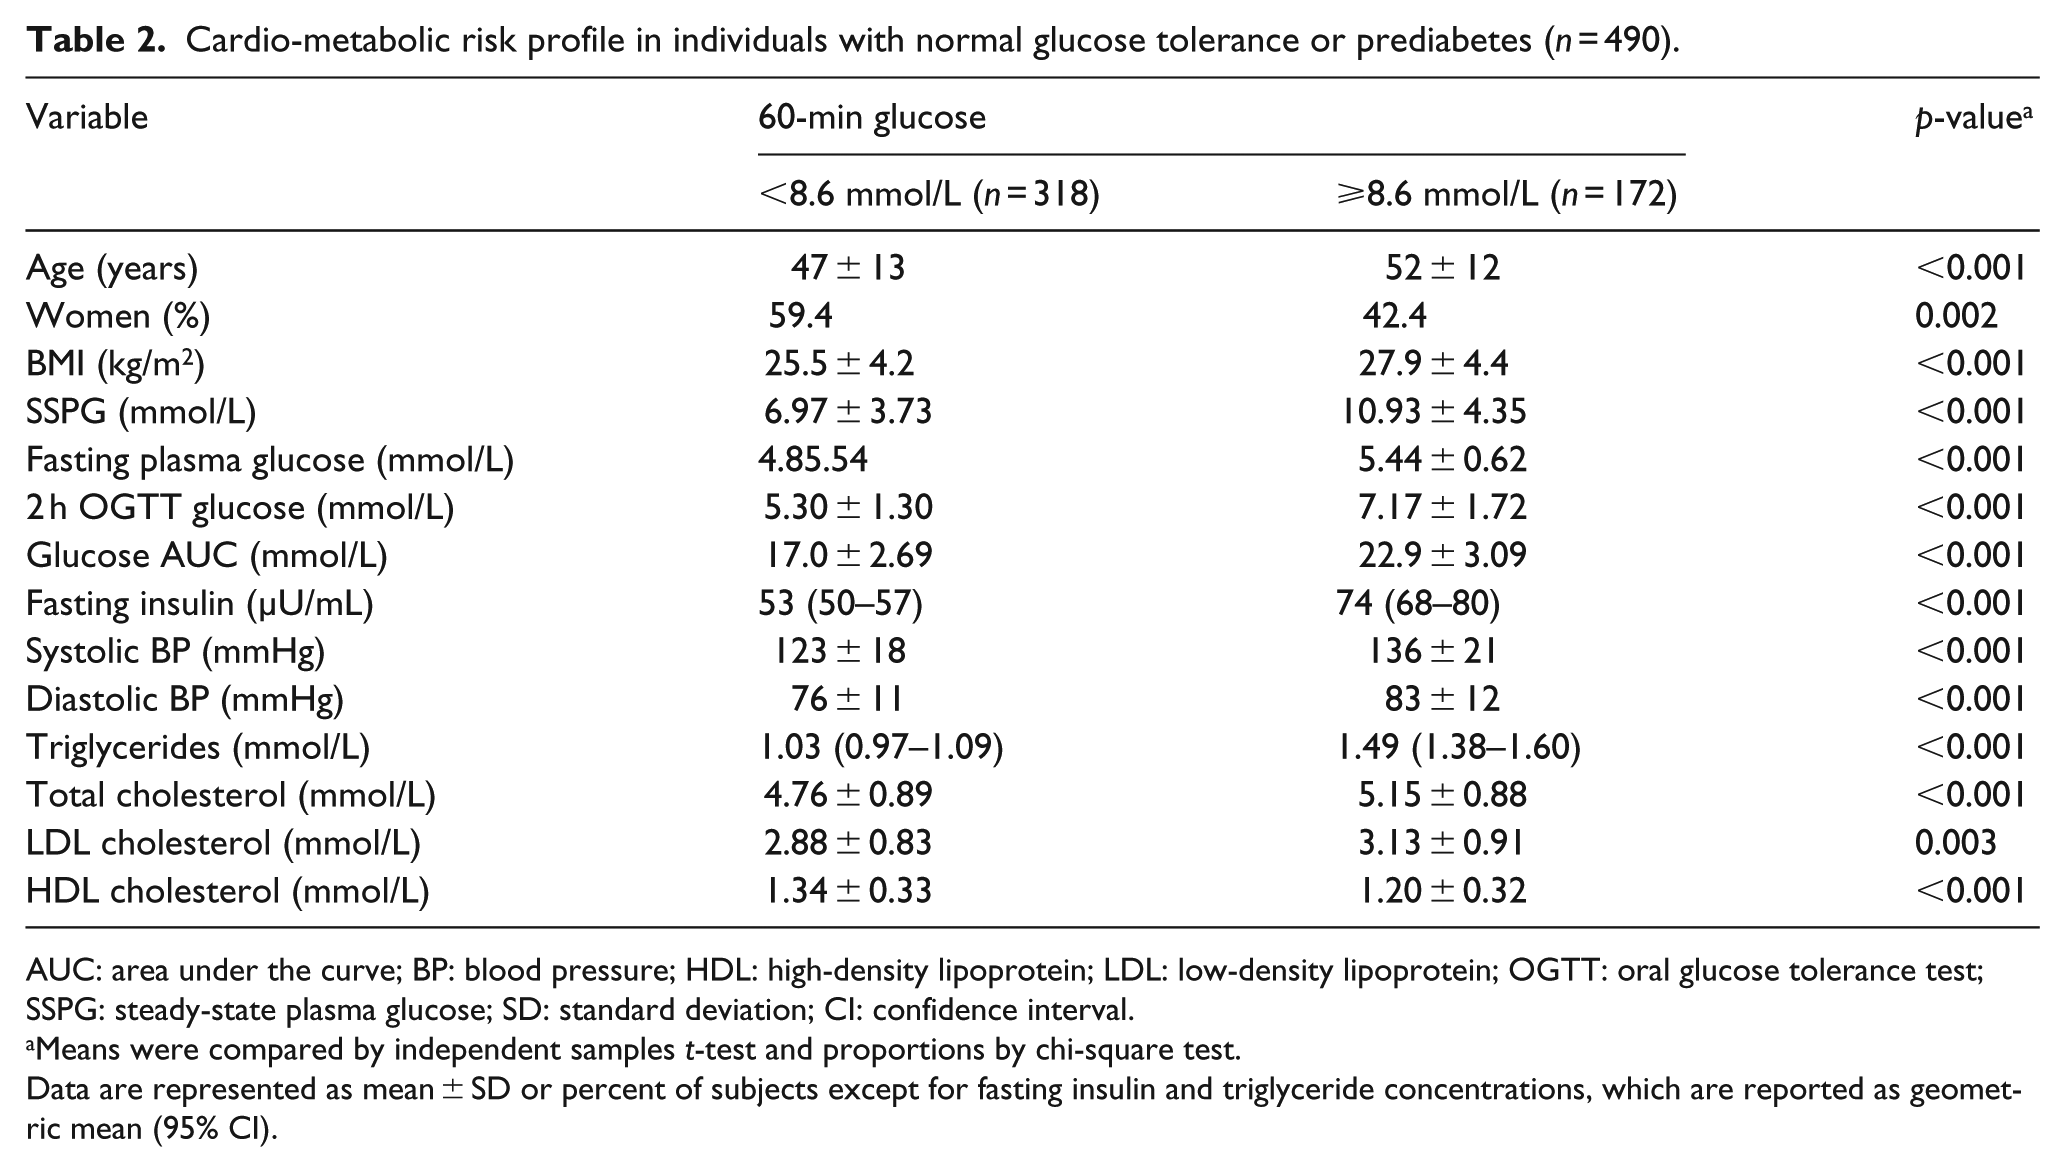
AUC: area under the curve; BP: blood pressure; HDL: high-density lipoprotein; LDL: low-density lipoprotein; OGTT: oral glucose tolerance test; SSPG: steady-state plasma glucose; SD: standard deviation; CI: confidence interval.
Means were compared by independent samples t-test and proportions by chi-square test.
Data are represented as mean ± SD or percent of subjects except for fasting insulin and triglyceride concentrations, which are reported as geometric mean (95% CI).
Table 3 compares the cardio-metabolic risk profiles of 172 persons, separated on the basis of glycaemic category, 14 who are at enhanced risk because their plasma glucose concentration 60 min after the glucose load was ⩾8.6 mmol/L. These results emphasize the cardio-metabolic risk factor heterogeneity of the four groups thus formed. With the exception of measurements of low- and high-density lipoprotein cholesterol, there are significant differences between the four groups in all variables measured. Without discussing each individual comparison, the three groups of persons with PreDM had a more adverse cardio-metabolic risk profile than the subset with NGT. It is also apparent that those individuals whose 60-min plasma glucose concentration was ⩾8.6 mmol/L and were classified as IFG-IG had the most adverse cardio-metabolic risk profile. For example, they were more insulin resistant than any other group, associated with higher plasma glucose and insulin concentrations.
Cardio-metabolic risk profiles in individuals with 60-min glucose value ⩾8.6 mmol/L as a function of glycaemic category (n = 172).
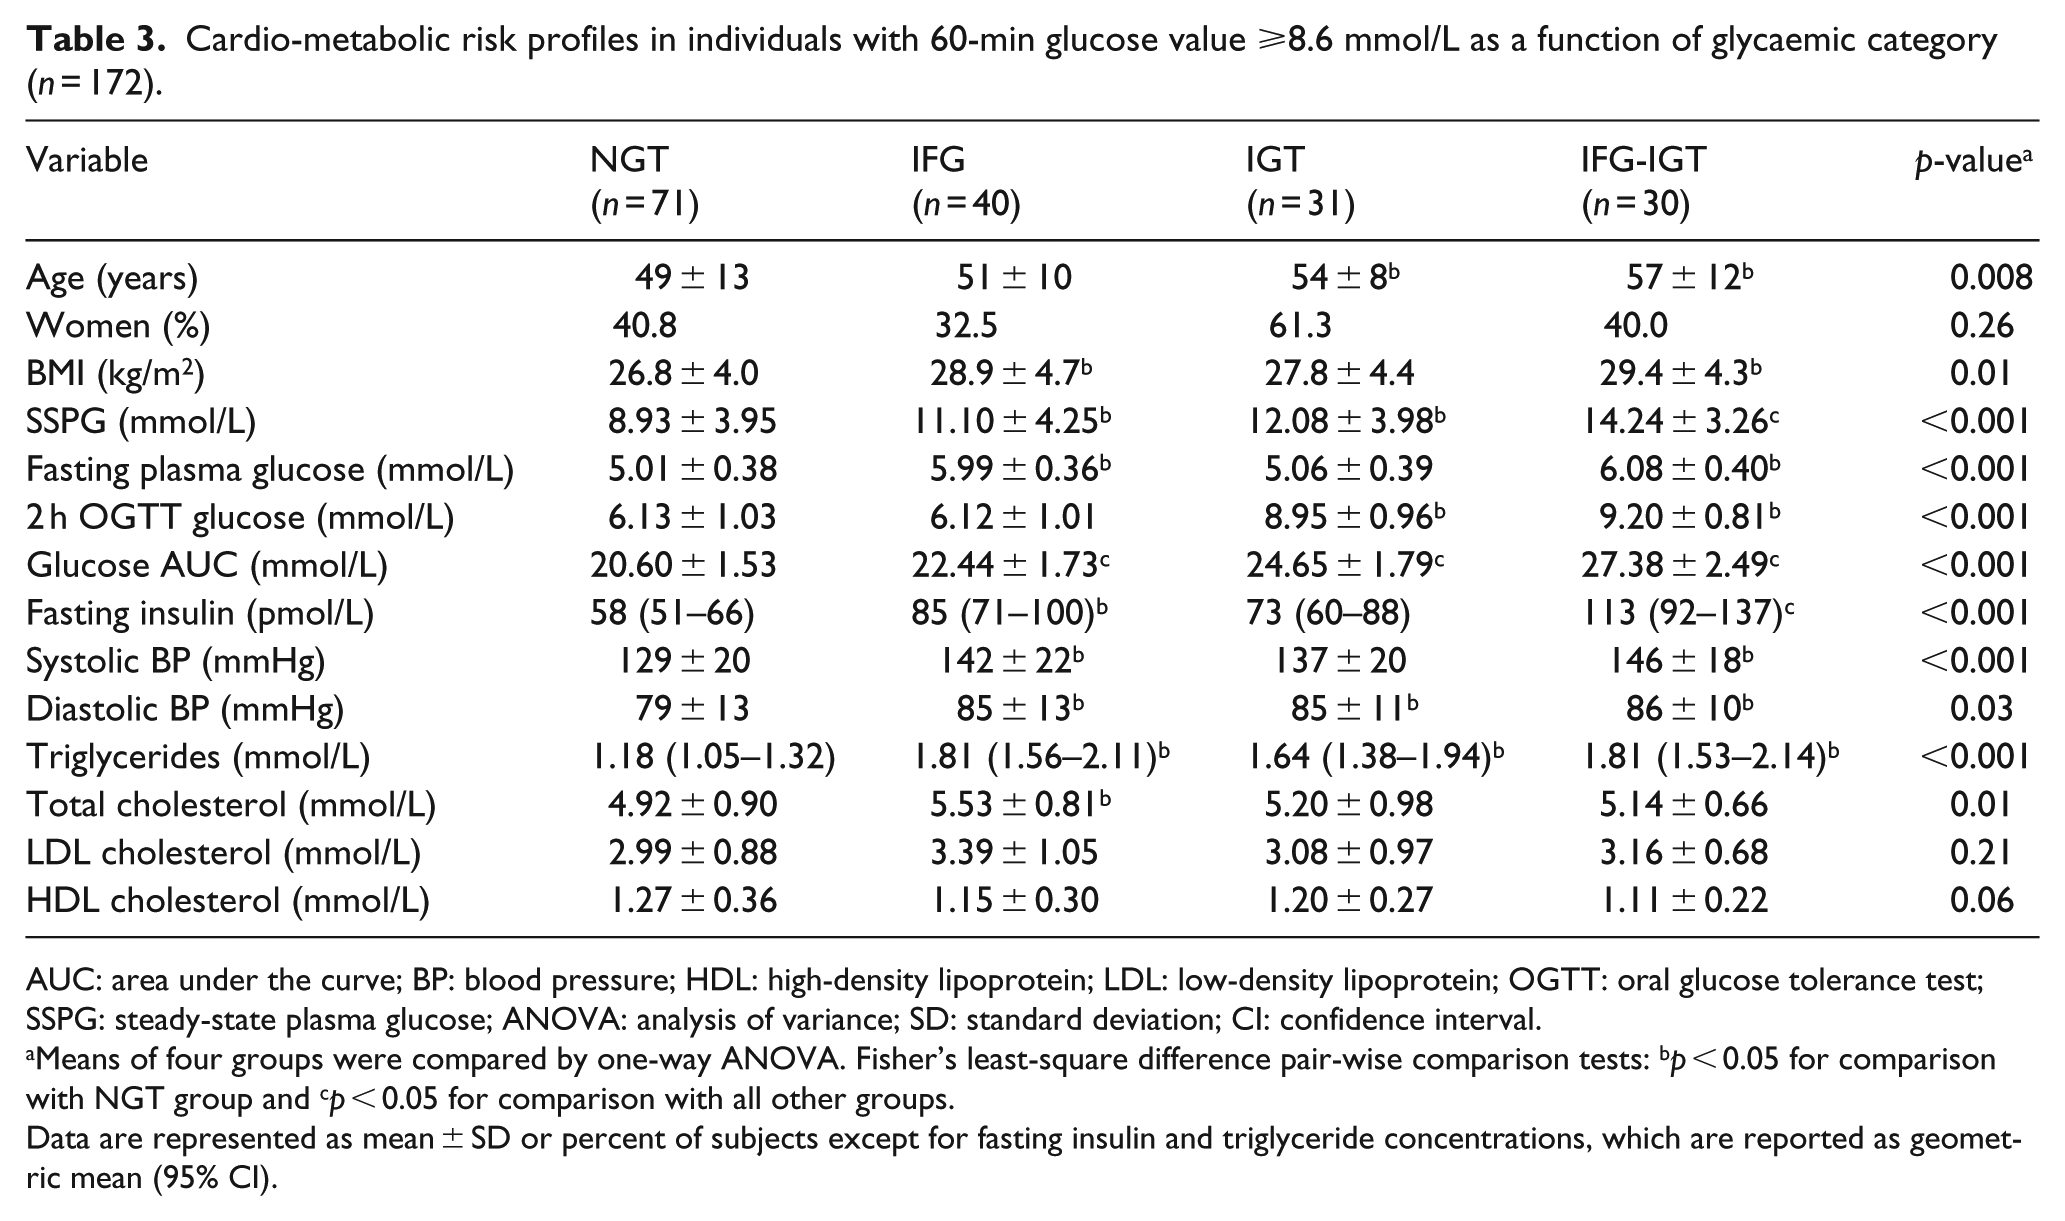
AUC: area under the curve; BP: blood pressure; HDL: high-density lipoprotein; LDL: low-density lipoprotein; OGTT: oral glucose tolerance test; SSPG: steady-state plasma glucose; ANOVA: analysis of variance; SD: standard deviation; CI: confidence interval.
Means of four groups were compared by one-way ANOVA. Fisher’s least-square difference pair-wise comparison tests: bp < 0.05 for comparison with NGT group and cp < 0.05 for comparison with all other groups.
Data are represented as mean ± SD or percent of subjects except for fasting insulin and triglyceride concentrations, which are reported as geometric mean (95% CI).
Table 4 illustrates the distribution of each glycaemic category within the group of those with a 60-min plasma glucose concentration of <8.6 mmol/L versus ⩾8.6 mmol/L. There were 318 individuals with a 60-min plasma glucose concentration of <8.6 mmol/L, representing 65% of the total population (318 of 490) of apparently healthy individuals identified as being at relatively ‘low’ cardio-metabolic risk (Table 1). It can be seen that the vast majority of individuals (88%) in this group had NGT, with the three categories of PreDM accounting for the other 12%.
Distribution of glycaemic category in subjects with a 60-min plasma glucose concentration of <8.6 mmol/L versus ⩾8.6 mmol/L.
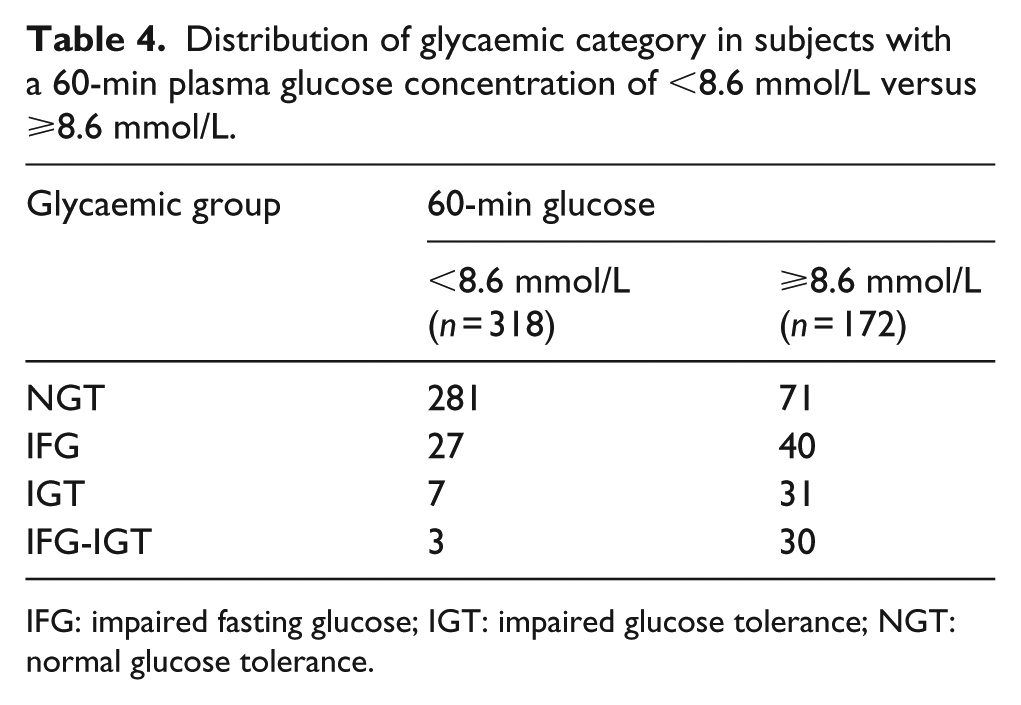
IFG: impaired fasting glucose; IGT: impaired glucose tolerance; NGT: normal glucose tolerance.
However, the number of individuals with PreDM in the 172 individuals with a 60-min glucose value ⩾8.6 mmol/L increased substantially (Table 4). Thus, their proportion identified as being at enhanced cardio-metabolic risk increased approximately fivefold as seen in Figure 1 (12%–59%), associated with the opposite trend in persons with NGT (decreasing from 88% of those with a 60-min plasma glucose value <8.6 mmol/L to 41% of individuals with a 60-min glucose value ⩾8.6 mmol/L).
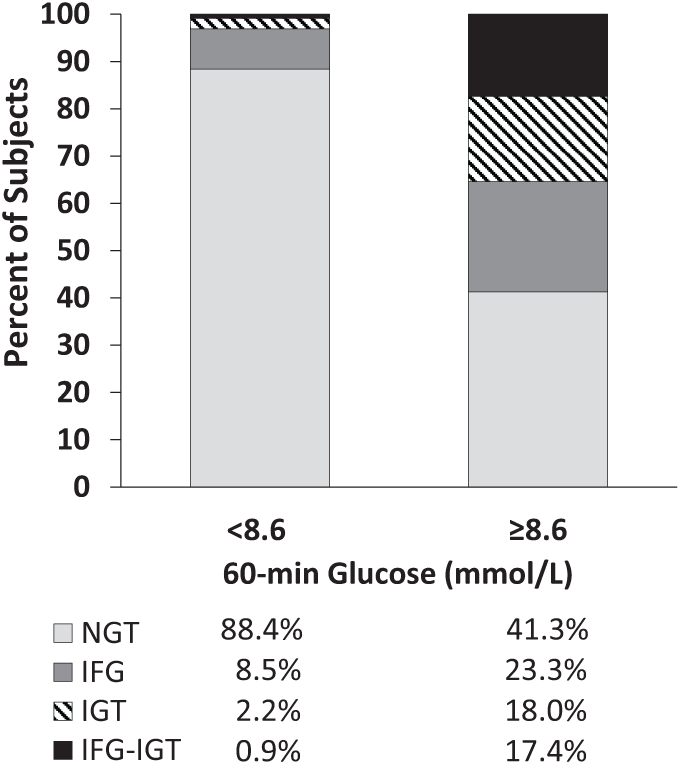
Distribution of normal glucose tolerance and three categories of prediabetes in subjects with 60-min plasma glucose concentration of <8.6 mmol/L versus ⩾8.6 mmol/L.
Table 5 extends the analysis of Table 1 by applying the same comparisons between individuals with <8.6 mmol/L or ⩾8.6 mmol/L 60 min post load plasma glucose concentrations to subgroups of IFG, IGT and IFG-IGT. There were significant differences in insulin resistance (in the form of higher SSPG), fasting plasma glucose and triglyceride concentrations as well as blood pressure in high- versus low post-load plasma glucose individuals within the IFG subgroup. However, these differences did not persist when the IGT and IFG-IGT subgroups were similarly analysed.
Cardio-metabolic risk profiles comparing individuals with 60-min glucose value <8.6 mmol/L versus ⩾8.6 mmol/L in IFG, IGT and IFG-IGT categories.
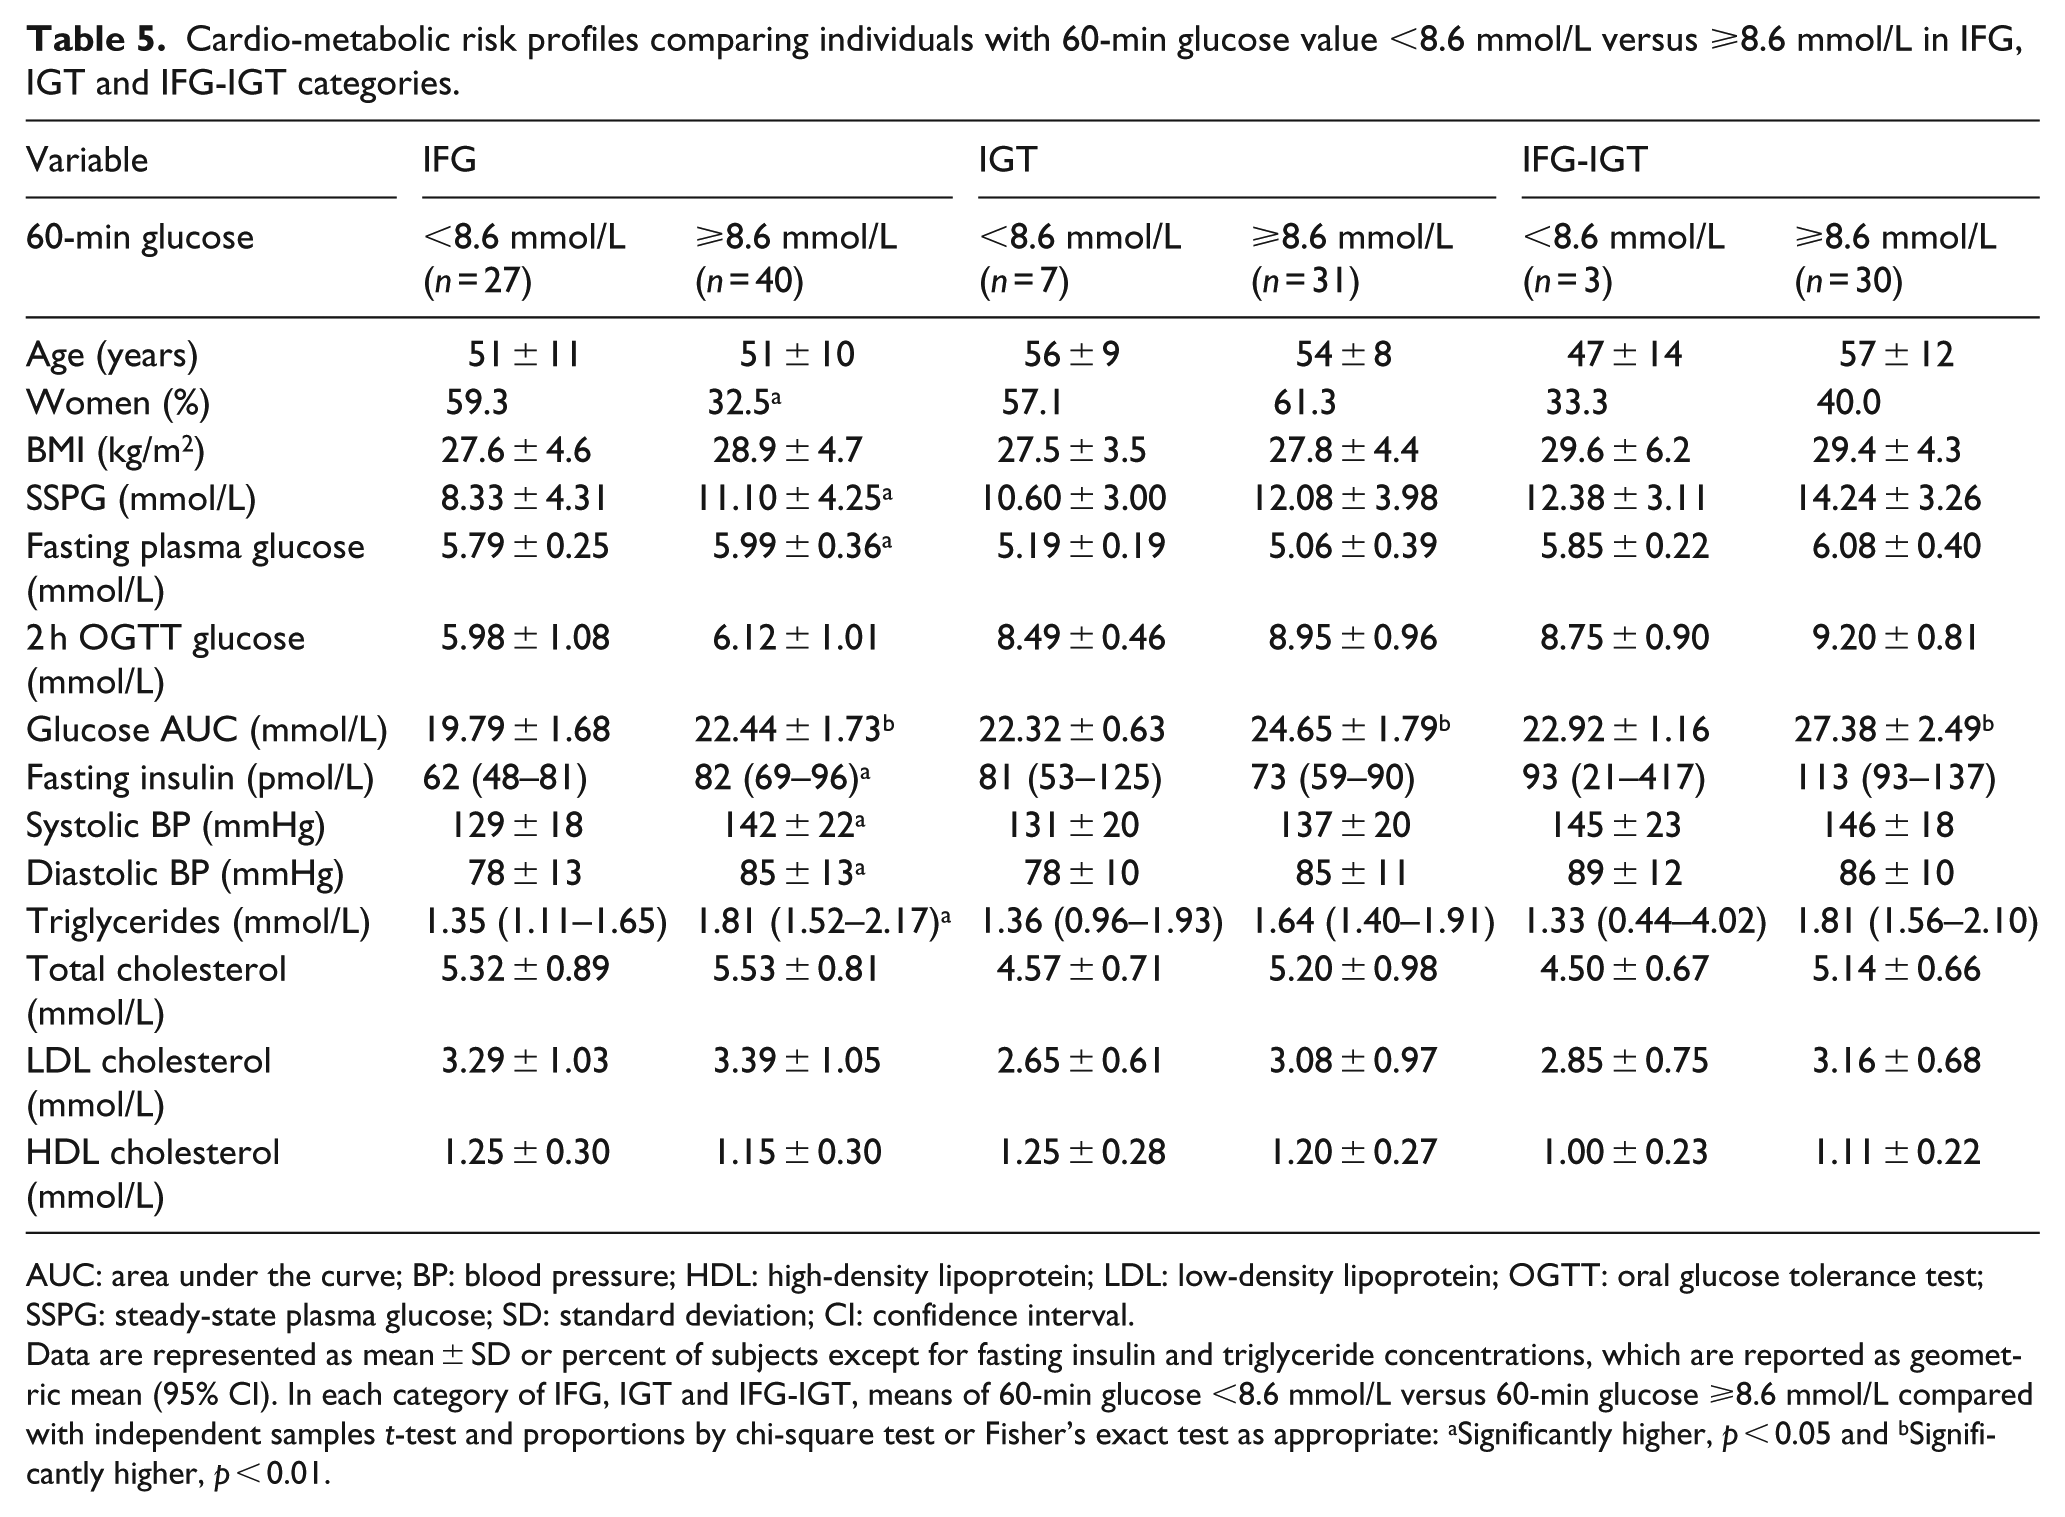
AUC: area under the curve; BP: blood pressure; HDL: high-density lipoprotein; LDL: low-density lipoprotein; OGTT: oral glucose tolerance test; SSPG: steady-state plasma glucose; SD: standard deviation; CI: confidence interval.
Data are represented as mean ± SD or percent of subjects except for fasting insulin and triglyceride concentrations, which are reported as geometric mean (95% CI). In each category of IFG, IGT and IFG-IGT, means of 60-min glucose <8.6 mmol/L versus 60-min glucose ⩾8.6 mmol/L compared with independent samples t-test and proportions by chi-square test or Fisher’s exact test as appropriate: aSignificantly higher, p < 0.05 and bSignificantly higher, p < 0.01.
Discussion
The current analysis was undertaken to address three issues of increasing complexity concerning the pathophysiological implications of using a plasma glucose concentration of ⩾8.6 mmol/L 60 min after a 75-g oral glucose challenge to identify a group of apparently healthy individuals at increased cardio-metabolic risk. At the simplest level, the results (Tables 1 and 2) demonstrated that cardio-metabolic risk factor profiles were significantly more adverse in the subset of participants whose plasma glucose concentration was ⩾8.6 mmol/L 60 min post glucose challenge, irrespective of whether the experimental population was limited to those with NGT or included individuals with PreDM. However, the magnitude of the differences in cardio-metabolic risk factors between those above and below a plasma glucose concentration of 8.6 mmol/L was accentuated when the analysis was expanded to include persons with PreDM (Table 2 vs. Table 1).
However, the picture is not entirely straightforward. The apparently healthy individuals identified using a cut-point of plasma glucose concentration of ⩾8.6 mmol/L 60 min post glucose load are clearly heterogeneous with regard to their cardio-metabolic risk; persons with combined IFG-IGT have a significantly more adverse risk profile than those with NGT, with the risk factor profiles of the IFG and IGT subgroups being intermediate between these two extremes.
The third goal of this analysis was to increase insight into the pathophysiological implications of grouping apparently healthy individuals at enhanced cardio-metabolic risk on the basis of a plasma glucose concentration of ⩾8.6 mmol/L, 60 min after a 75-g oral glucose challenge. When applied to an apparently normal population, does a cut-point plasma glucose concentration of ⩾8.6 mmol/L define a relatively homogeneous pathophysiological group of individuals, or should it be viewed as simply a useful clinical approach to identify a heterogeneous group of persons who are at increased cardio-metabolic risk? The results of the analysis seem to suggest that the latter alternative is most likely and provide an explanation of why the cut-point has clinical utility. This ability of a 60-min plasma glucose concentration cut-point of 8.6 mmol/L to separate high-risk from low-risk persons is largely the consequence of two findings: (1) Table 4 and Figure 1 show that persons with PreDM make up a minority of those whose 60-min plasma glucose is <8.6 mmol/L (12%) and the majority of those with a value ⩾8.6 mmol/L (59%) and (2) the cardio-metabolic risk factor profile is significantly more adverse in those with PreDM (Table 3). Thus, the ability of the 8.6 mmol/L cut-point to separate high- from low-risk status in apparently healthy individuals is a reflection of differences in the prevalence and adversity of the cardio-metabolic profiles of the four glycaemic categories above and below that value.
One might argue that an additional clinical advantage of the 60-min OGTT glucose exists in further stratifying high-risk individuals even when applied as a filter with in traditional glycaemic categories. 2 However, while this is the case in the NGT population (Table 1), these differences are slightly diminished in the IFG subgroup and all but absent in the IGT and IFG-IGT subgroups (Table 5). The only significant difference between the <8.6 and ⩾8.6 mmol/L subjects in the IGT and IFG-IGT subgroups was the area under the curve for plasma glucose concentrations, which would be logically expected given the differences in 60-min plasma glucose levels. This supports the leading hypothesis that, among individuals with NGT and IFG, elevated 60-min post-load plasma glucose level identifies subjects with a greater degree of insulin resistance and ß-cell dysfunction,6,12,13 mirroring the pathophysiology of progression to T2DM. However, among subjects with IGT and IFG-IGT, those with 60-min post-load plasma glucose concentration of <8.6 mmol/L may already possess an adverse cardio-metabolic risk profile comparable to their counterparts with elevated 60-min post-load plasma glucose concentrations. However, we appreciate the limitation to our study that the number of subjects in the IGT and IFG-IGT subgroups (Table 5) is small, thus limiting the strength of the conclusion that we can draw. We hope that future studies with larger sample sizes can determine whether the 60-min glucose provides an additional benefit in risk-stratification of individuals in these categories of PreDM.
Finally, it seems important to acknowledge that the ‘best’ cut-point to separate levels of cardio-metabolic risk 60 min after an oral glucose challenge may not be 8.6 mmol/L, but will vary as a function of the prevalence of individuals in the population above and below any given 60-mim plasma glucose value and the adversity of their cardio-metabolic risk. Furthermore, it is possible that ethnic/racial differences might impact the ‘best’ cut-point of plasma glucose concentration 60 min after a 75-g oral challenge. The use of a 60-min plasma glucose concentration of ⩾8.6 mmol/L was initially derived from a mixed population of Mexican Americans and non-Hispanic Whites3,4 and has been successfully applied to several other populations of European ancestry.5–7 However, the 60-min post-glucose load concentration cut-point that best predicted the risk of T2DM and CVD was somewhat different in studies of Japanese (9.8 mmol/L), South Koreans (8.0 mmol/L) and Native Americans (9.3 mmol/L), respectively.8,11
In conclusion, it has been shown that a plasma glucose concentration of ⩾8.6 mmol/L 60 min after a 75-g oral glucose challenge identifies apparently healthy individuals at increased risk to develop T2DM and/or CVD.1–7,10–13 The results of the current analysis are consistent with these reports in demonstrating that the cardio-metabolic risk profiles are significantly more adverse in apparently healthy individuals of mostly European ancestry (86%) with a plasma glucose concentration of ⩾8.6 mmol/L following a 75-g oral glucose load. Our analysis has shown that the 1-h oral glucose tolerance test is perhaps most useful only when applied to stratifying cardio-metabolic risk profiles of NGT and IFG sub-populations. Nevertheless, it may still hold significant clinical utility when applied to a general population as it provides a relatively simple and straightforward approach to identify a subset of apparently healthy individuals at increased risk of T2DM and CVD,1–13 presumably by identifying a greater proportion of IGT and IFG-IGT individuals as well as identifying NGT and IFG individuals with a more adverse cardio-metabolic risk profile.
Footnotes
Acknowledgements
This manuscript was written by Professor Gerald Reaven in July 2017 and is one of the last papers he worked on. Sadly, Professor Reaven passed away on 12 February 2018.
Declaration of conflicting interests
The author(s) declared no potential conflicts of interest with respect to the research, authorship and/or publication of this article.
Funding
The author(s) received financial support for the research,authorship and/or publication of this article: This work was in part supported by the Clinical and Translational Science Award UL1RR025744, National Institutes of Health/National Center for Research Resources, Bethesda, MD, USA.