
Abstract
Type 2 diabetes mellitus is associated with an elevated risk of cardiovascular disease, but the mechanism through which diabetes contributes to cardiovascular disease development remains incompletely understood. In this study, we compared the association of circulating regulatory T cells, naïve T cells, effector memory T cells or central memory T cells with cardiovascular disease in patients with and without type 2 diabetes mellitus. Percentage of circulating T cell subsets was analysed by flow cytometry in type 2 diabetes mellitus subjects with and without prevalent cardiovascular disease as well as in non-diabetic subjects with and without prevalent cardiovascular disease from the Malmö SUMMIT cohort. Subjects with type 2 diabetes mellitus had elevated percentages of effector memory T cells (CD4+CD45RO+CD62L–; 21.8% ± 11.2% vs 17.0% ± 9.2% in non-type 2 diabetes mellitus, p < 0.01) and central memory T cells (CD4+CD45RO+CD62L+; 38.0% ± 10.7% vs 36.0% ± 9.5% in non-type 2 diabetes mellitus, p < 0.01). In contrast, the frequency of naïve T cells was reduced (CD4+CD45RO–CD62L+, 35.0% ± 16.5% vs 42.9% ± 14.4% in non-type 2 diabetes mellitus, p < 0.001). The proportion of effector memory T cells was increased in type 2 diabetes mellitus subjects with cardiovascular disease as compared to those without (26.4% ± 11.5% vs 18.4% ± 10.2%, p < 0.05), while no difference in regulatory T cells was observed between these two patient groups. This study identifies effector memory T cells as a potential cellular biomarker for cardiovascular disease among subjects with type 2 diabetes mellitus, suggesting a state of exacerbated immune activation in type 2 diabetes mellitus patients with cardiovascular disease.
Introduction
Patients with type 2 diabetes mellitus (T2DM) are at an elevated risk of both micro- and macrovascular complications and display a two- to three-fold increased risk for developing a cardiovascular event.1,2 The underlying mechanisms remain to be fully understood, but an atherogenic lipoprotein profile, endothelial and platelet dysfunction, as well as impaired fibrous repair have been proposed as potential explanations.3,4 Moreover, T2DM has been linked to chronic low-grade inflammation primarily as assessed by elevated C-reactive protein levels. 5 Atherosclerosis is considered an inflammatory disease and plaques from T2DM subjects contain more inflammatory cells.6,7 Given that atherosclerosis, the primary underlying cause of cardiovascular disease (CVD), and T2DM are both characterized by an inflammatory component, it is possible that the increased cardiovascular risk in T2DM patients could be explained by immune-related mechanisms. Although there is clinical and experimental support for this notion, the contribution of the immune system to the increased cardiovascular risk in diabetic subjects remains incompletely understood. Here, we have measured effector and memory, as well as regulatory, T helper cells as markers of long-term activation of adaptive immune responses in T2DM patients with and without concomitant CVD.
The adaptive immune system has been shown to affect experimental atherosclerosis, and it is hypothesized that autoimmune responses against plaque antigens (e.g. heat-shock proteins and apolipoprotein B100) are of importance.8,9 After activation, CD4 expressing T helper cells undergo differentiation into effector and memory cells.10,11 Several markers have been used to differentiate the different cellular components of T helper memory cells. CD4+CD45RO+CD62L+ central memory T cells (TCM) express markers that promote trafficking through lymphoid organs. 12 TCM produce interleukin (IL)-2 and proliferate extensively upon re-stimulation. CD4+CD45RO+CD62L– T effector memory cells (TEM) do not express CD62L or CCR7 (CD197) and home to non-lymphoid tissue. TEM are less long-lived, produce more cytokines and have a reduced proliferative capacity compared to TCM.10,11 It has been previously reported that levels of TEM were associated with carotid intima-media thickness and with myocardial infarction and chronic stable angina. 13 Naïve T cells (TN) are characterized by surface expression of CD62L and absence of the memory-associated CD45RO isoform. Instead, naïve T cells express the larger CD45RA isoform.
Regulatory T cells (Tregs) are suppressive CD4+ T cells and critical mediators of immune self-tolerance. Tregs are characterized by the expression of CD25, FoxP3 and in humans also by a diminished expression of CD127 compared to other non-regulatory CD4+ T cells.14–17 Tregs can be of thymic origin, that is, natural Tregs (nTregs) or induced in the periphery under tolerogenic conditions (induced Tregs, iTregs). One marker that has been proposed to distinguish nTregs from iTregs is the expression of Helios, an Ikaros family transcription factor. 18 However, the usefulness of Helios in identifying nTregs has recently been criticized.19,20 Accumulating evidence suggests that Tregs are important in regulating the local inflammatory response during atherosclerotic plaque development.21–24 In patients, high levels of circulating Tregs at baseline have been associated with a reduced risk for developing CVD 25 and patients with prevalent acute coronary syndrome display lower levels of Tregs.26–28 However, one report found that Tregs did not correlate with intima-media thickness or CVD status. 29
It has been previously shown that T2DM patients have an imbalance in T effector cells and Tregs,30,31 but the role of different T cell subsets in diabetic macrovascular disease remains to be fully characterized. To investigate if differences in T cells are associated with the increased risk of CVD in T2DM subjects, we analysed circulating Tregs, naïve-, effector- and memory T cell levels in blood from 198 subjects recruited from the Malmö cohort of the SUMMIT (SUrrogate markers for vascular Micro- and Macrovascular hard endpoints for Innovative diabetes Tools) study.
Materials and methods
Study population
The patients included in this study were part of the Malmö cohort of the SUMMIT study. 32 SUMMIT study subjects were recruited into four groups: T2DM with or without CVD, CVD cases without T2DM and healthy controls from existing population cohorts and hospital registers at the University Hospital in Malmö, Sweden, between December 2010 and April 2013. Diabetes was defined based on contemporary or historical evidence of hyperglycaemia [according to World Health Organization (WHO) 1998 criteria; fasting plasma glucose >7.0 mmol/L or 2 h post-load plasma glucose >11.1 mmol/L, or both] or by current medication with insulin, sulphonylureas, metformin or other anti-diabetic drugs. Classification of CVD included non-fatal acute myocardial infarction, hospitalized unstable angina, resuscitated cardiac arrest, any coronary revascularization procedure, non-fatal stroke, transient ischaemic attack confirmed by a specialist, LEAD defined as ankle-brachial pressure index (ABPI) <0.9 with intermittent claudication or prior corrective surgery, angioplasty or above ankle amputation. Data sources of CVD phenotypic status included the Swedish Hospital Discharge Register, the Stroke register of Malmö (STROMA) and the Cause of Death Registry of Sweden. International Statistical Classification of Diseases (ICD) codes used to define major CVD included non-fatal myocardial infarction (ICD-9: 410, ICD-10: I21, I22), non-fatal unstable angina (ICD-9: 411, ICD-10: I20), coronary heart disease (CHD) deaths (ICD-9: 410–414, ICD-10: I20–I25), stroke cases (ICD-9: 433–434, ICD-10: I63–I64). Control individuals without CVD had the following codes excluded: acute CHD/ischaemic heart disease (ICD-9: 410–414, ICD-10: I20–I25), sudden death (ICD-9: 798, ICD-10: R96, R98) and stroke/cerebrovascular disease (ICD-9: 430–438, ICD-10: I60–I69). This study involved subjects with T2DM and clinically manifest CVD (n = 54), subjects with T2DM but without clinical signs of CVD (n = 55), subjects with CVD but no T2DM (n = 45) and subjects without both CVD and T2DM (n = 44) randomly recruited from the Malmö SUMMIT cohort. The study was approved by the Regional Ethics Committee in Lund (ethical permit number 2010/464) and was conducted in accordance with the Helsinki Declaration. All subjects gave written consent.
Anthropometric measurements
The participants had their anthropometric measures recorded and family medical history, drug usage, smoking and physical activity measures obtained from questionnaires or registers. Blood pressure was recorded, and blood samples were analysed for laboratory parameters including HbA1c, total cholesterol, low-density lipoprotein (LDL) and high-density lipoprotein (HDL) cholesterol, triglycerides and fasting glucose according to standard procedures at the Department of Clinical Chemistry, Scania University Hospital.
Blood collection and flow cytometry
Blood (1 mL) was collected in heparin tubes (BD Falcon, Franklin Lakes, NJ, USA) and T cells were enriched with RosetteSep Human CD4 Enrichment Cocktail for Treg analysis or RosetteSep human T cell enrichment cocktail for naïve and effector T cell analysis (StemCell Technologies Inc., Vancouver, Canada) following the manufacturer’s protocol. For Treg characterization, enriched T cells were incubated with anti-CD3 (PE-Cy7), anti-CD127 (PB) and anti-CD25 (APC) for 30 min on ice (all antibodies were from Biolegend, San Diego, CA, USA). Stained cells were then washed with FACS buffer (0.5% w/v BSA, 2 mM EDTA in PBS pH 7.2) and permeabilized using fix/perm (BD Falcon, Stockholm, Sweden) after which the cells were incubated with anti-Helios (FITC) and anti-FoxP3 (PE) for 30 min. Tregs were characterized as percentage of CD25+FoxP3+ and CD127dimCD25+ cells out of CD3+CD4+ cells while FoxP3+Helios+ or Helios– Tregs are shown as percentage out of CD127dimCD25+ cells. For naïve and effector T cell analysis, enriched T cells were incubated with anti-CD45RA (FITC), anti-CD45RO (PE), anti-CD44 (PerCP), anti-CD8 (PE-Cy7), anti-CD4 (PB), anti-CD197/CCR7 (APC) and anti-CD62L (APC-Cy7) for 30 min on ice (all antibodies were from BioLegend). Stained cells were washed twice with FACS buffer and 1% Fix/Lyse (BD Falcon) was added to preserve the cells until analysis. TN cells were characterized as percentage of CD62L+CD45RO–, TCM as CD62L+CD45RO+ and TEM as CD62L–CD45RO+ out of CD3+CD4+ cells. For all analysis, cells were run on a CyAn ADP flow cytometer (Beckman Coulter, High Wycombe, UK) and analysed with FlowJo software (Tree Star, Inc. Ashland, OR, USA). CompBeads (BD Falcon) was used to correct for fluorescence spillover in multicolour analyses. CD3+CD4+ cell counts in blood were calculated from a separate flow cytometry sample using counting beads (SPHEROTM AccuCount Ultra Rainbow Fluorescent Particles, Sperotech, Steinfurt, Germany). Total counts of TEM cells were obtained by multiplying percentages of gated cells with total CD3+CD4+ lymphocyte counts.
ABPI
Blood pressure was measured in the arms over a radialis. The posterior tibial artery and the dorsal artery of the foot were used to measure blood pressure in the ankle. Blood pressure was first measured in the right arm, and, continuing with right foot and left foot and finally left arm. The ABPI was calculated as the ratio between the highest arm systolic blood pressure value (left or right) and the highest systolic blood pressure value from each foot generating left and right ABPI, as previously described. 32
Ultrasound imaging for intima-media thickness
An ultrasound measurement of the carotid artery was performed and images were saved for off-line measurement of intima-media thickness (IMT). 32 IMT was measured using a semiautomatic analysis system, artery measurement system (AMS). 33 Results are presented as the mean IMT in the common carotid artery and in the bulb.
Measurements of endothelial function and arterial stiffness
Endothelial function was measured using an EndoPat (Itamar Medical, Caesarea Industrial Park, Israel) to estimate the endothelium-dependent vasodilation following post-ischaemic hyperaemia, as previously described. 32 The reactive hyperaemia index (RHI) was calculated as a post-occlusion to pre-occlusion ratio of the signal amplitudes. Arterial stiffness was assessed by calculating pulse wave velocity (PWV) using a Sphygmocor device (Atcor Medical, Australia), as previously described. 32
Inflammatory markers in plasma
IL-6, IL-8, CX3CL1 and monocyte chemotactic protein 1 (MCP-1) were measured in plasma using the proximity extension assay (PEA) technique with the Proseek Multiplex CVD96x96 reagents kit (Olink Bioscience, Uppsala, Sweden) at the Clinical Biomarkers Facility, Science for Life Laboratory, Uppsala. 34 Data analysis was performed by a preprocessing normalization procedure using Olink Wizard for GenEx (Multid Analyses, Sweden).
Statistics
Mann–Whitney U test was used to assess differences in continuous variables, and chi-square test was used for categorical variables. Differences among groups were analysed using one-way analysis of variance (ANOVA) (Kruskal Wallis) with Dunn’s multiple comparison test and two-way ANOVA was used to test for interactions. For two-way ANOVA, values were log-transformed before analysis. Spearman’s rank correlation coefficients were used to examine associations between continuous variables and partial correlation analysis was used for IMT and ABPI measurements, to adjust for age and gender. Binary logistic regression models were used to correct for cofounders and to calculate independent associations. Data are shown as median and interquartile range (IQR) or percentage. p⩽ 0.05 was considered significant. All statistical analyses were performed using SPSS 24 or Graph Pad Prism 7.0.
Results
Blood was drawn from 198 subjects and enriched for T cells before CD4+ T-cell subsets were analysed by flow cytometry. Patient characteristics are shown in Table 1. In this study, we examined antigen-experienced T cells (CD45RA–CD45RO+), total naïve T cells (CD45RA+CD45RO–), naïve T cells (TN; CD45RO–CD62L+), central memory T cells (TCM; CD45RO+CD62L–) and effector memory T cells (TEM; CD45RO+CD62L–) as percentages out of CD3+CD4+ cells. Studies on CD4+ memory T cells differ in their use of either CD62L or CD197/CCR7, both of which mark cells that home to lymphoid organs. In our study, the proportion of the T cell subsets gated on CD62L expression correlated strongly to the T-cell subsets obtained by gating on CD197/CCR7 expression (Spearman correlation coefficients: TN r = 0.980, p < 0.0001; TCM r = 0.872, p < 0.0001; TEM r = 0.913, p < 0.0001). We also analysed Tregs defined as either percentage CD25+FoxP3+ or CD25+CD127dim cells out of CD3+CD4+ cells. The frequency of Tregs produced by the two different Treg definitions demonstrated a high level of co-variation (r = 0.908, p < 0.001). Furthermore, we utilized the presence or absence of the transcription factor Helios to characterize two subpopulations of Tregs (Helios positive/negative). The percentage of Helios+ Tregs was positively associated with CD25+FoxP3+ Tregs (r ⩾ 0.275, p < 0.001) while Helios– Tregs was not. Gating strategies for the studied T-cell populations are shown in Figure 1.
Patient characteristics.
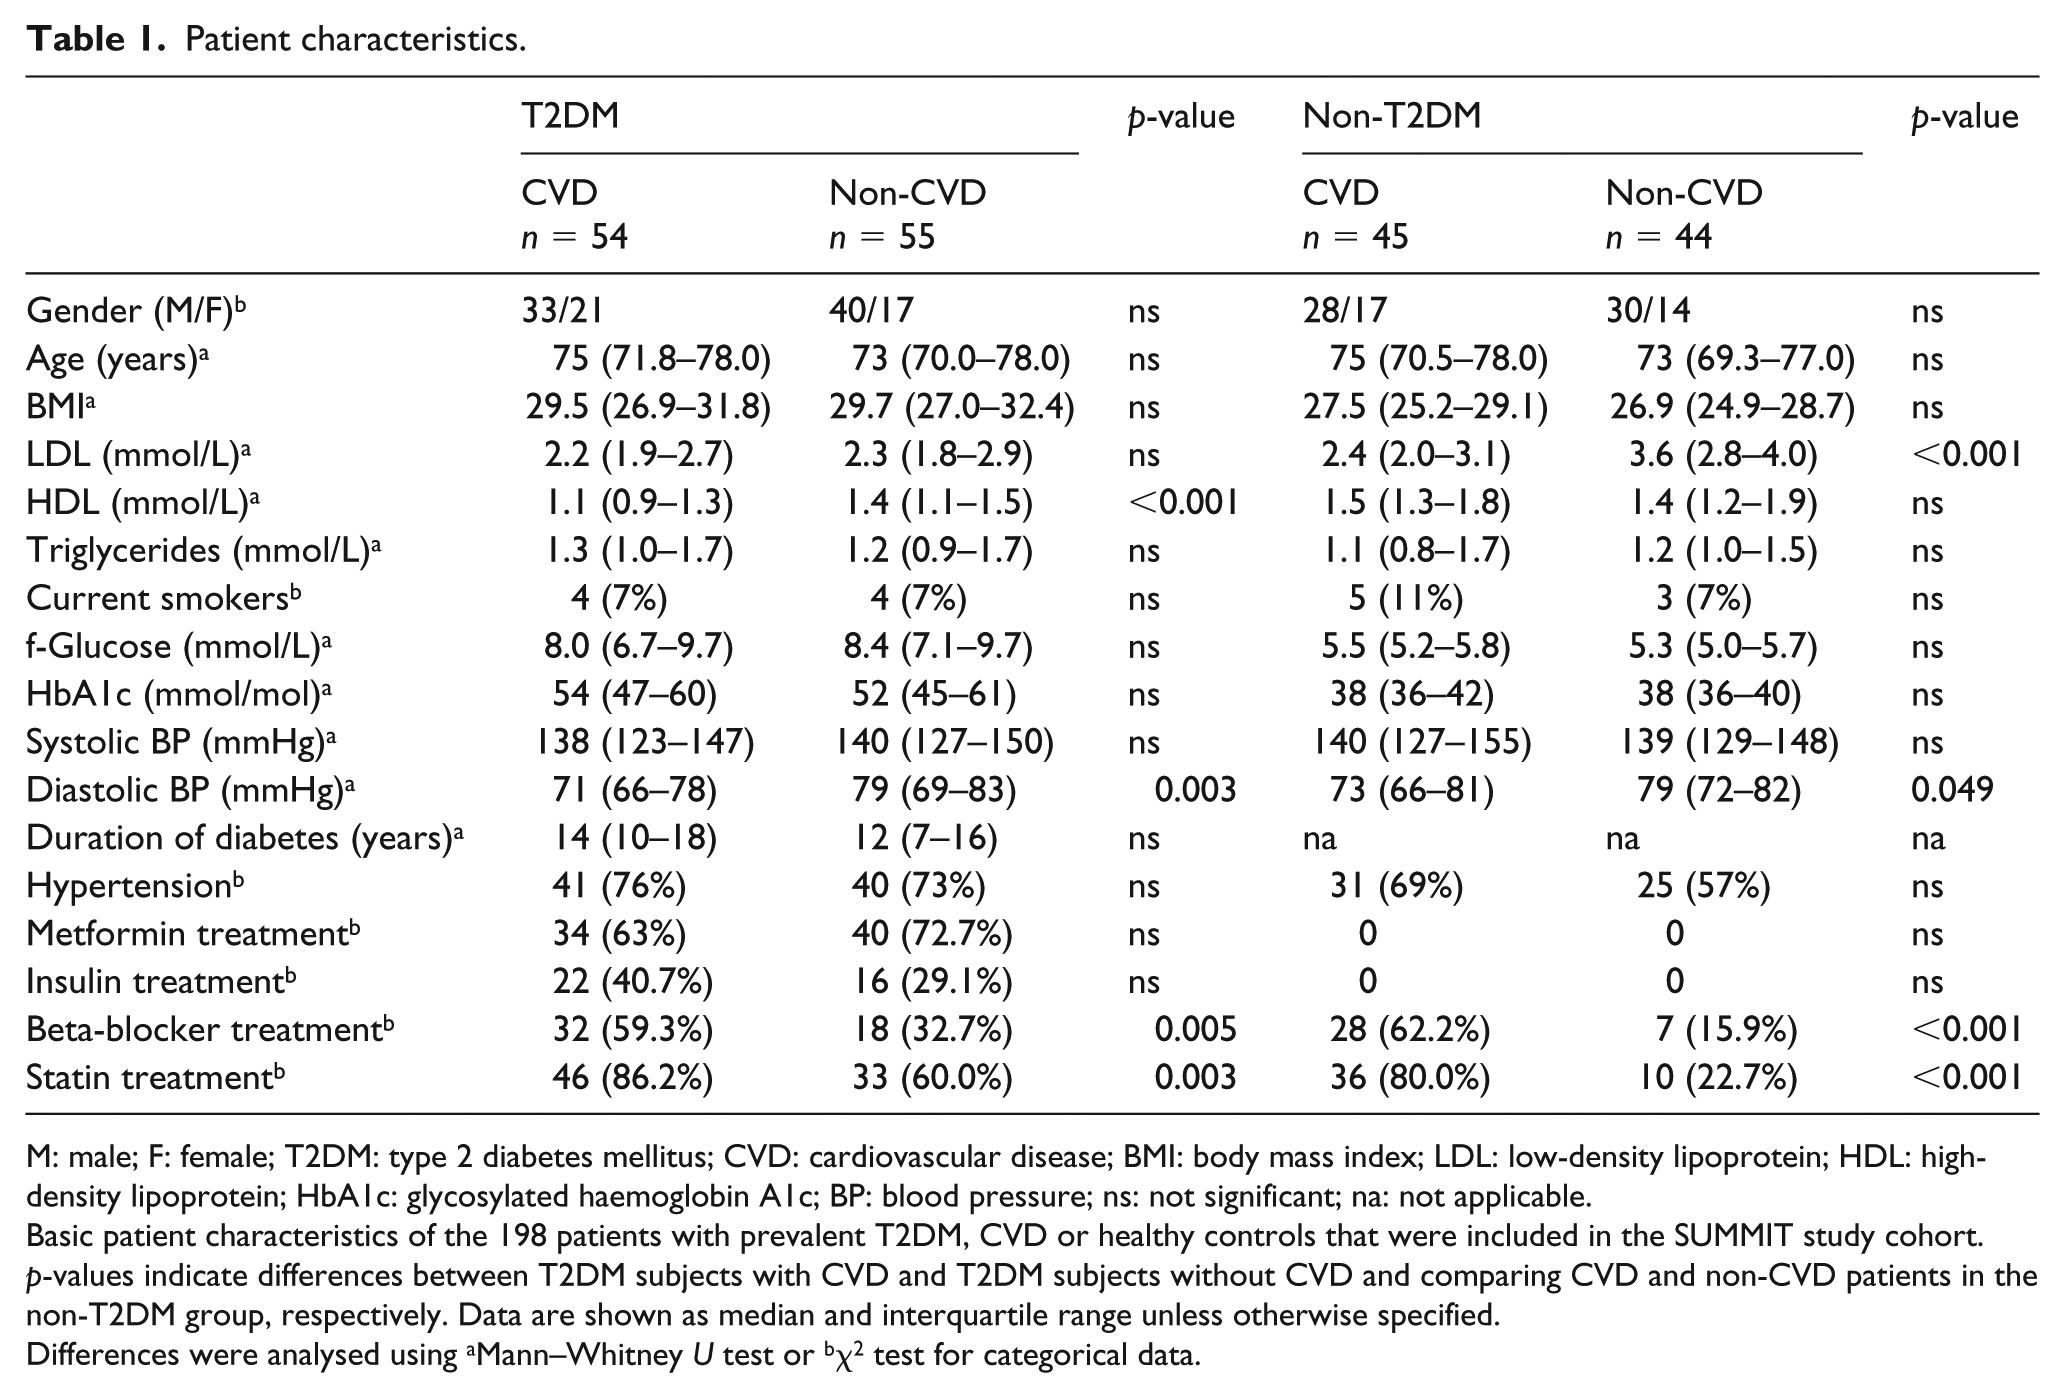
M: male; F: female; T2DM: type 2 diabetes mellitus; CVD: cardiovascular disease; BMI: body mass index; LDL: low-density lipoprotein; HDL: high-density lipoprotein; HbA1c: glycosylated haemoglobin A1c; BP: blood pressure; ns: not significant; na: not applicable.
Basic patient characteristics of the 198 patients with prevalent T2DM, CVD or healthy controls that were included in the SUMMIT study cohort. p-values indicate differences between T2DM subjects with CVD and T2DM subjects without CVD and comparing CVD and non-CVD patients in the non-T2DM group, respectively. Data are shown as median and interquartile range unless otherwise specified.
Differences were analysed using aMann–Whitney U test or bχ2 test for categorical data.
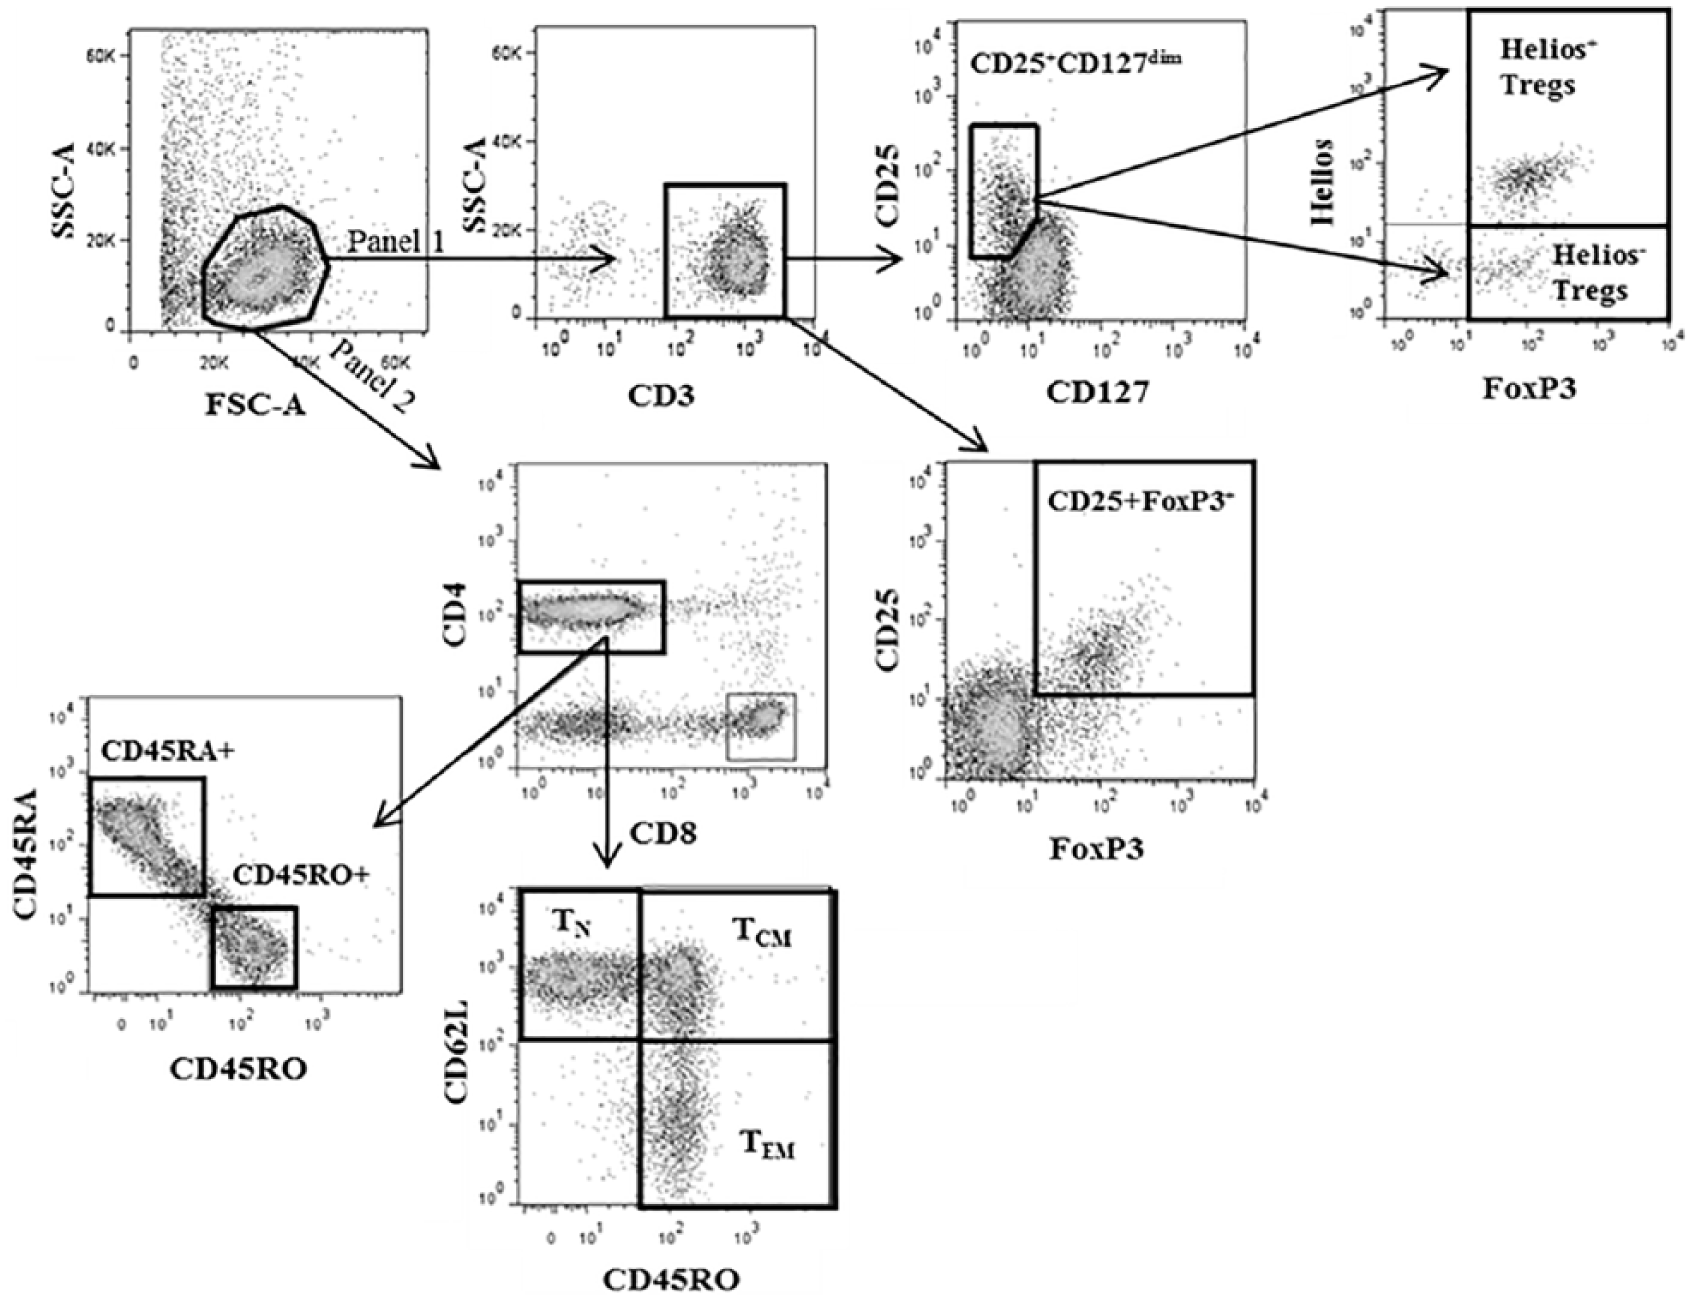
Gating strategy for flow cytometry analysis of T helper cell populations.
First, we compared the percentages of the different T-cell subpopulations between subjects with and without T2DM (Table 2). Strikingly, T2DM was associated with elevated percentages of CD45RO+, TEM and TCM and reduced percentages of CD45RA+ and TN, while no difference was observed for Tregs. Next, we wanted to know whether the proportions of T-cell sub-populations differed in T2DM patients with and without prevalent CVD. Interestingly, we observed elevated percentages of TEM in T2DM patients with CVD compared to T2DM patients without CVD [median 26.4% (IQR, 18.1–33.0) vs 18.4% (IQR, 12.9–24.7) p = 0.012, Figure 2(a)]. The difference was independent of CVD risk factors in T2DM subjects according to the The UK Prospective Diabetes Study (UKPDS) risk engine 35 (age, sex, duration of diabetes, current smokers, total cholesterol, HDL, HbA1c, systolic blood pressure and ethnicity) with an OR of CVD in T2DM of 1.045 (95% CI, 1.001–1.092) per percent increase in TEM (p = 0.047). T2DM patients with CVD displayed the highest percentages of TEM and lower percentages of TN cells, compared to non-diabetic control groups (Figure 2(a) and (b)). No difference was observed for TCM levels between the patient groups in this analysis (data not shown) nor was there any difference in percentages of Tregs among T2DM patients with and without CVD (Figure 2(c) and (d)). Notably, we also observed an interaction between T2DM and CVD for TEM in a two-way ANOVA (pinteraction = 0.028) but not for the other T-cell subpopulations. There was no significant difference in absolute TEM counts between T2DM patients with and without CVD [34.4 (IQR, 11.2–63.6) cells/μL vs 35.5 (IQR, 18.8–72.1) cells/μL, respectively], suggesting that the relative levels of TEM, not absolute counts, is the important discriminating factor for CVD risk in T2DM patients.
T cell populations comparing patients with and without T2DM.
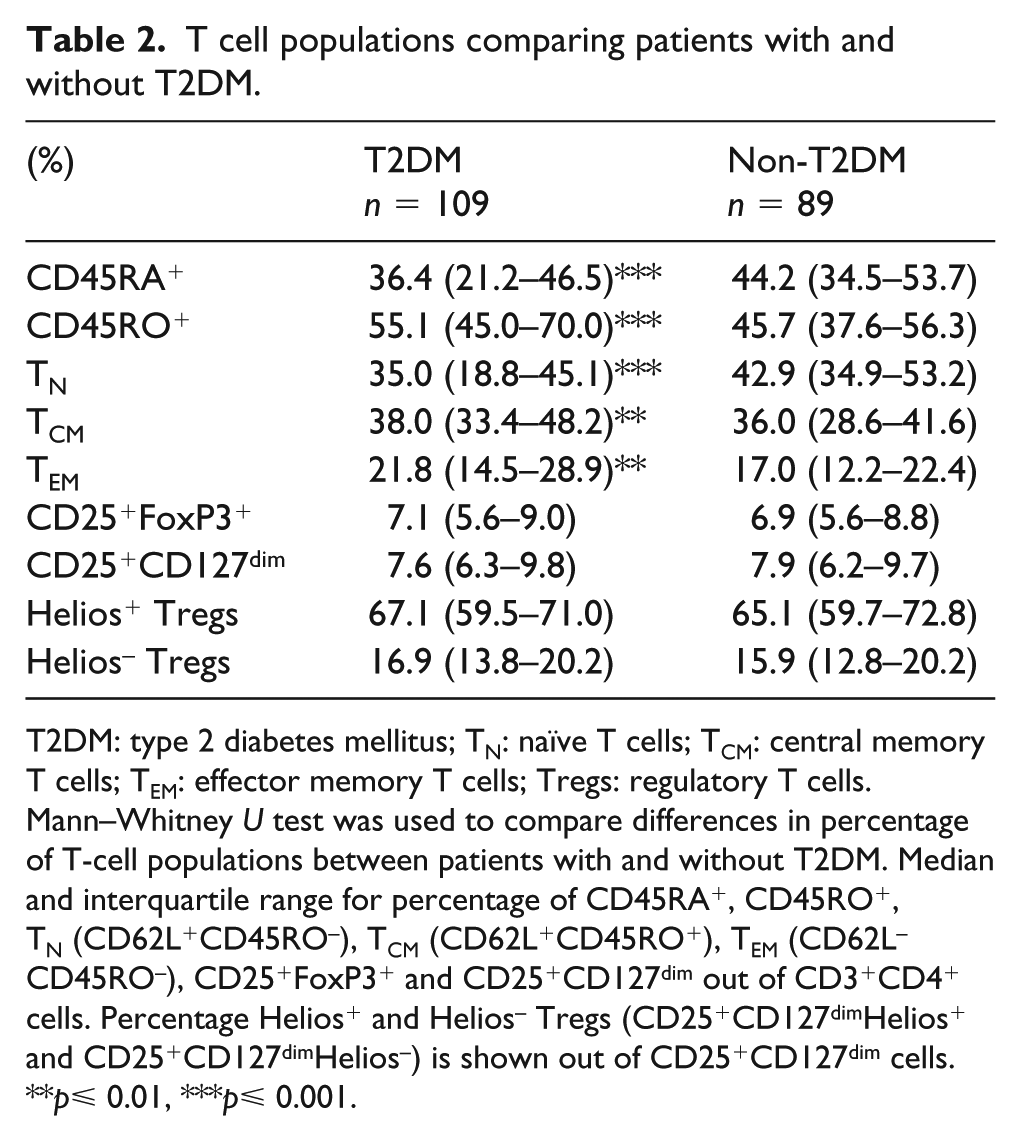
T2DM: type 2 diabetes mellitus; TN: naïve T cells; TCM: central memory T cells; TEM: effector memory T cells; Tregs: regulatory T cells.
Mann–Whitney U test was used to compare differences in percentage of T-cell populations between patients with and without T2DM. Median and interquartile range for percentage of CD45RA+, CD45RO+, TN (CD62L+CD45RO–), TCM (CD62L+CD45RO+), TEM (CD62L–CD45RO–), CD25+FoxP3+ and CD25+CD127dim out of CD3+CD4+ cells. Percentage Helios+ and Helios– Tregs (CD25+CD127dimHelios+ and CD25+CD127dimHelios–) is shown out of CD25+CD127dim cells.
p⩽ 0.01, ***p⩽ 0.001.
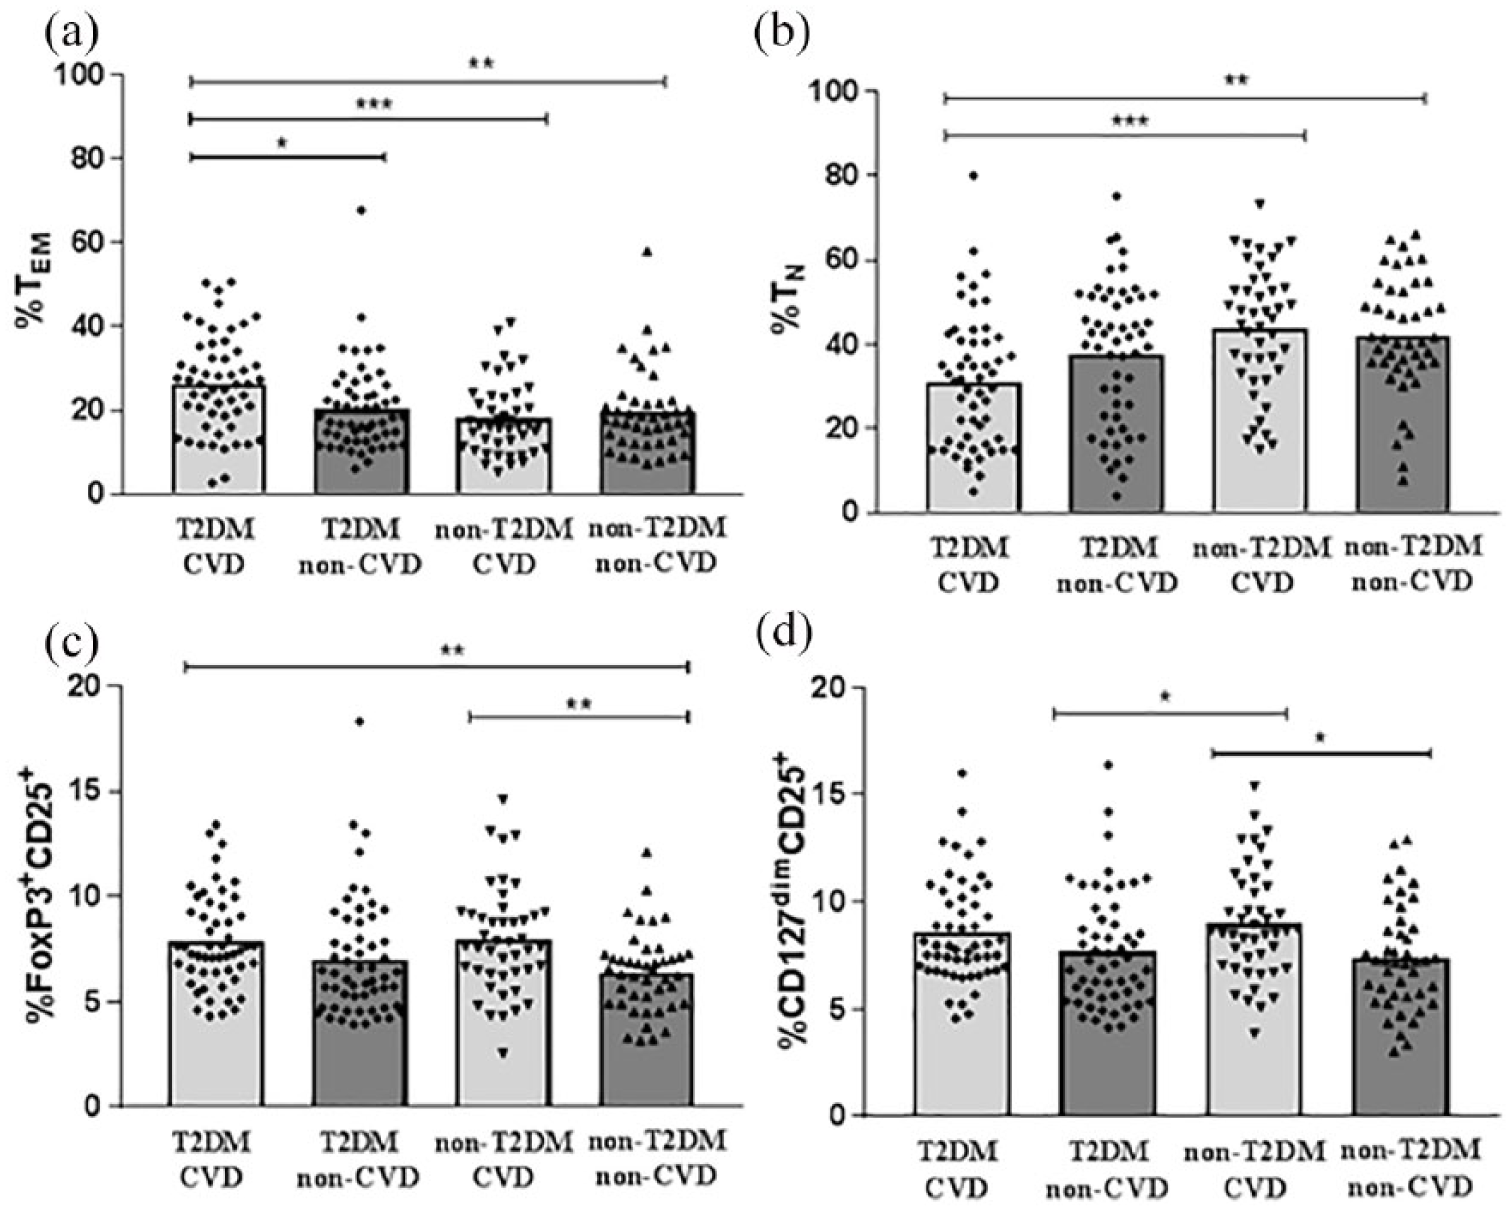
T2DM Patients with prevalent CVD have higher levels of T effector memory cells.
Unexpectedly, the percentages of Tregs in non-diabetic patients were higher in those with CVD compared to CVD-free controls [CD25+FoxP3+; median 7.6% (IQR, 6.4–9.2) vs 6.4% (4.9–7.2) p = 0.009, CD25+CD127dim; median 8.6% (IQR, 7.0–10.8) vs 5.6% (IQR, 4.9–7.2) p = 0.014, Figure 2(c) and (d)]. This difference was shown to be independent of Framingham CVD risk factors [age, gender, total cholesterol, HDL, systolic blood pressure, current smoker; CD25+FoxP3+, OR 1.391 (95% CI, 1.060–1.826), p = 0.017, and CD25+CD127dim; OR 1.309 (95% CI, 1.050–1.632), p = 0.017]. No differences between the four patient groups were observed when distinguishing Tregs based on Helios expression (data not shown). In our study cohort, almost all CVD patients (83%) were treated with statins. Statin treatment has previously been shown to affect the immune system and to increase the levels of Tregs, both in mice and in patients with ST-elevation myocardial infarction (STEMI).36,37 Accordingly, we observed increased frequencies of Tregs in patients treated with statins (Table 3), which is likely to have contributed to the increase in Tregs observed in non-T2DM subjects with prevalent CVD. However, the association between increased Tregs and CVD remained significant after adjusting for the use of statins together with the Framingham CVD risk factors [CD25+FoxP3+; OR 1.36 (95% CI, 1.036–1.772), p = 0.027, and CD25+CD127dim; OR 1.30 (95% CI, 1.028–1.646), p = 0.029]. The levels of TN, TCM and TEM were similar in subjects with and without statin treatment (Table 3).
Mann–Whitney U test comparing T-cell populations in patients with or without statin treatment.
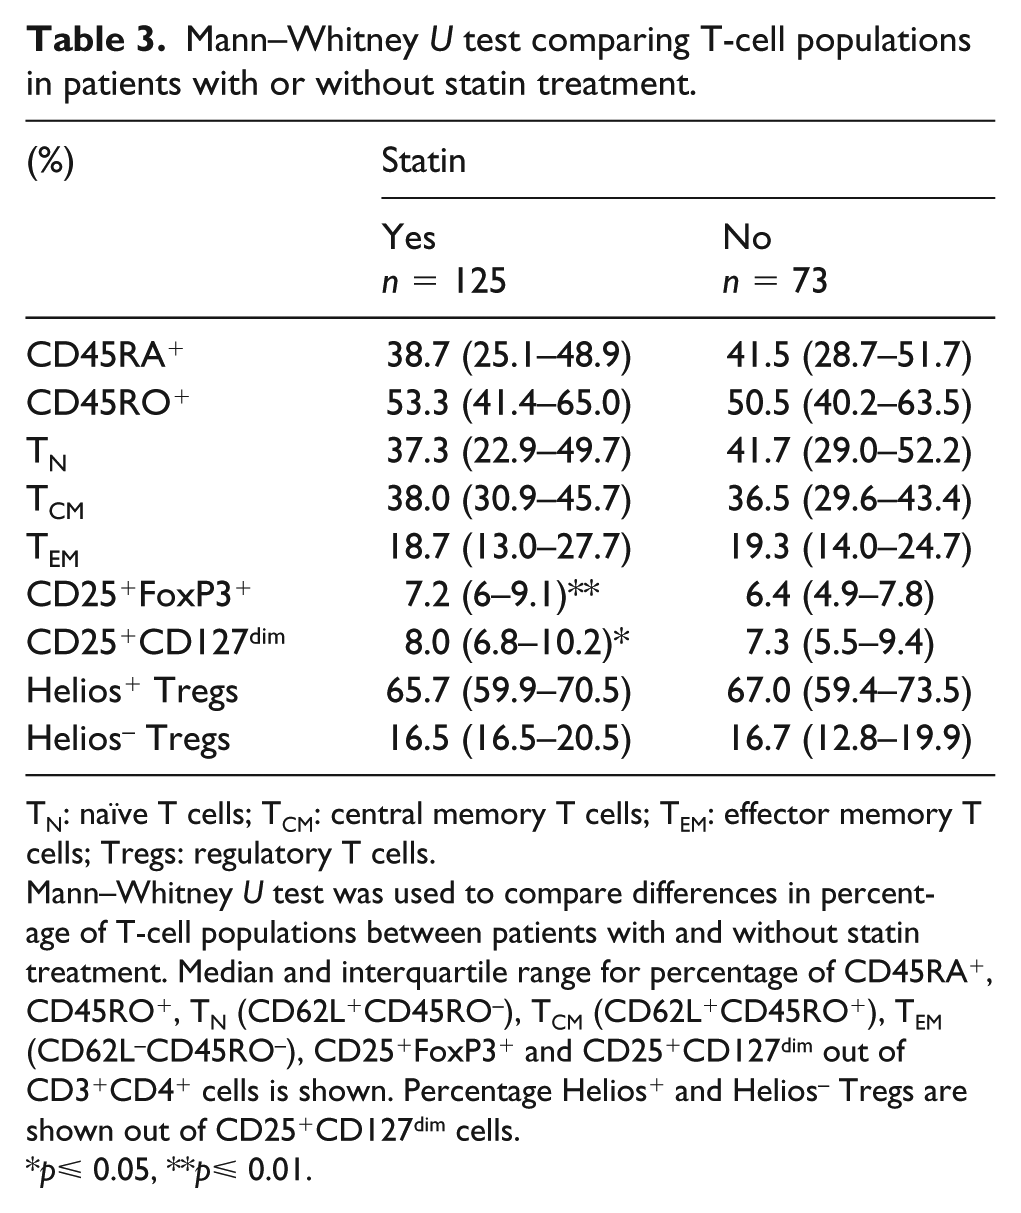
TN: naïve T cells; TCM: central memory T cells; TEM: effector memory T cells; Tregs: regulatory T cells.
Mann–Whitney U test was used to compare differences in percentage of T-cell populations between patients with and without statin treatment. Median and interquartile range for percentage of CD45RA+, CD45RO+, TN (CD62L+CD45RO–), TCM (CD62L+CD45RO+), TEM (CD62L–CD45RO–), CD25+FoxP3+ and CD25+CD127dim out of CD3+CD4+ cells is shown. Percentage Helios+ and Helios– Tregs are shown out of CD25+CD127dim cells.
p⩽ 0.05, **p⩽ 0.01.
Several T-cell subsets were associated with diabetes-related metabolic parameters (Table 4). For example, TCM and TEM were positively and TN negatively correlated to HbA1c. Tregs, TCM and TEM were inversely associated with HDL, whereas a positive association was seen for TN and HDL. Interestingly, we observed a positive association between Tregs and TCM and TEM frequencies, while there was a negative association between Tregs and TN (Table 5). There were no associations between the T-cell subpopulations and the general inflammatory markers IL-6, IL-8, CX3CL1 or MCP-1 in plasma (Table 5).
Associations between T-cell subsets and metabolic parameters.
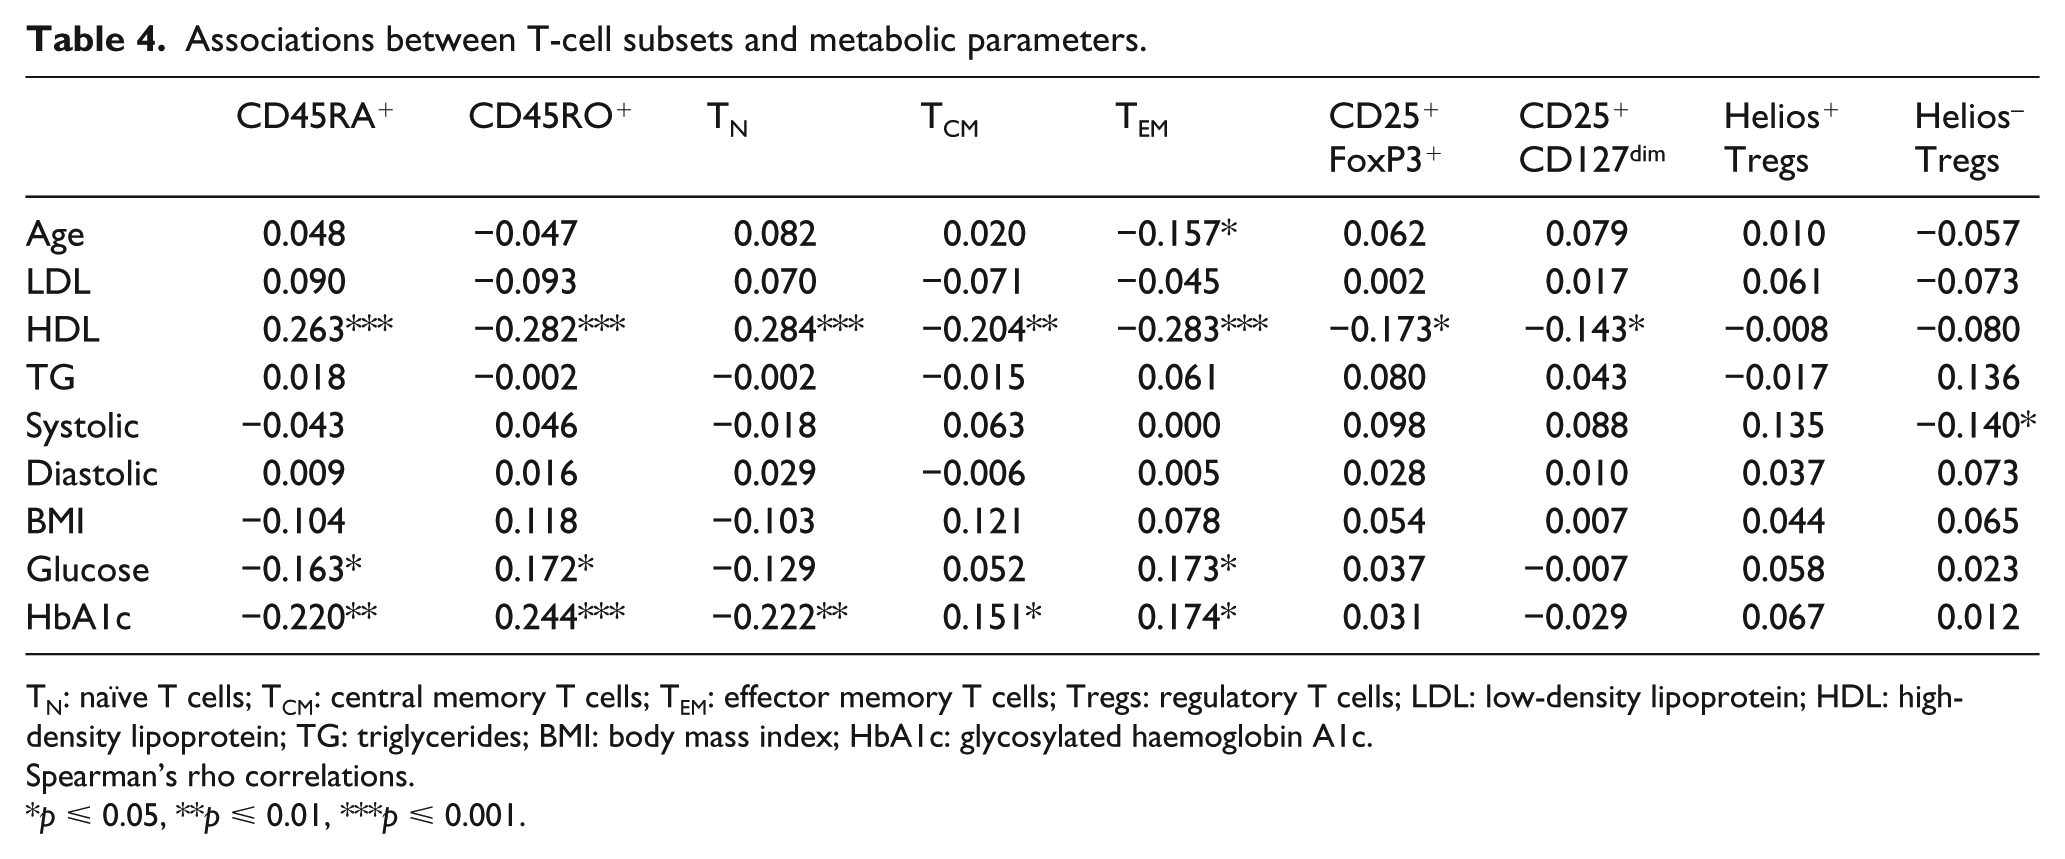
TN: naïve T cells; TCM: central memory T cells; TEM: effector memory T cells; Tregs: regulatory T cells; LDL: low-density lipoprotein; HDL: high-density lipoprotein; TG: triglycerides; BMI: body mass index; HbA1c: glycosylated haemoglobin A1c.
Spearman’s rho correlations.
p ⩽ 0.05, **p ⩽ 0.01, ***p ⩽ 0.001.
Spearman’s rho correlation coefficients for T-cell populations and inflammatory markers.
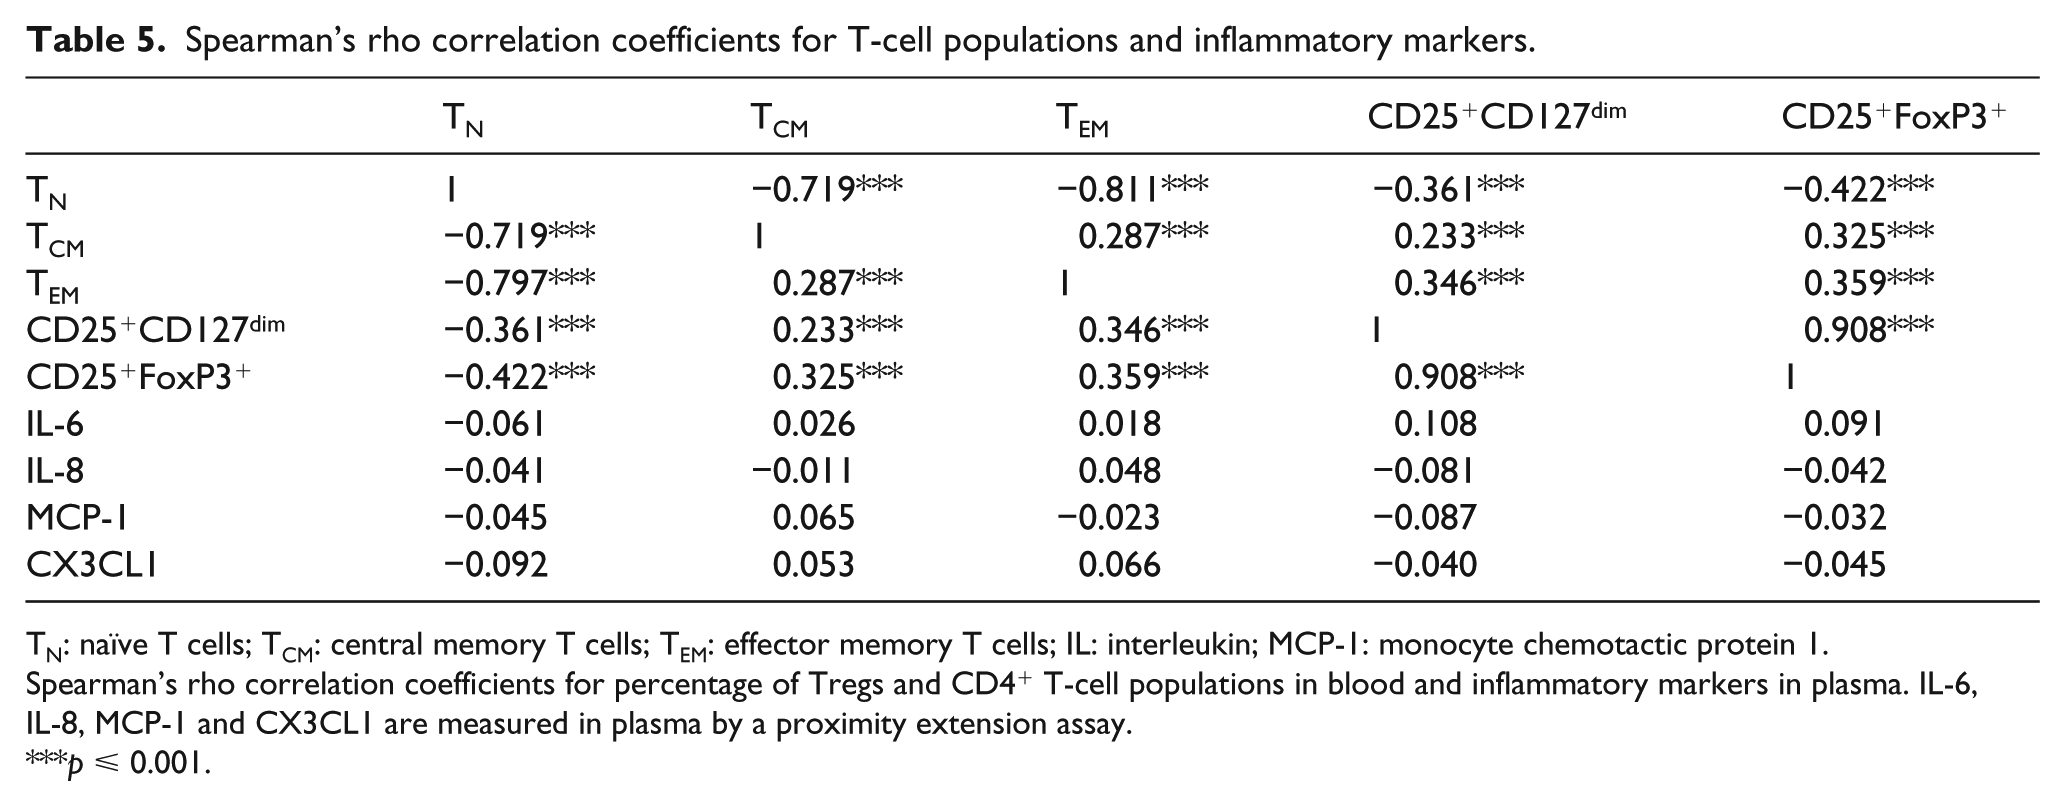
TN: naïve T cells; TCM: central memory T cells; TEM: effector memory T cells; IL: interleukin; MCP-1: monocyte chemotactic protein 1.
Spearman’s rho correlation coefficients for percentage of Tregs and CD4+ T-cell populations in blood and inflammatory markers in plasma. IL-6, IL-8, MCP-1 and CX3CL1 are measured in plasma by a proximity extension assay.
p ⩽ 0.001.
The increased risk of CVD in T2DM subjects has previously been associated with endothelial dysfunction and dysregulated tissue repair.3,4 In this study, we found no associations between the levels of TN, TCM or TEM and vascular dysfunction (RHI, PWV, intima-media thickness; Tables 6 and 7) or the plasma levels of tissue repair growth factors [platelet-derived growth factor, epidermal growth factor (EGF), heparin-binding EGF; Table 6]. However, TEM were inversely associated with ABPI, indicating increased lower extremity arterial disease in subjects with high levels of circulating TEM cells (Table 7). Tregs were inversely associated with EGF and platelet-derived growth factor B (PDGF-B) levels in plasma as well as with ABPI (Tables 6 and 7).
Associations between T-cell subsets and measurements of growth factors and vascular function.
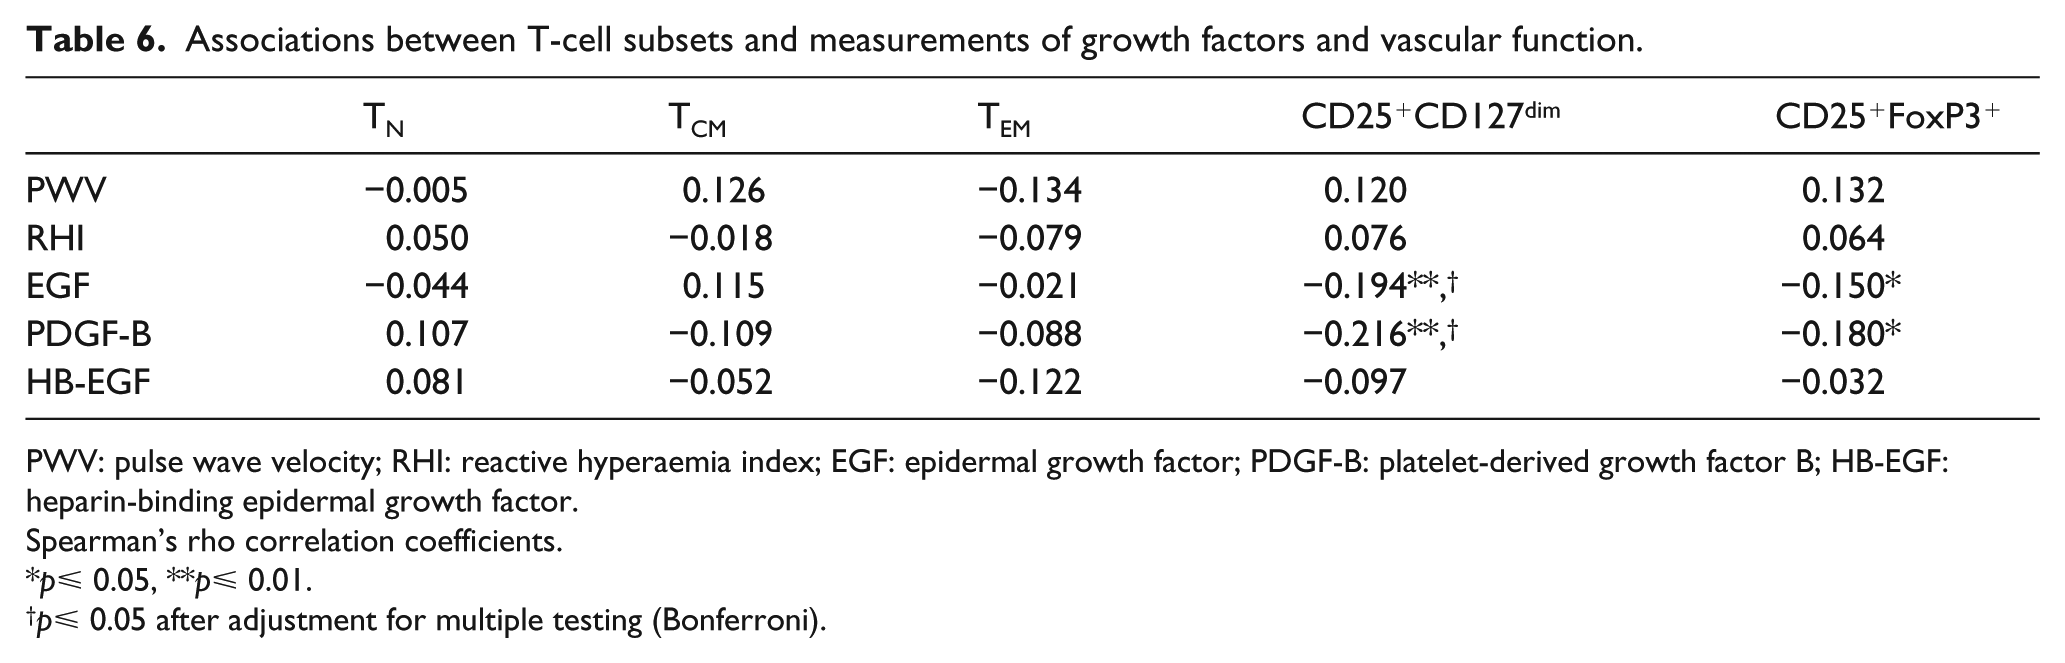
PWV: pulse wave velocity; RHI: reactive hyperaemia index; EGF: epidermal growth factor; PDGF-B: platelet-derived growth factor B; HB-EGF: heparin-binding epidermal growth factor.
Spearman’s rho correlation coefficients.
p⩽ 0.05, **p⩽ 0.01.
p⩽ 0.05 after adjustment for multiple testing (Bonferroni).
Associations between T-cell subsets and IMT and ABPI.
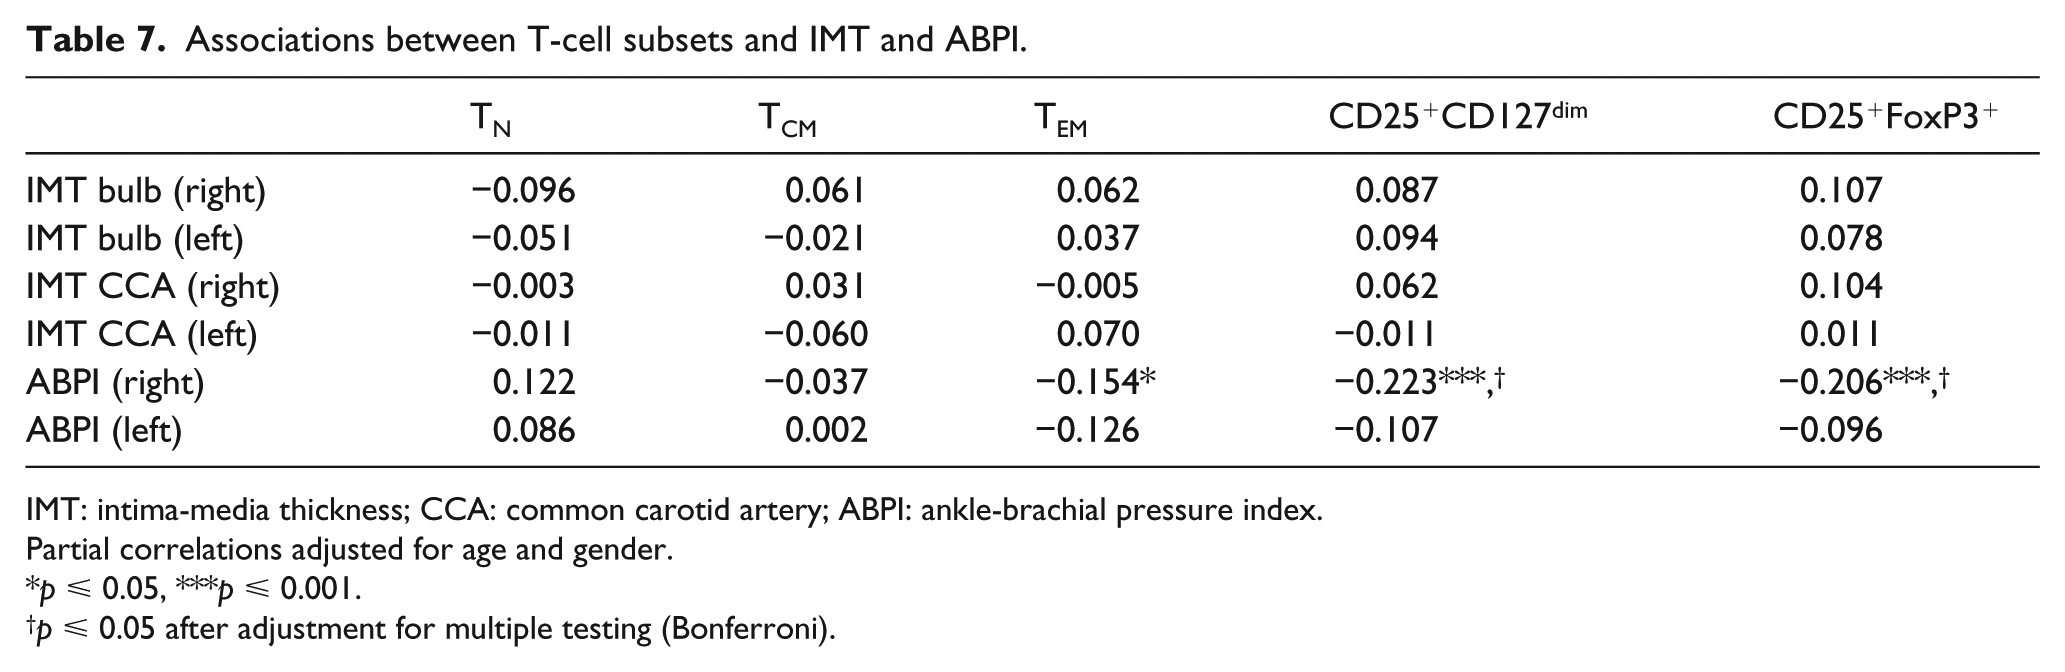
IMT: intima-media thickness; CCA: common carotid artery; ABPI: ankle-brachial pressure index.
Partial correlations adjusted for age and gender.
p ⩽ 0.05, ***p ⩽ 0.001.
p ⩽ 0.05 after adjustment for multiple testing (Bonferroni).
Discussion
In this study, we show that the percentage of memory CD4+ T cells, both central memory (TCM) and effector memory T cells (TEM), is increased in subjects with T2DM, whereas the percentage of naïve T cells is decreased. These findings are in agreement with diabetes being associated with a state of exacerbated immune activation and increased inflammation3,5 and raise the possibility that the increased inflammatory state in diabetes may be partly due to dysregulated activation of adaptive immunity. Alternatively, the increased level of memory T cells reflects an increased infectious disease burden, as patients with diabetes display an increased risk of infections. 38 Remarkably, the exacerbated immune activation was most prominent in T2DM patients with CVD, whereas CVD patients without diabetes were indistinguishable from healthy individuals. This finding was independent of risk factors included in the UKPDS risk engine, which has been developed to predict CVD in T2DM subjects. 35 It is also unlikely that this can be explained by a more severe or long-term diabetes in the T2DM with CVD group as there are no differences in duration of diabetes or HbA1c levels between T2DM patients with or without CVD. The independent interaction between T2DM and CVD suggests that the effector memory/naïve T cell balance is of importance for the increased manifestation of CVD in T2DM patients. Further studies are needed to elucidate whether patients with diabetes have increased levels of TEM recognizing plaque antigens such as apolipoprotein B100 or whether the T-cell activation is due to viral or bacterial infections.
Olson et al. 39 have previously showed that memory T cells defined as CD4+CD45RA–CD45RO+ were increased in patients with prevalent diabetes, whereas naïve CD4+CD45RA+CD45RO– T cells were decreased. Ammirati et al. 13 have reported that TEM (defined as CD3+CD4+CD45RA–CD45RO+CCR7–) was associated with intima-media thickness as well as with chronic stable angina and acute myocardial infarction. Intima-media thickness and ABPI have been shown to be an important surrogate markers of macrovascular changes associated with diabetes. 32 We did not see any association between the different T-cell subpopulations and mean intima-media thickness. However, we observed an inverse association between TEM frequencies and ABPI supporting our finding that TEM levels are associated with CVD, especially lower extremity arterial disease, in T2DM subjects. Interestingly, Ammirati et al. 13 also reported that TEM levels were increased in patients with diabetes (n = 14, 17% of total patients) compared to controls. This is, although the sample size was small, in line with our findings. Little is known regarding the relationship between CD4+ T cells and CVD in T2DM. Giubilato et al. 40 observed that CD4+CD28null cells are increased in diabetic patients with acute coronary syndrome. In the same study, this subpopulation of pro-atherogenic T cells also predicted event-free survival during a 3-year follow-up.
Interestingly, in our cohort, we observed a negative relationship between HDL and TCM, TEM and Tregs while the opposite was seen for TN. Recent studies have demonstrated that HDL might affect autoimmunity, possibly by influencing leukocyte cholesterol content. 41 Lipid rafts are important in organizing cellular components needed to come together upon T-cell receptor interaction with MHC-II. 42 Moreover, Ldlr–/– mice deficient in ApoA-I display an autoimmune phenotype and exacerbated atherosclerosis. 43 Administration of ApoA-I reduced the levels of T effector cells and increased levels of Tregs in mice. 44 Another study demonstrated that HDL promoted Treg survival in vitro. 45 However, in our cohort, Tregs were inversely associated with HDL, suggesting that HDL is not a key factor regulating Treg levels. Further studies are needed to determine whether HDL influences lipid rafts and subsequent T-cell activation in man.
There are some limitations of this study that need to be considered. Most importantly, this observational study only provides associations and no causal evidence. For instance, this study cannot answer whether the difference in T cell levels is a cause of the CVD event or if the levels differed even before the event. Another limitation associated with the cohort, which complicates biological interpretation of associations, is that the patients are not newly diagnosed, nor have they experienced recent clinical complications. It should also be noted that the patients included in this cohort are relatively old (73–75 years of age). Booth et al. 46 previously reported that even though there is an increased risk of CVD with age in patients with diabetes, the relative risk of diabetes-associated CVD reduces with age. We cannot exclude the possibility that immune cells may display a larger, or alternatively, a more limited association with CVD in younger T2DM patients. One technical drawback of the study design is the pre-enrichment of cells that was performed prior to flow cytometry in order to maximize the number of markers that could be included for each analysis. Even though this is a well-validated method, we cannot exclude that it might affect T-cell subset ratios. Importantly, all patients went through the same procedure and all patients would hence be equally affected.
Almost all CVD patients (83%) as well as many T2DM patients (73%) in our study were treated with statins. Statin treatment has previously been shown to affect the immune system and to increase the levels of Tregs, both in vitro and in mouse studies as well as in patients with STEMI.36,37,47 In accordance, we observed increased frequencies of Tregs in patients treated with statins while levels of the other T-cell populations were similar. This may have contributed to the increase in Tregs observed in non-T2DM patients with prevalent CVD, but the association between increased Tregs and CVD remained significant after adjusting for the use of statins and CVD risk factors, suggesting that the increased Treg frequency in these patients is not solely an effect of statin treatment. Interestingly, Treg frequencies were shown to inversely correlate with circulating TN cells while a positive association was observed with TEM. Endarterectomy samples with an unstable phenotype have been shown to display high levels of FoxP3-positive area, as determined by immunohistochemistry, 48 suggesting that Tregs may expand as a consequence of chronic inflammation. Another limitation of this study is that we have analysed the percentage of T-cell populations without examining the antigen specificity or function. It is possible that the CVD patients in our cohort have increased levels of Tregs but that the suppressive function is impaired. Such a phenomenon has previously been reported for Tregs isolated from patients with acute coronary syndrome.26,49 It would be interesting to study the antigen specificity and the functional characteristics of the TEM cells in T2DM patients with CVD, but the lack of reliable atherosclerosis antigens that trigger T-cell activation hampers such investigations.
In summary, we demonstrate that TEM cells are uniquely increased in patients with concomitant T2DM and CVD compared to CVD-free T2DM patients. Given the importance of T-cell subsets in atherosclerosis, this finding warrants further research into potential mechanisms by which immunity may affect diabetes-accelerated atherosclerosis.
Footnotes
Acknowledgements
D.E., S.R., M.W., I.L. and G.Ö. performed the experiments; M.P., G.N.F., H.B., E.B. and J.N. designed the study; S.R., D.E., H.B. and J.N. analysed the data and wrote the paper. All authors read and edited the manuscript.
Authors’ Contribution
Sara Rattik and Daniel Engelbertsen contributed equally to this work.
Declaration of conflicting interests
The author(s) declared no potential conflicts of interest with respect to the research, authorship and/or publication of this article.
Funding
The author(s) disclosed receipt of the following financial support for the research, authorship and/or publication of this article: This work was supported by funding from the Innovative Medicines Initiative, the SUMMIT consortium (IMI-2008/115006); the Swedish Research Council; Swedish Heart and Lung Foundation; and the Swedish Foundation for Strategic Research. S.R. and D.E. are supported by fellowships from the Swedish Research Council. H.B. holds a fellowship sponsored by the Swedish Heart and Lung Foundation. The sponsors did not take any part in the study design or in the collection, analysis and interpretation of data.