
Abstract
Objective:
To examine the association between haemoglobin A1c variability and macrovascular complication in type 2 diabetes.
Methods:
We retrospectively enrolled 5278 diabetes patients with no history of cardiovascular disease and atherosclerosis by ultrasound at their first visit to the hospital from 1999 to 2010. Patients had a median of 4 haemoglobin A1c (range = 3–9) measurements during follow-up. Average haemoglobin A1c and haemoglobin A1c variability were calculated as intra-individual mean, standard deviation, coefficient of variation and adjusted standard deviation. Cardiovascular disease events and ultrasound results were re-evaluated from the medical history at the end of the study.
Results:
A total of 972 patients had macrovascular complication. Compared to those without atherosclerosis/cardiovascular disease (n = 4306), haemoglobin A1c intra-individual mean and haemoglobin A1c variability levels were significantly higher in patients with macrovascular complication (p < 0.001). Multivariable logistic regression analysis showed that haemoglobin A1c variability was associated with macrovascular complication. Moreover, 488 patients with only atherosclerosis had significantly higher haemoglobin A1c intra-individual mean and haemoglobin A1c variability values than those without atherosclerosis/cardiovascular disease (p < 0.001), but in 484 patients with cardiovascular disease incidents, only higher haemoglobin A1c intra-individual mean level was found (p = 0.004).
Conclusions:
In Chinese type 2 diabetes, haemoglobin A1c variability was associated with macrovascular complication. Long-term stabilization of glucose is important in diabetes management, especially in the early stage of atherosclerosis.
Introduction
It is conclusively established that patients with diabetes have an increased risk to develop cardiovascular disease (CVD). Chronic hyperglycemia and glycemic variability are two major characteristics of glucose patterns in diabetes patients. Long-term glycemic variability, which is assessed by haemoglobin A1c (HbA1c) fluctuation, reflects changes in glycemic control over longer periods of time. 1 Increased HbA1c variability has been linked to retinopathy, nephropathy, cardiovascular events and possibly mortality, in addition to average HbA1c levels alone.2–6
Particularly, the association between HbA1c variability and CVD was suggested in several studies of patients with type 1 diabetes. In the Finnish Diabetic Nephropathy study, HbA1c variability was predictive of incident cardiovascular events. 5 The Pittsburgh Epidemiology of Diabetes Complications Study reported that changes in HbA1c over time were more strongly associated with coronary artery disease than was the baseline HbA1c value. 7 However, studies on the impact of HbA1c variability on CVD development in patients with type 2 diabetes are inconclusive. Hirakawa et al. 8 assessed the effects of visit-to-visit variability in HbA1c on major outcomes in the Action in Diabetes and Vascular Disease: Preterax and Diamicron MR Controlled Evaluation (ADVANCE) trial and found that increased HbA1c variability was associated with an increased risk of vascular events. In a prospective cohort of 8439 Hong Kong patients with type 2 diabetes recruited from 1994 to 2007, the adjusted standard deviation of HbA1c measurements (adj-HbA1c-SD) was found to be associated with CVD independent of the mean HbA1c level and other confounding variables. 9 In contrast, Penno et al. 10 performed a cross-sectional analysis of the renal insufficiency and cardiovascular events (RIACE) Italian multicenter study and found that HbA1c variability did not have a major impact on macrovascular complications. Also, Kim et al. 11 found that higher HbA1c variability is not an independent predictor of carotid intima–media thickness progression. The inconclusive relationship between HbA1c variability and CVD in type 2 diabetes suggests that this relationship is complex and multifaceted. Therefore, the aim of this study was to explore the association between several measures of long-term glycemic variability and macrovascular complication in type 2 diabetes patients to gain insight into the clinical significance of this relationship.
Patients and methods
Patients and study design
This study retrospectively enrolled 5278 patients with type 2 diabetes who had no history of CVD or atherosclerosis of carotid artery and lower limb vasculature tested by ultrasound when they first visited our hospital anytime from the year of 1999 to the year of 2010. Baseline was defined as the date of enrollment and prevalent CVD events and patients’ ultrasound results were re-evaluated from the medical history at the end date of the study (31 December 2011). During the follow-up, patients had a median of 4 HbA1c (range = 3–9) measurements, which were serially measured at intervals of 3–18 months. The ultrasound examinations were performed at baseline, at the end of the study and at each time of visits during the follow-up, with an interval of 12–24 months.
The original study received approval from the Ethics Committees of Shanghai Jiao Tong University Affiliated Sixth People’s Hospital in accordance with the principle of the Helsinki Declaration. Written informed consent was obtained from each participant.
Laboratory measurements
HbA1c was measured by high-performance liquid chromatography (Variant II HbA1c analyzer; Bio-Rad Laboratories, Hercules, CA, USA) with inter- and intra-assay coefficients of variation <3.5% and <3.0%, respectively. The laboratory successfully participated in the HbA1c quality Assessment Program of the Chinese Ministry of Health. Serum lipids including triglycerides (TG), total cholesterol (TC), high-density lipoprotein cholesterol (HDL-C) and low-density lipoprotein cholesterol (LDL-C); hepatic enzymes; and renal function biomarkers including blood urea nitrogen (BUN), plasma creatinine and uric acid were measured by standard methods using an automated biochemical analyzer (H7600, Hitachi, Tokyo, Japan).
HbA1c variability
Average HbA1c values and HbA1c variability were assessed for all patients by calculating the intra-individual mean (HbA1c-MEAN) and standard deviation (HbA1c-SD), respectively. To minimize any effect of different numbers of HbA1c measurements on the calculated values, an adj-HbA1c-SD was defined according to the formula: adj-HbA1c-SD = SD / √[n / (n – 1)].1,12 Furthermore, as a normalized measure of variability, the coefficient of variation of HbA1c (HbA1c-CV) was calculated as the ratio of the HbA1c-SD to the HbA1c-MEAN and then multiplied by 100%, to correct for a larger SD due to higher absolute values of HbA1c-MEAN. 5 The HbA1c-SD, adj-HbA1c-SD and HbA1c-CV values were used as indices of HbA1c variability.
CVD risk factors
CVD risk factors were determined as part of the baseline assessment and during each clinic visit. Information on sociodemographic and lifestyle factors for all patients was collected from the physician’s electronic health records. The information included age, gender, ethnicity, body mass index (BMI), known history of hypertension or hyperlipidemia, history of chronic kidney disease, known diabetes duration, current hypoglycemic treatment (e.g. diet only, oral hypoglycemic agents and/or insulin) and smoking habits. Smoking habits were classified as ‘current smoker’ or ‘nonsmoker’. Also, blood pressure was measured twice with a mercury sphygmomanometer after participants had rested quietly for 10 min, and the average blood pressure level was recorded.
Cardiovascular complications
Documented major acute CVD events were identified from patients’ medical history. Such events included (1) stroke or transient ischemic attack; (2) coronary artery disease, including angina pectoris diagnosed by coronary angiography, myocardial infarction or previous coronary revascularization and (3) peripheral artery disease, including foot ulcer or gangrene, amputation and lower limb revascularization.
Statistical analysis
Patients were divided into two groups: those without atherosclerosis or CVD and those with either atherosclerosis on ultrasound or with prevalent CVD events. Data were expressed as median [interquartile range (IQR)] for skewed variables and/or mean ± SD for continuous variables, and numbers of cases and percentages for categorical variables. Continuous variables were compared between two groups by Student’s t test for normally distributed variables and by Mann–Whitney U test for variables with a skewed distribution. Pearson chi-square was applied to categorical variables.
Logistic regression analyses with stepwise selection were performed to assess whether increased values of HbA1c-MEAN, HbA1c-CV, HbA1c-SD and adj-HbA1c-SD correlated independently with atherosclerosis/CVD complications. Covariates were age, BMI, sex, known disease duration, smoking habits, blood pressure, lipid levels, follow-up time, the number of HbA1c measurements and therapy regimen. The results of these analyses were expressed as odds ratios (ORs) with 95% confidence intervals (CIs).
All p values were two-sided, and a p value less than 0.05 was considered statistically significant. Statistical analyses were performed using SPSS version 23.0 (SPSS Inc., Chicago, IL, USA).
Results
Characteristics of study subjects
A total of 5278 patients with type 2 diabetes with no previous medical history of CVD events or atherosclerosis of carotid artery and lower limb vasculature by ultrasound when first visited our hospital from 1999 to 2010 were included in the final analysis. Patients had a median (IQR) age and duration of diabetes at enrollment of 61 (52–69) and 5 (1–10) years, respectively, and a male/female ratio of 53/47. The mean follow-up time was 5.14 ± 1.79 years and patients had a median of 4 HbA1c (range = 3–9) during the follow-up.
The total study cohort had an HbA1c-MEAN of 7.20% (6.56–8.18), HbA1c-SD of 0.66% (0.36–1.24), adj-HbA1c-SD of 0.57% (0.32–1.06) and HbA1c-CV of 9.08% (5.29–15.82). Spearman analysis showed that HbA1c-MEAN was closely correlated to all variability measures including HbA1c-SD (r = 0.598, p < 0.001), adj-HbA1c-SD (r = 0.592, p < 0.001) and HbA1c-CV (r = 0.465, p < 0.001). And the three HbA1c variability parameters were closely correlated to each other as HbA1c-SD was correlated to adj-HbA1c-SD (r = 0.999, p < 0.001) and HbA1c-CV (r = 0.985, p < 0.001). Adj-HbA1c-SD was correlated to HbA1c-CV as well (r = 0.985, p < 0.001).
Of the 5278 patients enrolled, 972 (18.4%) had either atherosclerosis detected by ultrasound or major CVD events or both, and were defined as having macrovascular complication. Compared with individuals without atherosclerosis/CVD, patients with macrovascular complication were followed-up for a longer time (5.11 ± 1.77 vs 5.26 ± 1.87 years, p = 0.022). The number of HbA1c values was not significantly different between two groups, with a median of 4 HbA1c (range = 3–8) in the atherosclerosis/CVD group and a median of 4 HbA1c (range = 3–9) in the patients without atherosclerosis/CVD group.
The clinical characteristics of the patients with or without atherosclerosis/CVD are shown in Table 1. Compared with individuals without atherosclerosis/CVD, patients with CVD or atherosclerosis were older, had a longer diabetes duration and had worse blood pressure control (all p < 0.05). No differences in the levels of TC, TG, HDL-C and LDL-C were observed between the groups. More patients were treated with insulin or a combination of insulin and oral hypoglycemic agents in the macrovascular complication group than those without atherosclerosis/CVD (all p < 0.05).
Clinical and laboratory characteristics of study subjects.
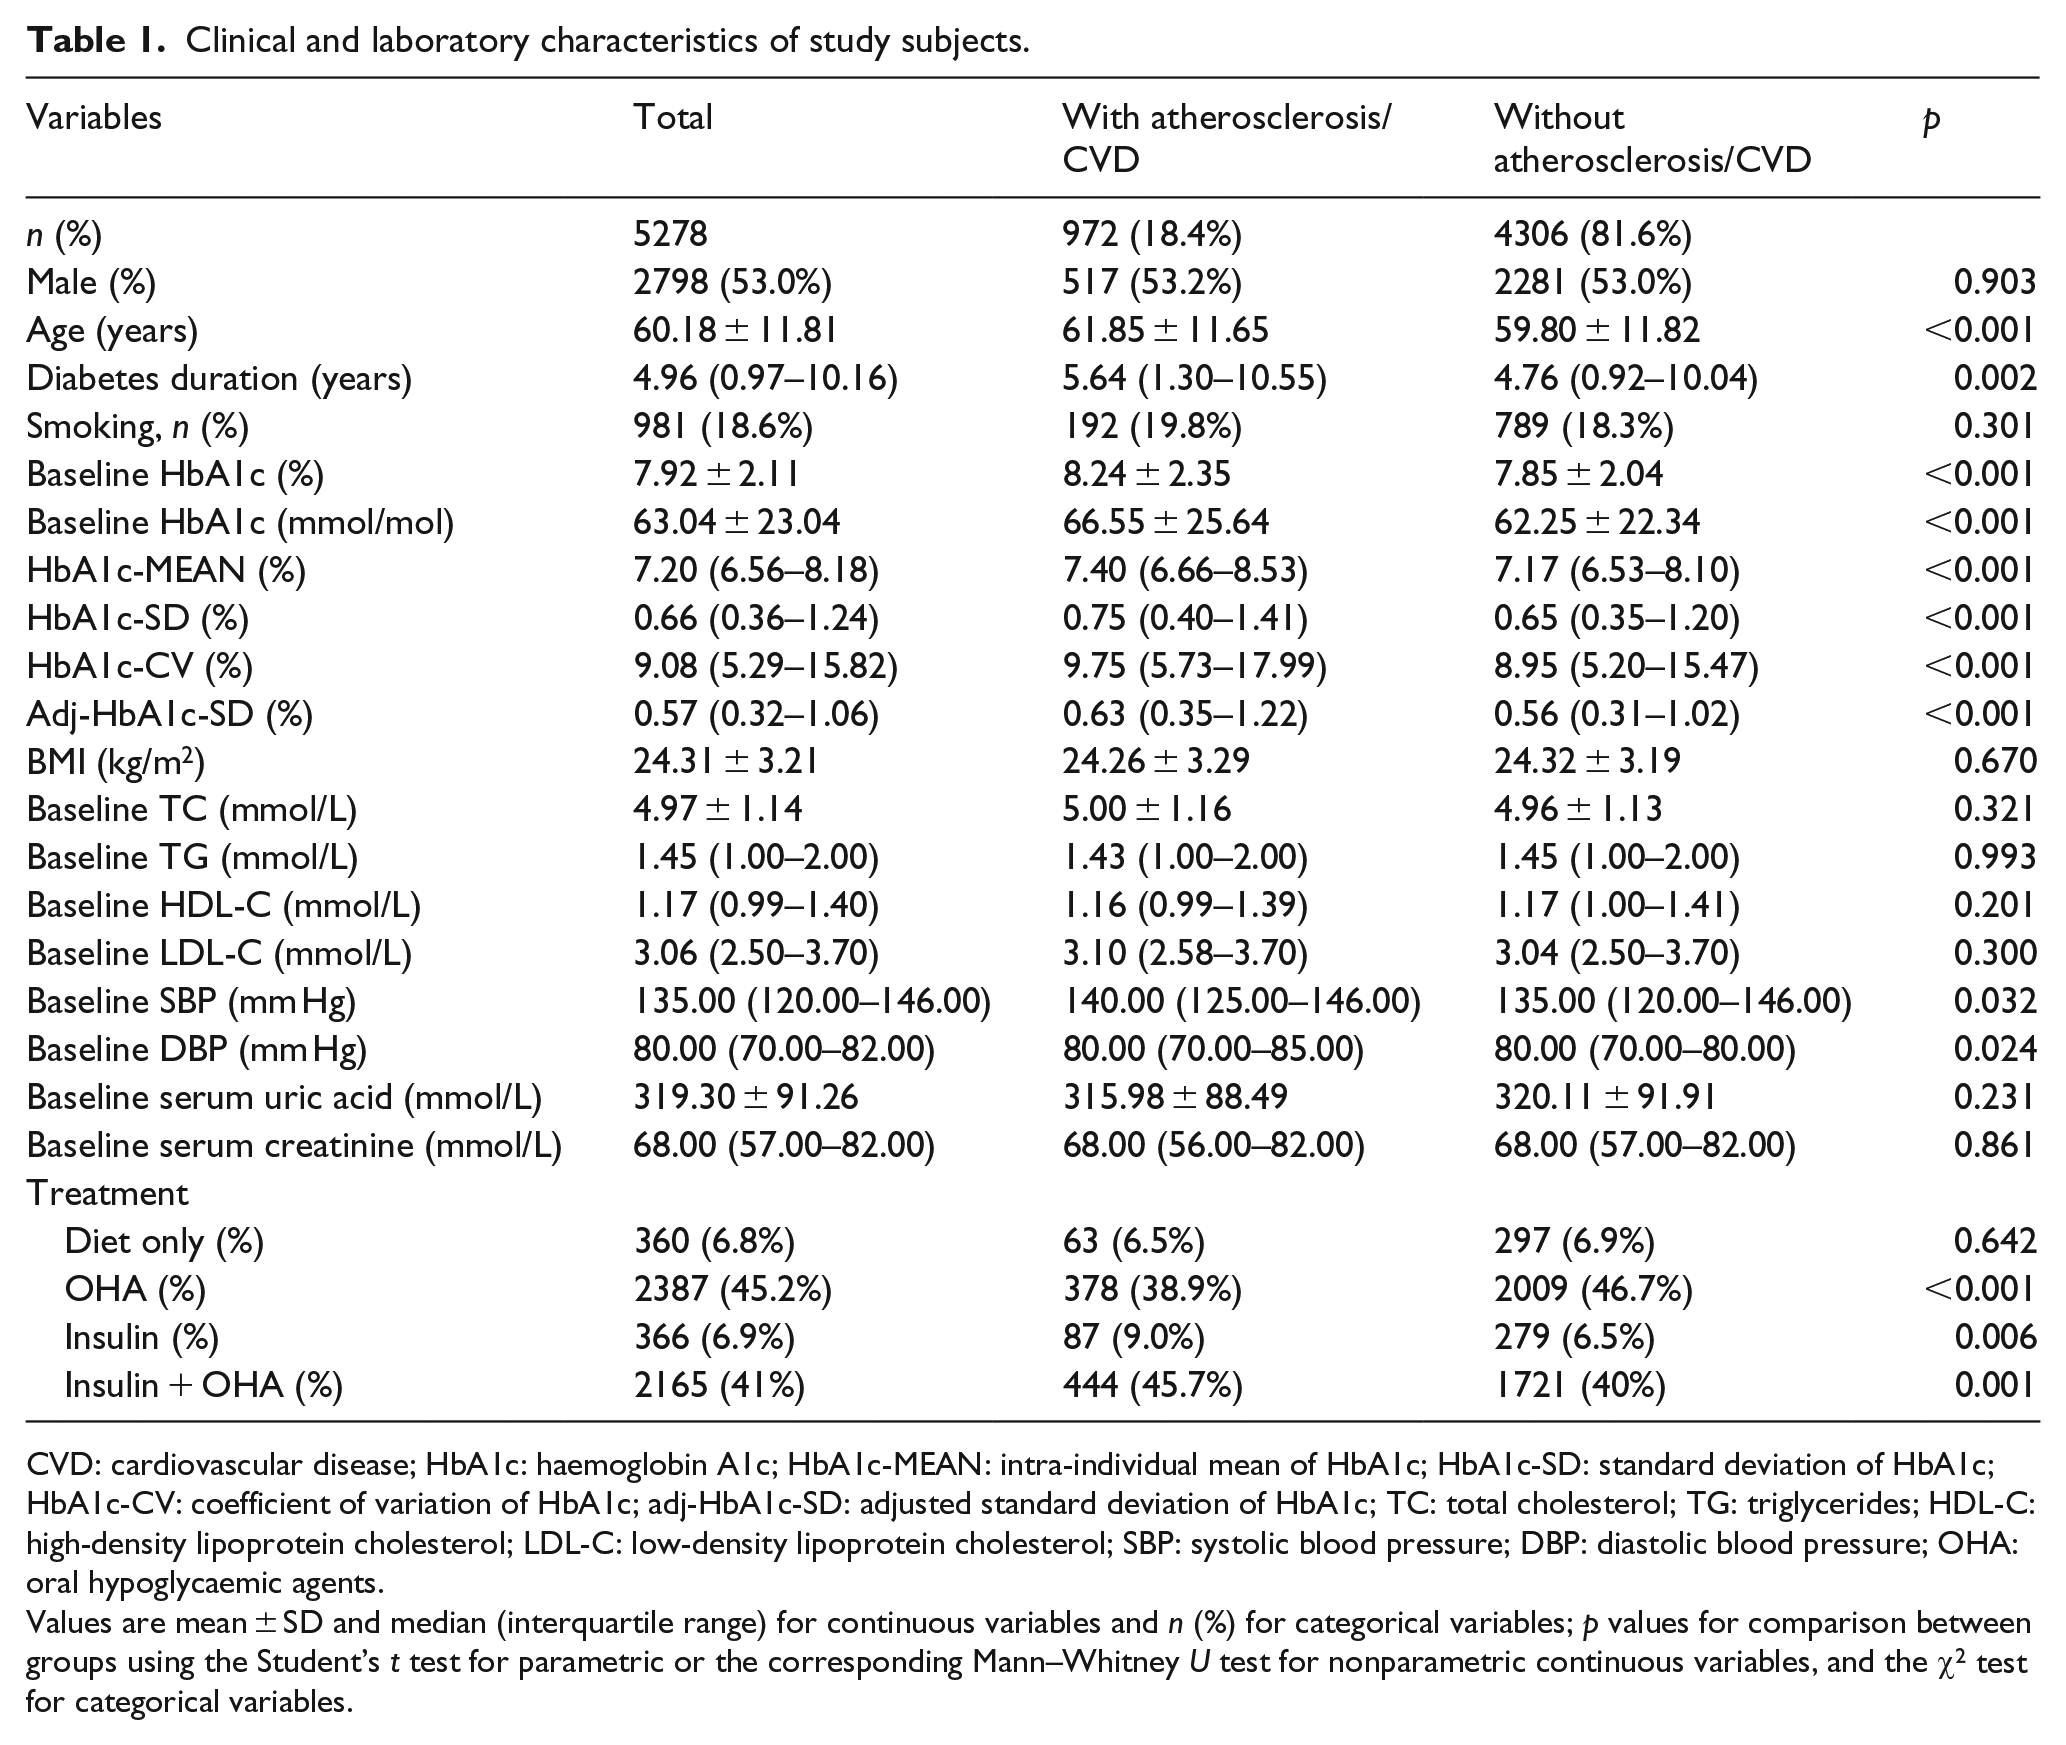
CVD: cardiovascular disease; HbA1c: haemoglobin A1c; HbA1c-MEAN: intra-individual mean of HbA1c; HbA1c-SD: standard deviation of HbA1c; HbA1c-CV: coefficient of variation of HbA1c; adj-HbA1c-SD: adjusted standard deviation of HbA1c; TC: total cholesterol; TG: triglycerides; HDL-C: high-density lipoprotein cholesterol; LDL-C: low-density lipoprotein cholesterol; SBP: systolic blood pressure; DBP: diastolic blood pressure; OHA: oral hypoglycaemic agents.
Values are mean ± SD and median (interquartile range) for continuous variables and n (%) for categorical variables; p values for comparison between groups using the Student’s t test for parametric or the corresponding Mann–Whitney U test for nonparametric continuous variables, and the χ2 test for categorical variables.
Comparison of HbA1c-MEAN and HbA1c variability
Men showed significantly higher values of HbA1c-SD [0.69% (0.37–1.31) vs 0.63% (0.35–1.15), p = 0.001], HbA1c-CV [9.39% (5.46–16.84) vs 8.80% (5.14–14.83), p < 0.001] and adj-HbA1c-SD [0.59% (0.33–1.12) vs 0.55% (0.30–0.98), p = 0.001] than women, but there was no gender difference in the HbA1c-MEAN [7.23% (6.55–8.23) vs 7.18% (6.56–8.13), p = 0.338].
When stratified by the presence or absence of atherosclerosis/CVD, the HbA1c-MEAN and all three HbA1c variability parameters were significantly higher in patients with atherosclerosis/CVD than in those without atherosclerosis/CVD (all, p < 0.001). The median and IQR HbA1c-MEAN values were 7.40% (6.6–8.53) and 7.17% (6.53–8.10) for the two groups, respectively, and the median and IQR HbA1c-SD values were 0.75% (0.40–1.41) and 0.65% (0.35–1.20), respectively. Similarly, the HbA1c-CV values were 9.75% (5.73–17.99) and 8.95% (5.20–15.47), respectively and the adj-HbA1c-SD values were 0.63% (0.35–1.22) and 0.56% (0.31–1.02) (Table 1).
Next, we compared HbA1c variability measurements in patients with only atherosclerosis on ultrasound and patients with prevalent CVD events. Among the 972 patients with CVD or atherosclerosis, 488 patients were without prevalent CVD but had only atherosclerosis by ultrasound and 484 had evident CVD events. Among the 488 patients with atherosclerosis on ultrasound, 69 had only carotid atherosclerosis, 234 had only lower limb atherosclerosis and 185 had both carotid and lower limb atherosclerosis.
As shown in Table 2, compared with those without atherosclerosis/CVD, patients with only atherosclerosis on ultrasound had significantly higher HbA1c-MEAN, HbA1c-SD, HbA1c-CV and adj-HbA1c-SD values (all p < 0.001). However, in patients with prevalent CVD events, only HbA1c-MEAN was significantly higher than that of patients without atherosclerosis/CVD (p = 0.004). HbA1c-SD, HbA1c-CV and adj-HbA1c-SD were numerically higher, although the differences were not statistically significant.
Comparison of HbA1c-MEAN and HbA1c variability in patients with prevalent CVD and atherosclerosis on ultrasound.
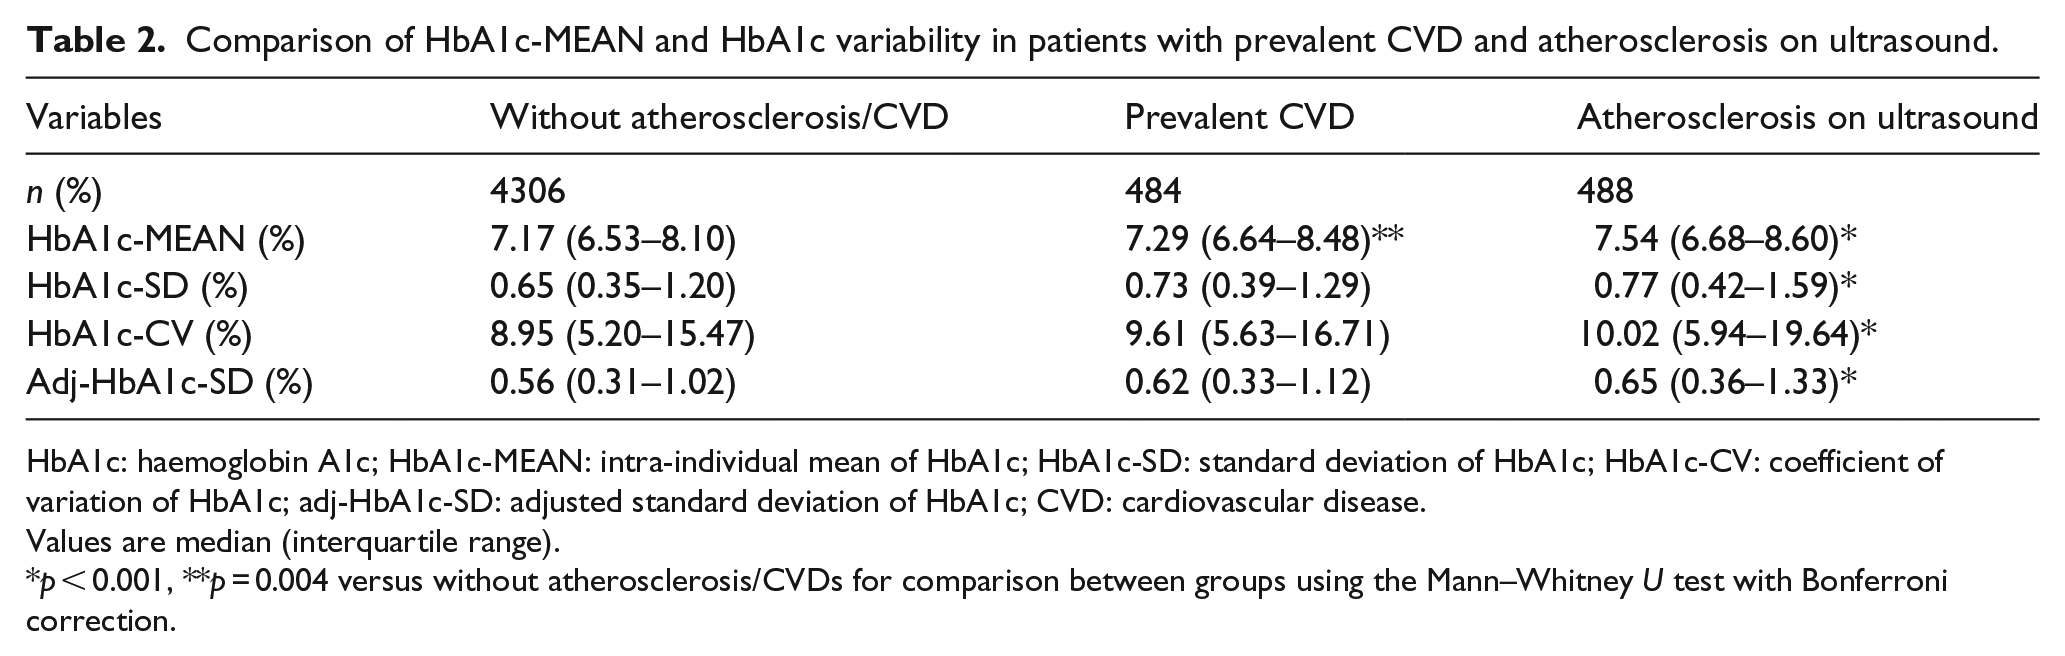
HbA1c: haemoglobin A1c; HbA1c-MEAN: intra-individual mean of HbA1c; HbA1c-SD: standard deviation of HbA1c; HbA1c-CV: coefficient of variation of HbA1c; adj-HbA1c-SD: adjusted standard deviation of HbA1c; CVD: cardiovascular disease.
Values are median (interquartile range).
p < 0.001, **p = 0.004 versus without atherosclerosis/CVDs for comparison between groups using the Mann–Whitney U test with Bonferroni correction.
Correlation of HbA1c variability and CVD
Logistic regression analyses were conducted to assess whether increments in HbA1c-MEAN (Model 1), increments of HbA1c-MEAN and HbA1c-CV (Model 2), increments of HbA1c-MEAN and adj-HbA1c-SD (Model 3), increments of HbA1c-MEAN and HbA1c-SD (Model 4) are independent correlates of atherosclerosis/CVD complications. Covariates were age at enrollment, sex, diabetes duration, BMI, smoking status, baseline TC, TG, HDL-C, LDL-C, systolic blood pressure, diastolic blood pressure, follow-up time, the number of HbA1c measurements and therapy regimen (Table 3).
Logistic stepwise regression analysis of independent correlates between HbA1c variability and atherosclerosis/CVD.
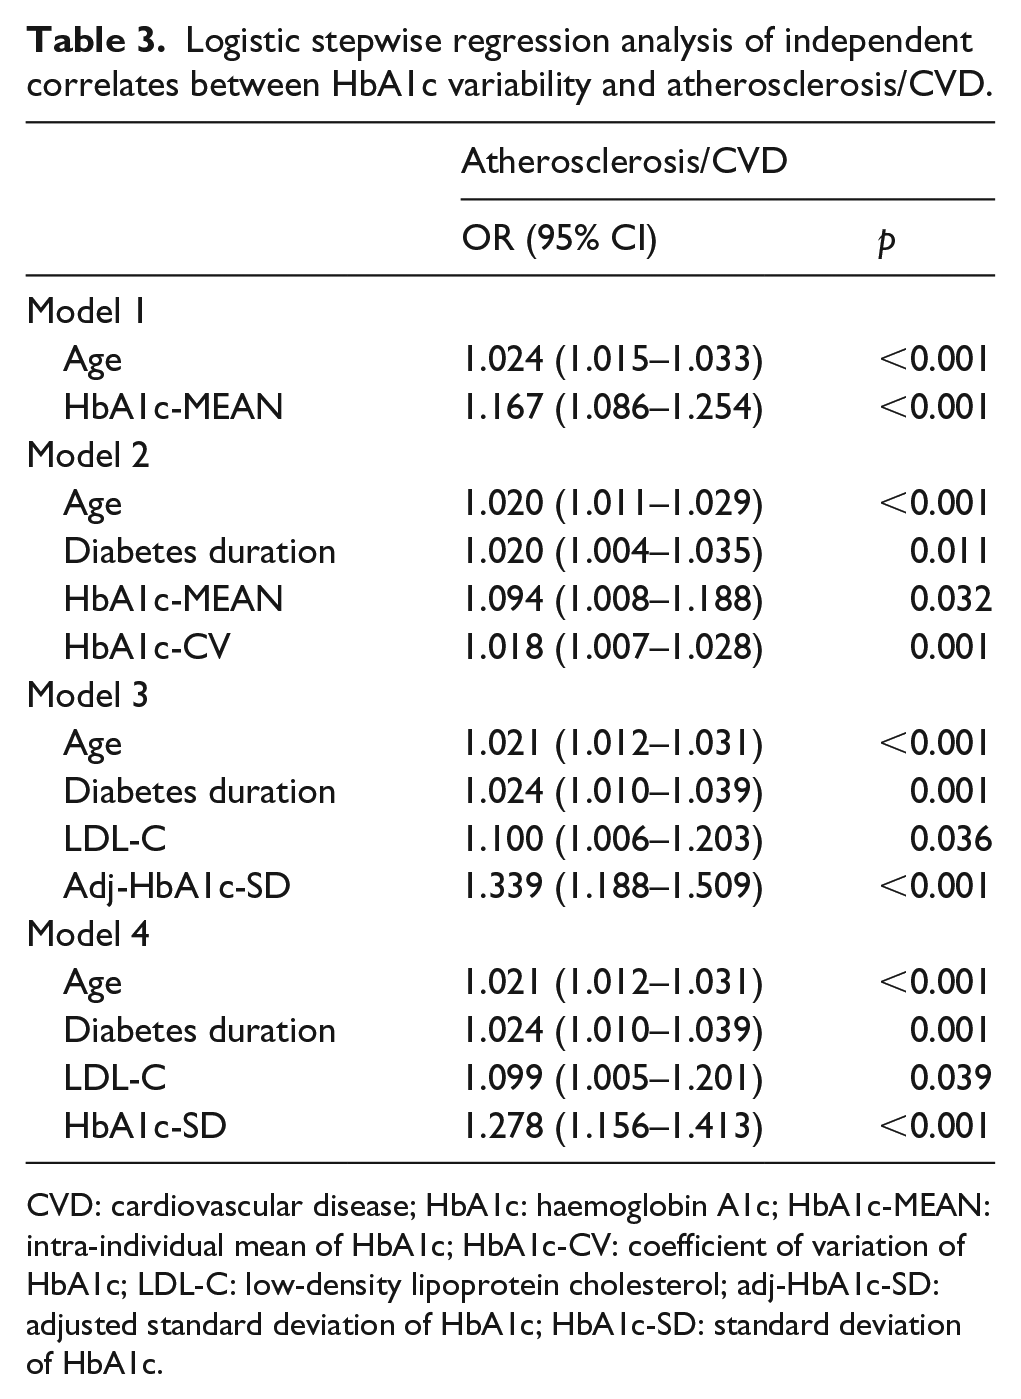
CVD: cardiovascular disease; HbA1c: haemoglobin A1c; HbA1c-MEAN: intra-individual mean of HbA1c; HbA1c-CV: coefficient of variation of HbA1c; LDL-C: low-density lipoprotein cholesterol; adj-HbA1c-SD: adjusted standard deviation of HbA1c; HbA1c-SD: standard deviation of HbA1c.
Model 1 showed that older age (OR = 1.024, 95% CI: 1.015–1.033, p < 0.001) and higher HbA1c-MEAN (OR = 1.167, 95% CI: 1.086–1.254, p < 0.001) were risk factors for any atherosclerosis/CVD. Model 2 showed that HbA1c-MEAN and HbA1c-CV were independent risk factors, the ORs for HbA1c-MEAN and HbA1c-CV were 1.094 (1.008–1.188) and 1.018 (1.007–1.028), respectively. Model 3 showed that adj-HbA1c-SD (OR = 1.339, 95% CI: 1.188–1.509, p < 0.001), instead of HbA1c-MEAN, was among the independent factors. Model 4 showed that HbA1c-SD (OR = 1.278, 95% CI: 1.156–1.413, p < 0.001), together with older age, longer diabetes duration and elevated LDL-C were risk factors for atherosclerosis/CVD, and HbA1c-MEAN was not included into the final regression model.
Discussion
The results of the present study revealed that HbA1c variability, as assessed by three indicators, was higher in patients who had atherosclerosis/CVD than in those without atherosclerosis/CVD. Multivariable logistic regression analysis showed that each index of HbA1c variability correlated with atherosclerosis/CVD. Moreover, significantly increased HbA1c variability was observed in patients with only atherosclerosis but no evident CVD, suggesting that increased HbA1c variability may be associated with macrovascular complication in early stage.
CVD is the most common underlying cause of death in diabetes patients. Type 2 diabetes patients usually present with two kinds of dysglycemia, chronic hyperglycemia and excessive glycemic variability. Previous research investigating glucose variability mostly focused on short-term fluctuations in glycemia, such as postprandial hyperglycemia. Conversely, HbA1c variability relates to changes in glycemia over longer periods of time, which corresponds to differences in HbA1c levels from one visit to the next. In type 2 diabetes, HbA1c variability has been found to be associated with microvascular diseases.13–15 However, data are less conclusive with respect to the association of HbA1c variability with macrovascular disease. Hirakawa et al. 8 assessed the effects of visit-to-visit variability in HbA1c and fasting glucose on major outcomes in the ADVANCE trial and found that an increase in HbA1c-SD was associated with an increased risk of vascular events and mortality: highest versus lowest tenth hazard ratio (95% CI) were 1.64 (1.05–2.55) and 3.31 (1.57–6.98), respectively. A prospective analysis of the Hong Kong Diabetes Registry showed that the HbA1c-SD predicted the development of cardiovascular complications in 8439 subjects. 9 In a Japanese observational cohort study, Bouchi et al. 16 observed an increased incidence of CVD in patients with higher variation in HbA1c-SD. Recently, Prentice et al. 17 carried out a retrospective cohort study in veterans with type 2 diabetes and concluded that all HbA1c variability measures significantly predicted adverse outcomes. In the present study, we also found that higher HbA1c variability was associated with the presence of atherosclerosis/CVD. In contrast, a cross-sectional analysis of the RIACE study revealed that HbA1c variability did not have a major impact on macrovascular complications. 10 The discrepancy between these previous reports might be explained by differences in study design (prospective study vs cross-sectional study) and differing degrees of HbA1c variability, baseline HbA1c levels or ethnicity. Also, HbA1c variability was defined inconsistently among the studies. More specifically, in our study, the HbA1c-SD values were 0.65 and 0.75 in patients without and with CVD, respectively, versus 0.47 and 0.46 in the RIACE cohort for these groups. The much lower HbA1c variability observed in the RIACE cohort could explain the discrepancy between our results and theirs. It can be hypothesized that the contribution of small changes in HbA1c values from one visit to the next is negligible and that the impact of the average HbA1c is predominant under these conditions.
Short-term glucose fluctuation has been shown to cause overproduction of superoxide, oxidative stress generation, epigenetic changes and macrophage adhesion to endothelial cells, which are all involved in the progression of atherosclerosis.18–21 However, atherosclerosis development is a long-term process that may occur from a young age and progress throughout a person’s lifetime. As a long-term index, HbA1c variability likely reflects different pathological processes from that of the short-term glycemic variability. In our study, significant higher HbA1c-SD, HbA1c-CV and adj-HbA1c-SD were noted between patients without atherosclerosis/CVD and those with only atherosclerosis on ultrasound. Also, higher HbA1c variability parameters were noticed between those without atherosclerosis/CVD and those with prevalent CVD although the differences were not statistically significant. This finding suggested that HbA1c variability might be involved in the relative early stage of atherosclerosis development, possibly before a CVD event has occurred.
This coincides with our previous finding that short-term glycemic variability (standard deviation of measured glucose by a continuous glucose monitoring system) was related to subclinical atherosclerosis before the atherosclerotic plaque was formed, and conventional risk factors such as age, hypertension, dyslipidemia and chronic hyperglycemia were important independent predictive factors for atherosclerotic plaque formation rather than glycemic variability. 22 The results of the present study are also supported by the study of Yang et al., 23 who found a strong association between HbA1c variability and the presence of subclinical coronary atherosclerosis among patients with diabetes duration less than 10 years, but not in those with a longer duration of diabetes. The underlying mechanism is complicated and has not been fully understood. Chang et al. 24 found that the level of oxidative stress marker, 8-iso-PGF2α was significantly correlated with HbA1c-SD, which partially described the detrimental effect of HbA1c variability. Also, the ‘metabolic memory’ phenomenon is among the possible mechanisms.25–26 Although the detailed underlying mechanism can only be speculated and cannot be determined in this observational study, our findings suggest the importance of long-term stabilization of blood glucose especially in those with early-stage atherosclerosis.
Currently, there is no standardized method for assessing HbA1c variability. In the systematic analysis by Gorst et al., 13 the authors suggested that greater HbA1c variability, irrespective of the definition used, is associated with adverse outcomes for several micro- and macrovascular endpoints and mortality. In this study, we used HbA1c-SD, adj-HbA1c-SD and HbA1c-CV as indices of HbA1c variability. When HbA1c-CV was entered in the logistic regression model, HbA1c-CV and HbA1c-MEAN were both found to be associated with atherosclerosis/CVD. And when HbA1c-SD was entered in the model, it was found to be associated with atherosclerosis/CVD independently of HbA1c-MEAN. Both SD and CV are measures of variability. SD measures how much values differ from the group mean, and CV is the ratio of the SD to the mean and thus a measure independent of the mean. CV may be more appropriate as an indicator of variability, since the variability is likely to increase as the mean increases. But HbA1c variability represents long-term glucose variability, and the notion of HbA1c variability itself is complicated and multifaceted. Although no standardized index has been regarded as the best parameter measuring HbA1c variability, our study showed that both HbA1c-CV and HbA1c-SD were independently correlated with atherosclerosis/CVD.
Several limitations of the present study must be mentioned. The major limitation was that the exact onset time of patients’ CVD events were missed in our study. Prevalent CVD events were re-evaluated from the medical history at the end date of the study. The cross-sectional design of the study did not allow for the interpretation of cause-and-effect relations. Second, all enrolled patients were Chinese, and it is uncertain whether our findings can be generalized to other ethnic groups. Third, the number and frequency of HbA1c measurements varied between individual patients. To minimize the influence of the number of HbA1c measurements on the results, we used the SD of serially measured HbA1c levels adjusted by the number of measurements (adj-HbA1c-SD). Fourth, the lack of data on the use of medications such as aspirin, statins and antihypertensive drugs is among the limitations. Moreover, changes in anti-diabetic medications during follow-up, especially initiating insulin or adjusting insulin dosages were not recorded. Further prospective researches are needed to study the possible cause-and-effect relations between HbA1c variability and macrovascular disease and to explore whether HbA1c variability could be a valuable therapeutic target.
In conclusion, HbA1c variability is found to be associated with macrovascular complication in type 2 diabetes in China. Therefore, long-term stabilization of blood glucose levels might be important in providing further protection against future development of macrovascular complications in type 2 diabetes. Our next work will be to establish whether reducing HbA1c variability, independently of mean HbA1c, can reduce the risk of macrovascular complications. If successful, the attractiveness of this approach is that it may allow diabetes patients to better avoid vascular disease.
Footnotes
Acknowledgements
Yifei Mo and Jian Zhou contributed equally to this work. We would like to thank all the involved clinicians, nurses and technicians for their dedication to the study.
Declaration of conflicting interests
The author(s) declared no potential conflicts of interest with respect to the research, authorship and/or publication of this article.
Funding
This work was supported by the National Natural Science Foundation of China (81400809); the Shanghai Municipal Education Commission – Gaofeng Clinical Medicine Grant Support (20161430); the Shanghai Municipal Science and Technology Commission Medical Guide Project (15411963500), Shanghai Training and Support Program for Young Physician (SHHR2012105) and the innovation foundation of translational medicine of Shanghai Jiao Tong University School of Medicine and Shanghai SJTUSM Biobank (15ZH4006). The funders had no role in study design, data collection and analysis, decision to publish or preparation of the manuscript.