
Abstract
Background:
The aim of this study was to investigate the association between the serum cystatin C level and cardiovascular disease risk in patients with type 2 diabetes mellitus.
Methods:
We studied 523 patients with type 2 diabetes mellitus and calculated estimated 10-year risk of atherosclerotic cardiovascular disease (%). Subclinical atherosclerosis was defined as brachial-ankle pulse wave velocity ⩾1700 ms, indicating the presence of arterial stiffness.
Results:
Cystatin C level was significantly higher in the subclinical atherosclerosis group (brachial-ankle pulse wave velocity ⩾ 1700 ms) than in the non-subclinical atherosclerosis group (brachial-ankle pulse wave velocity < 1700 ms) (7.54 ± 3.15 mg/L vs 10.04 ± 5.12 mg/L, p < 0.001). Subclinical atherosclerosis was mainly determined by age, duration of diabetes and cystatin C level, but not by serum creatinine, 10-year risk of atherosclerotic cardiovascular disease score and estimated glomerular filtration rate in the multiple linear regression analysis. In addition, an increase in cystatin C level was independently associated with the risk of subclinical atherosclerosis after adjusting for age, sex, duration of diabetes, smoking, hypertension, 10-year risk of atherosclerotic cardiovascular disease risk score, serum creatinine level, total cholesterol, high-density lipoprotein cholesterol and haemoglobin A1c (odds ratio = 1.200, 95% confidence interval: 1.04–1.38, p = 0.011).
Conclusion:
Serum cystatin C level was significantly associated with subclinical atherosclerosis. This result suggests that an increase in cystatin C level could be a valuable surrogate marker for the risk of cardiovascular disease in patients with type 2 diabetes mellitus.
Background
Globally, the incidence of diabetes has rapidly increased in recent years, and according to the International Diabetes Federation 1 in 2015, it is substantially increasing in the West Pacific region, including Korea. The high mortality risk associated with diabetes is attributed to its related complications and not to the disease itself, commonly resulting in cardiovascular disease (CVD). 2 As diabetes has been defined as the risk equivalent of coronary heart disease (CHD), 3 the need for early detection of CHD in patients with diabetes has increased. Atherosclerosis is one of the major causes of CVD, and several non-invasive tests have been used for evaluating atherosclerosis in clinical practice. Among these tests, arterial stiffness measured using pulse wave velocity (PWV) was reported as a good predictor of the occurrence of CVD in general population and patients with hypertension or chronic kidney disease. 4
It is widely accepted that surrogate markers of microvascular complications are closely related to the risk of macrovascular complications in people of diabetes. 5 For example, microalbuminuria is not only an early marker of reduced renal function6,7 but also surrogate of CVD risk, as it indicates malfunction of the endothelial cells. 8 Previous study reported albuminuria could be a marker of cardiovascular complication in patients with essential hypertension. 9 However, one limitation of microalbuminuria is its susceptibility to elevation by external factors such as intense exercise, dehydration, fever or inflammation.
Meanwhile, serum cystatin C, a cysteine-protease inhibitor which is produced in all nucleated cells in humans, is reported to reflect renal function more precisely than serum creatinine (sCr) due to its small molecular size, which is able to freely cross the glomerular filtration barrier. 10 Cystatin C represents renal function more reliably than sCr because it is less affected by external factors such as gender, race and muscle mass. 11 In addition, serum cystatin C can predict arterial sclerosis earlier than sCr. 12 Recently, a significant correlation between serum cystatin C level and arterial stiffness in a group of individuals with normal or slight decline in renal function has been reported. 13 However, the relationship between serum cystatin C and arterial stiffness is not well known in people with diabetes. Thus, in this study, we investigated the relevance of arterial stiffness and serum cystatin C level in type 2 diabetes mellitus (T2DM) patients, as well as the usefulness of serum cystatin C in predicting atherosclerosis.
Patients and methods
Study population
This was a retrospective, cross-sectional study, which employed blinded data from the electronic medical records of patients with T2DM, who were examined for both brachial-ankle pulse wave velocity (baPWV) and serum cystatin C at Yeungnam University Hospital from 2014 to 2016. Subjects with the following were excluded: (1) other types of diabetes other than T2DM, (2) any history of cardiovascular and/or cerebrovascular disease, (3) anaemia (Hb ⩽ 8 g/dL), (4) jaundice (total bilirubin ⩾ 6 mg/dL), (5) hypertriglyceridaemia (⩾1000 mg/dL) and (6) insufficient laboratory results for initial enrolment. Duration of diabetes, as well as anthropometric parameters, such as individual body weight and height, were examined. Hypertension was defined as systolic blood pressure higher than 140 mmHg or diastolic blood pressure (DBP) higher than 90 mmHg, or as individuals on antihypertensive medication. All personal information of participants was blinded, and the study protocol was approved by the Institutional Review Board of local committee.
Clinical and laboratory assays
Blood samples for laboratory assays were obtained from each participant after 8-h overnight fast. Serum cystatin C was measured using Gentian Cystatin C immunoassay (Gentian AS, Moss, Norway; coefficients of variation (CV) 0.96%), and the CV was 0.96% at high concentration and 1.14% at low concentration. Measurement of fasting plasma glucose, aspartate aminotransferase (AST), alanine aminotransferase (ALT), γ-glutamyl transpeptidase (GGT), blood urea nitrogen (BUN) and sCr used AU 5800 AU analyzer (Beckman Coulter Inc., Brea, CA, USA). Total cholesterol (T-Chol) was measured using enzyme colorimetry (Kyowa Medex Co., Ltd., Tokyo, Japan), triglyceride (TG) was measured using the glycerol elimination method, and high-density lipoprotein cholesterol (HDL-C) and low-density lipoprotein cholesterol (LDL-C) were measured using direct enzymatic assays (Kyowa Medex Co., Ltd.). Glycated haemoglobin (HbA1c) and microalbuminuria assays were performed using the HLC-723G7 high-performance liquid chromatography system (Tosoh, Tokyo, Japan).
Estimated glomerular filtration rate (eGFR) was calculated by the chronic kidney disease epidemiology collaboration equation (CKD-EPI) formula of the National kidney foundation.14–16 Estimated 10-year cardiovascular risk score (10-year risk of atherosclerotic cardiovascular disease (10-year CV risk) score) was calculated using the heart risk calculator of 2013 ACC/AHA guideline on the assessment of cardiovascular risk 17 which includes age, gender, ethnicity, T-Chol, HDL-C, blood pressure and smoking.
Atherosclerosis determined by baPWV
Subclinical atherosclerosis (SA) was defined as mean of both baPWV higher than 1700 cm/s. 18 BaPWV of bilateral upper arm-ankle was measured by Vascular profiler 1000 (VP-1000, Omlon©, Japan), which also provides ankle-brachial index (ABI). Briefly, the examiner places pneumatic cuffs on each ankle and each upper arm to the participants in the supine position. The 2 ECG clips were applied to the inner aspect of each wrist, and phonocardiogram also used on the second intercostal space. The baPWV was calculated according to the following formula: baPWV = Lba/Tba, where Lba was the calculated length between sampling points of baPWV based on the height of the subject, and Tba was the time interval between the wave front of the brachial waveform and that of the ankle waveform. We calculated mean baPWV as (baPWV(rt) + baPWV(lt))/2 measured at right (baPWV(rt)) and left (baPWV(lt)) sides, respectively.
Statistical analysis
Data are expressed as mean ± standard deviation (SD). The student’s t-test and χ2 test were used to compare the mean value between categorical groups. Pearson’s correlation analysis between baPWV and basic parameters of subjects was used. To identify which factors are significantly associated with baPWV, univariate linear analysis and multivariate linear analysis with stepwise method were performed. Several parameters known as risk factors for atherosclerosis, including age, duration of diabetes, serum cystatin C level, 10-years CV risk score, serum Cr level and eGFR using both cystatin C and creatinine-cystatin C, were examined. Logistic regression was conducted to measure the association between Cystatin C level as a risk factor and the prevalence of SA in patients with T2DM. p value under 0.05 was selected as a significant value in all statistical analysis. Statistical analyses were performed using the SPSS version 16.0 for Windows (IBM Co., Armonk, NY, USA).
Results
Among the 523 subjects with T2DM, individuals above 85 years (n = 4), or with anaemia (n = 2), jaundice (n = 6), hypertriglyceridaemia (n = 6) and inadequate laboratory results (n = 23) were excluded, resulting in 487 participants were of this study (Figure 1).
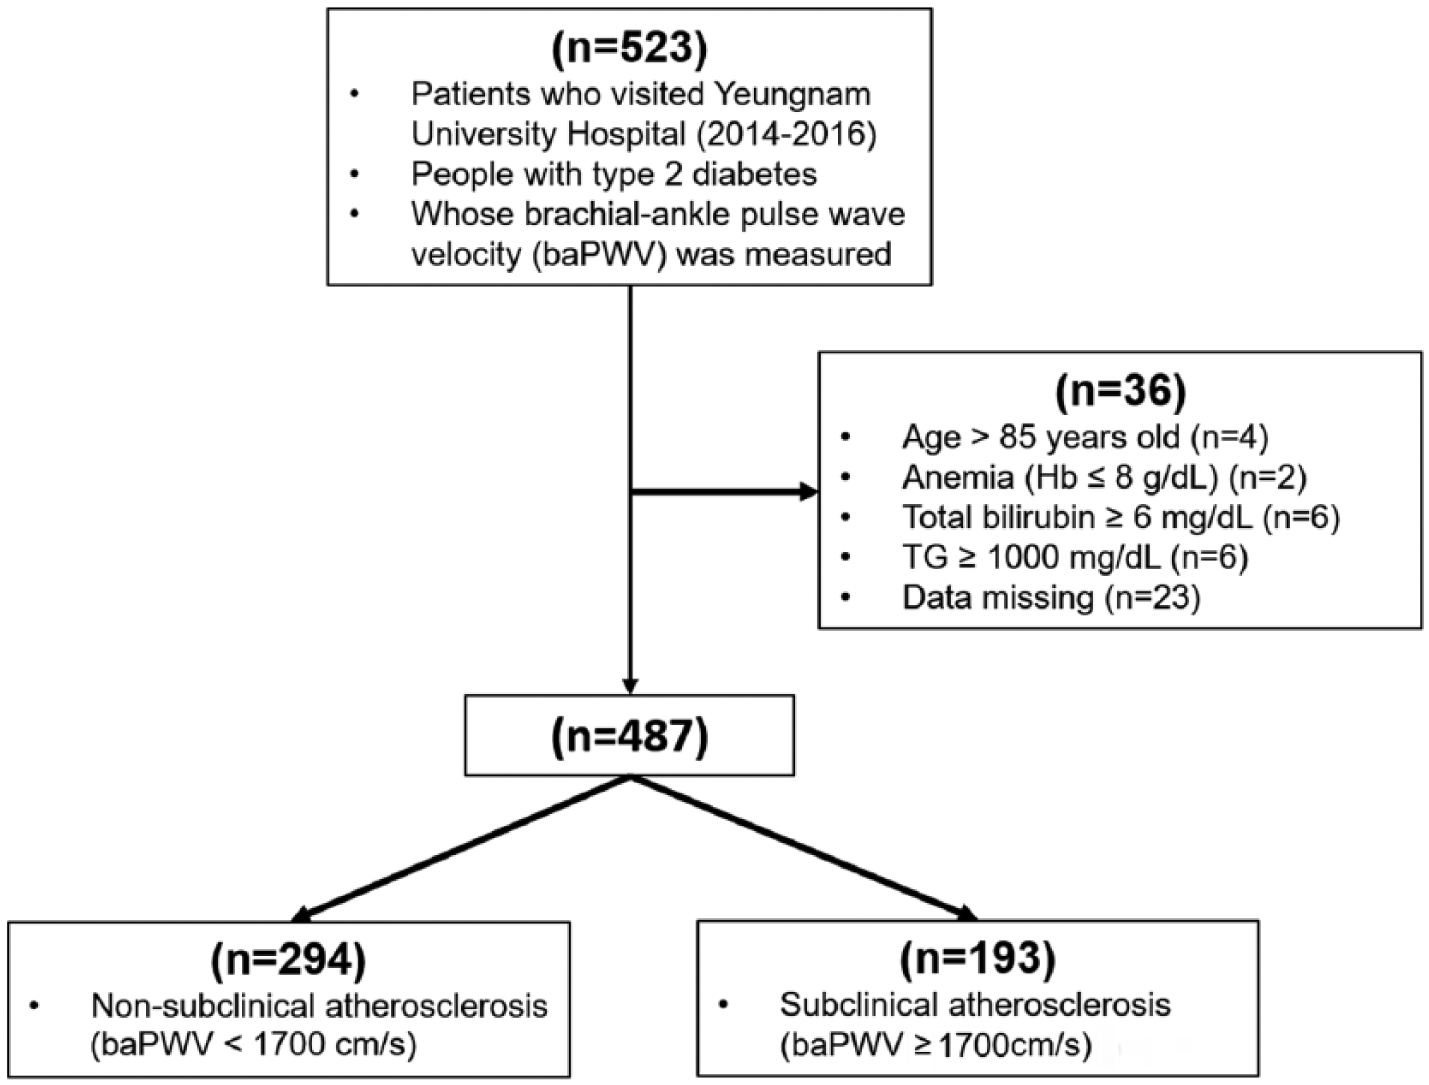
Flow chart of the numbers of patients enrolled.
Participants were classified as SA group (baPWV ⩾ 1700 cm/s, n = 193) and non-SA group (baPWV < 1700 cm/s, n = 294). Demographic and biochemical parameters of both groups were compared (Table 1). Age, duration of diabetes, number of hypertensive patients, sCr level, and cystatin C level were significantly higher in the SA group than in the non-SA group (p < 0.001, <0.001, <0.001, <0.001, <0.001, respectively). Estimated GFR using CKD-EPI cystatin C, CKD-EPI creatinine-cystatin C and T-Cho level were significantly lower in the SA group (p < 0.001, <0.001, 0.029, respectively). There was no difference in urine albumin-to-creatinine ratio (UACR) between two groups (p = 0.587).
Comparison of basic parameters between the non-SA and SA groups in all participants.
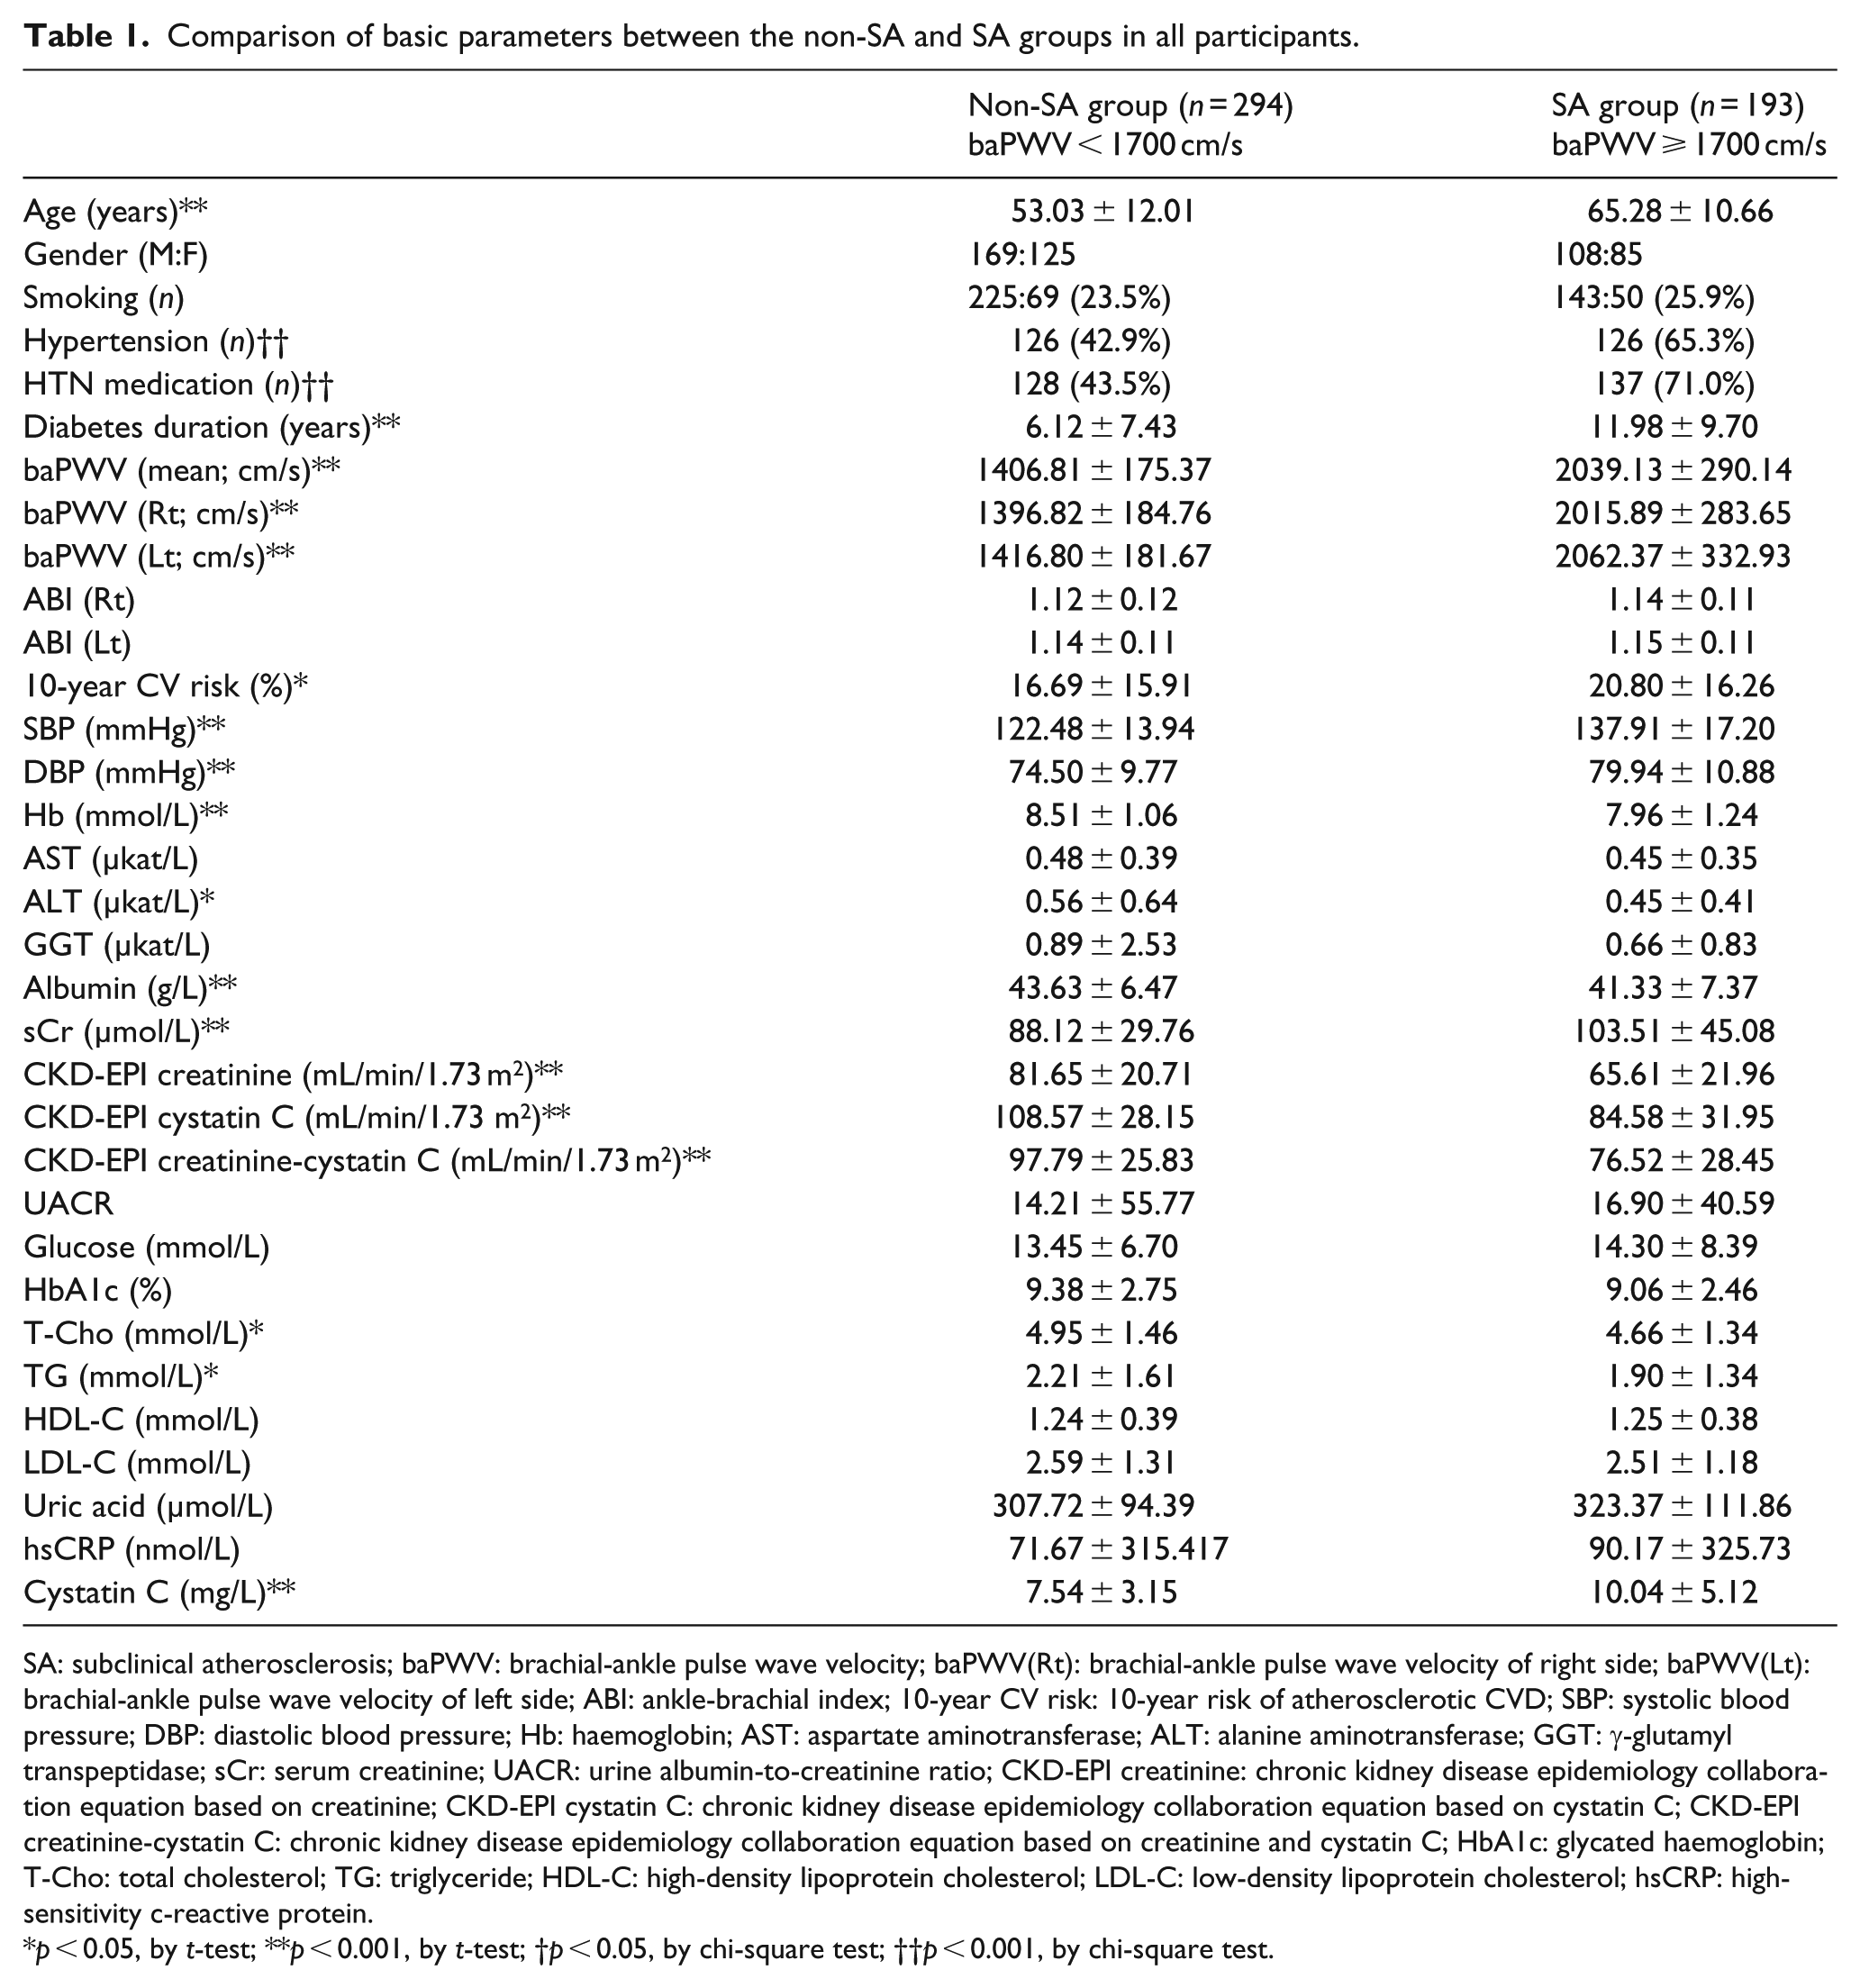
SA: subclinical atherosclerosis; baPWV: brachial-ankle pulse wave velocity; baPWV(Rt): brachial-ankle pulse wave velocity of right side; baPWV(Lt): brachial-ankle pulse wave velocity of left side; ABI: ankle-brachial index; 10-year CV risk: 10-year risk of atherosclerotic CVD; SBP: systolic blood pressure; DBP: diastolic blood pressure; Hb: haemoglobin; AST: aspartate aminotransferase; ALT: alanine aminotransferase; GGT: γ-glutamyl transpeptidase; sCr: serum creatinine; UACR: urine albumin-to-creatinine ratio; CKD-EPI creatinine: chronic kidney disease epidemiology collaboration equation based on creatinine; CKD-EPI cystatin C: chronic kidney disease epidemiology collaboration equation based on cystatin C; CKD-EPI creatinine-cystatin C: chronic kidney disease epidemiology collaboration equation based on creatinine and cystatin C; HbA1c: glycated haemoglobin; T-Cho: total cholesterol; TG: triglyceride; HDL-C: high-density lipoprotein cholesterol; LDL-C: low-density lipoprotein cholesterol; hsCRP: high-sensitivity c-reactive protein.
p < 0.05, by t-test; **p < 0.001, by t-test; †p < 0.05, by chi-square test; ††p < 0.001, by chi-square test.
The correlation between baPWV and various parameters was analysed in non-SA group and SA group, respectively, and summarized in Table 2. Age, duration of diabetes, serum cystatin C level, eGFR using both cystatin C and creatinine-cystatin C were significantly correlated with baPWV in both groups. 10-year CV risk score (r = 0.290, p < 0.001) and serum Cr level (r = 0.165, p = 0.022) had significant correlation with baPWV in SA group but not in non-SA group. UACR, hsCRP, T-Cho, LDL-C and HDL-C level had no correlation with baPWV in both groups.
Pearson’s correlation coefficients between basic parameters and baPWV of all participants.
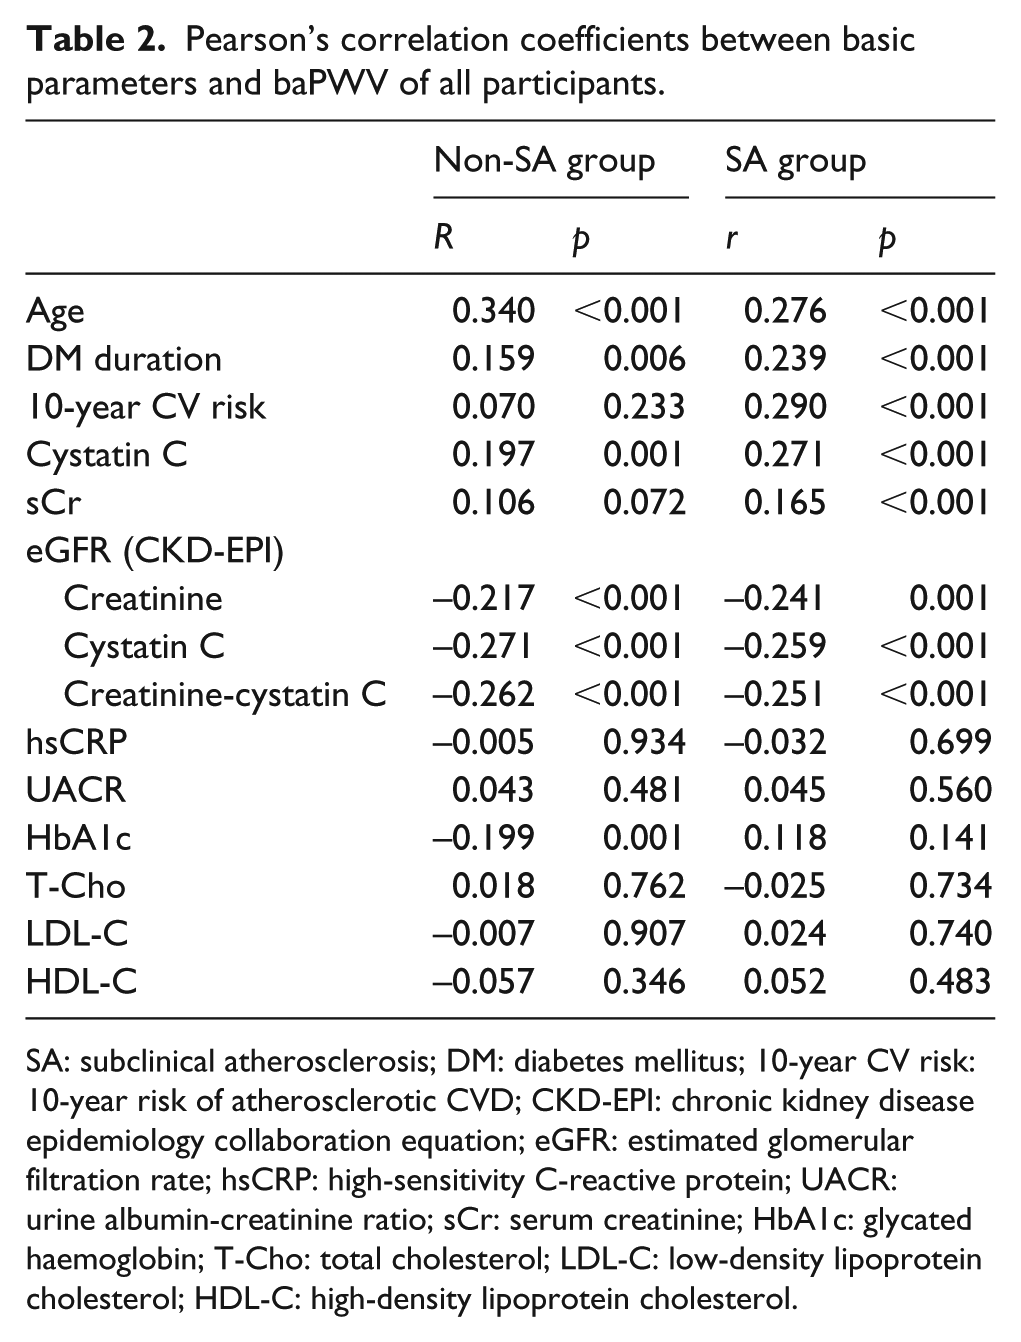
SA: subclinical atherosclerosis; DM: diabetes mellitus; 10-year CV risk: 10-year risk of atherosclerotic CVD; CKD-EPI: chronic kidney disease epidemiology collaboration equation; eGFR: estimated glomerular filtration rate; hsCRP: high-sensitivity C-reactive protein; UACR: urine albumin-creatinine ratio; sCr: serum creatinine; HbA1c: glycated haemoglobin; T-Cho: total cholesterol; LDL-C: low-density lipoprotein cholesterol; HDL-C: high-density lipoprotein cholesterol.
Univariate linear regression was used to analyse the factors that had significant association with baPWV based on the correlation analysis in all participants (Table 3). Age, duration of diabetes, 10-year CV risk score, serum cystatin C, sCr and eGFR were independently associated with baPWV, whereas hsCRP, UACR and HbA1c level were not. The multivariate linear regression with stepwise method was conducted to predict the baPWV of T2DM patients with the factors that were known to be related to atherosclerosis. The factors examined included age, duration of diabetes, cystatin C level, sCr level and eGFR (CKD-EPI creatinine-cystatin C). The multivariate analysis revealed that the cystatin C level (B = 0.155, p < 0.001), age (B = 0.409, p < 0.001) and duration of diabetes (B = 0.177, p < 0.001) were the only significant predictors of baPWV in T2DM patients among the factors. Interestingly, only cystatin C remained a significant factor associated with the atherosclerosis, while other factors reflecting renal function such as sCr, eGFR did not. In addition, 10-year CV risk score was also excluded in the final regression model. Thus, cystatin C was important surrogate of the risk of atherosclerosis as well as renal function in peoples with T2DM.
Univariate and multivariate linear regression analysis for predicting baPWV in T2DM patients.
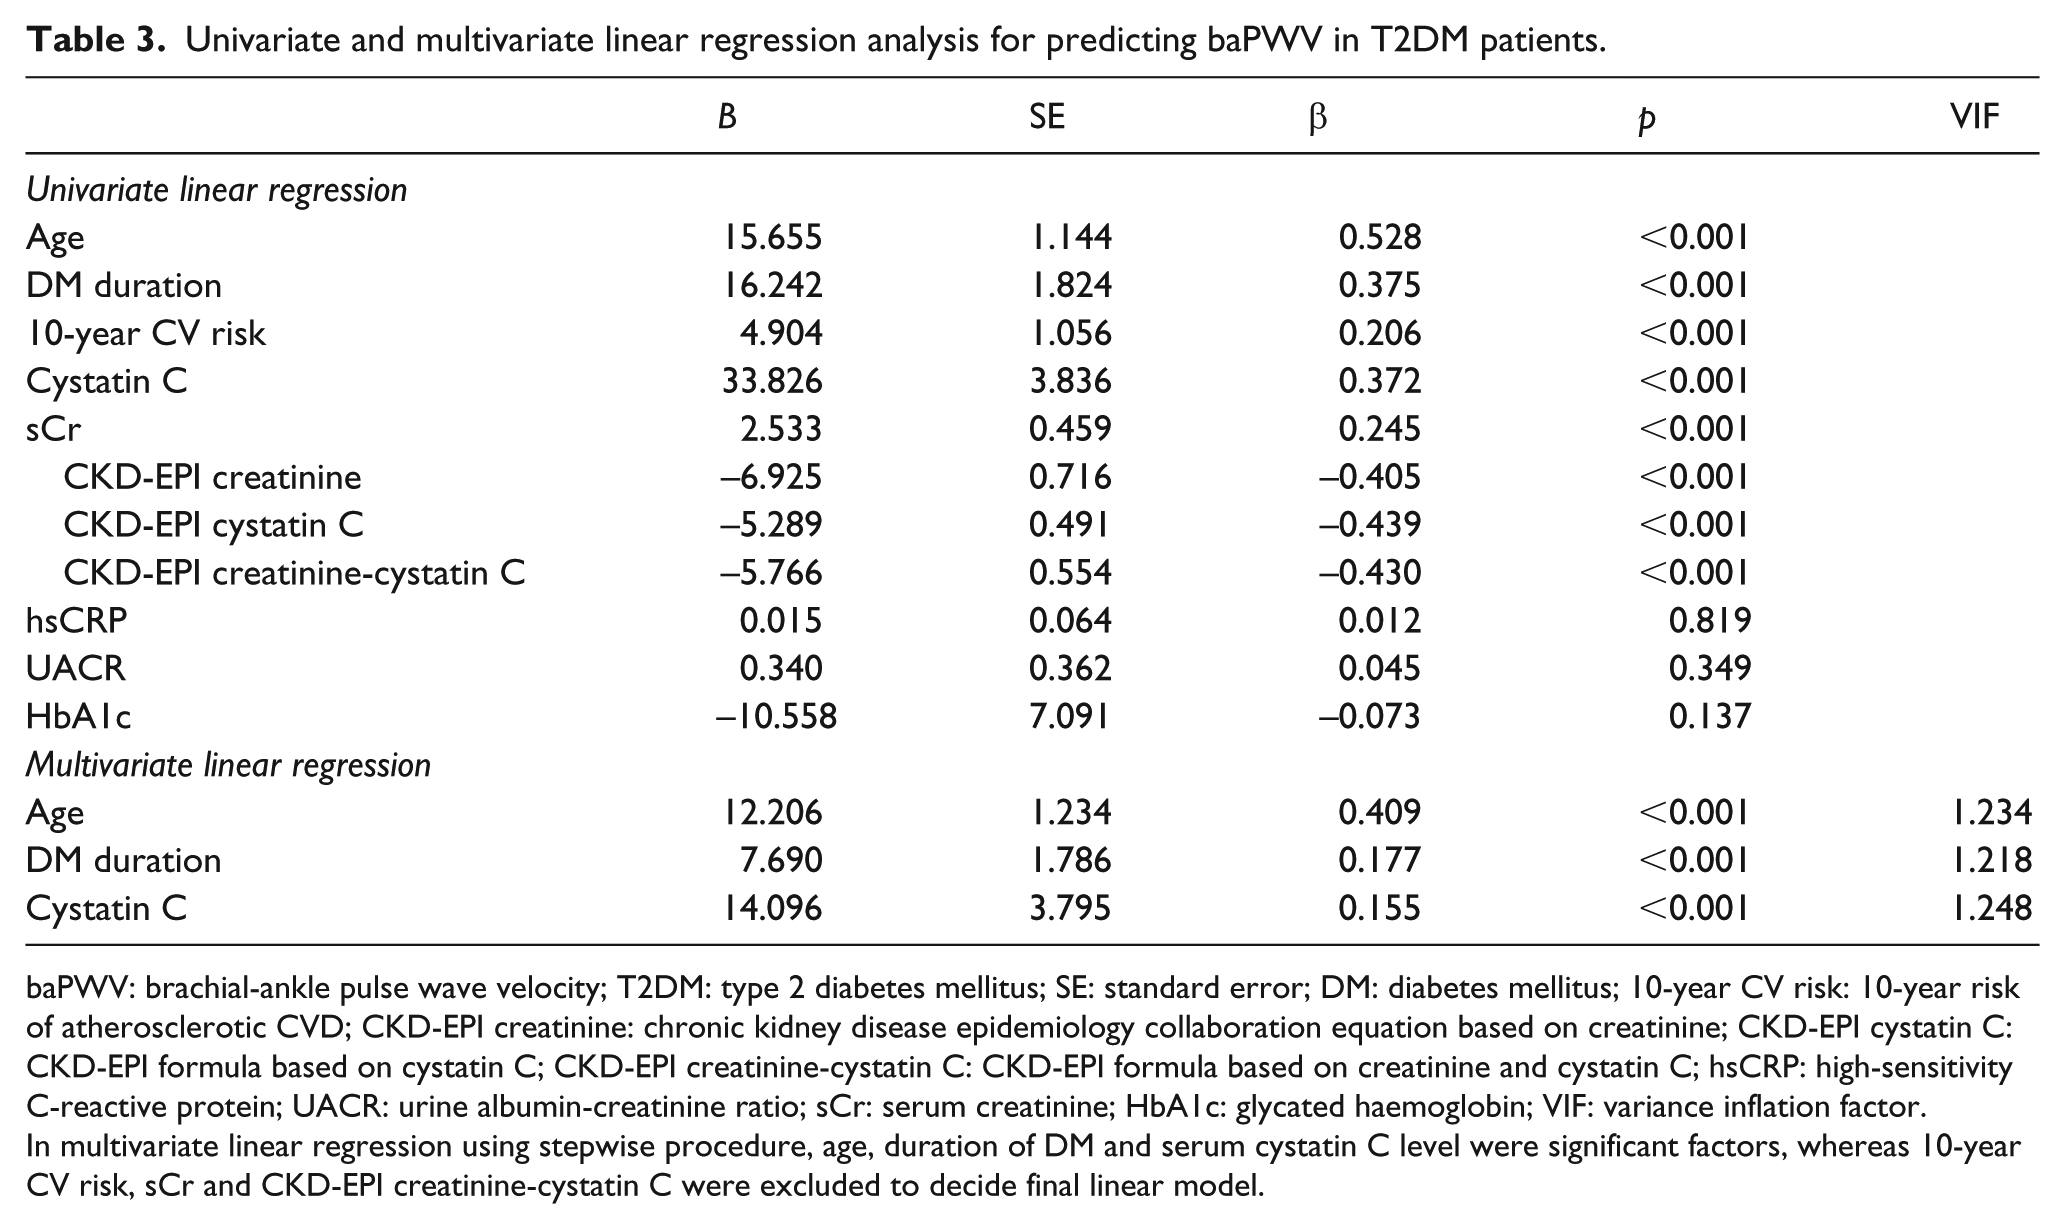
baPWV: brachial-ankle pulse wave velocity; T2DM: type 2 diabetes mellitus; SE: standard error; DM: diabetes mellitus; 10-year CV risk: 10-year risk of atherosclerotic CVD; CKD-EPI creatinine: chronic kidney disease epidemiology collaboration equation based on creatinine; CKD-EPI cystatin C: CKD-EPI formula based on cystatin C; CKD-EPI creatinine-cystatin C: CKD-EPI formula based on creatinine and cystatin C; hsCRP: high-sensitivity C-reactive protein; UACR: urine albumin-creatinine ratio; sCr: serum creatinine; HbA1c: glycated haemoglobin; VIF: variance inflation factor.
In multivariate linear regression using stepwise procedure, age, duration of DM and serum cystatin C level were significant factors, whereas 10-year CV risk, sCr and CKD-EPI creatinine-cystatin C were excluded to decide final linear model.
Logistic regression analysis was performed to determine the contribution of cystatin C to the risk of SA (Table 4). In crude analysis, cystatin C was associated with the SA (odds ratio (OR) = 1.184, 95% confidence interval (CI) 1.12–1.26, p < 0.001). Both sCr (OR = 1.012, 95% CI: 1.01–1.02, p < 0.001) and eGFR (OR = 0.966, 95% CI: 0.96–0.98, p < 0.001) were also contributed the risk of SA, but significances were not remained after adjustment with another risk factors. However, cystatin C was significantly associated with the risk of atherosclerosis adjusted by sex, age (Model 1, OR = 1.080, 95% CI: 1.02–1.15, p = 0.011). After adjusting for diabetes-related atherosclerotic risk factors (such as duration of diabetes, smoking, hypertension and 10-year CV risk score) and model 1, cystatin C level was found to contribute (Model 2, OR = 1.080, 95% CI: 1.01–1.16, p = 0.025) to arterial stiffness. Finally, cystatin C remained an independent risk factor that was associated with the risk of atherosclerosis after adjusting for HbA1c, sCr, T-Chol, HDL-C and HbA1c (Model 3, OR = 1.200, 95% CI: 1.04–1.38, p = 0.011).
Odds ratios (95% CI) for subclinical atherosclerosis according to cystatin C levels (mg/L).
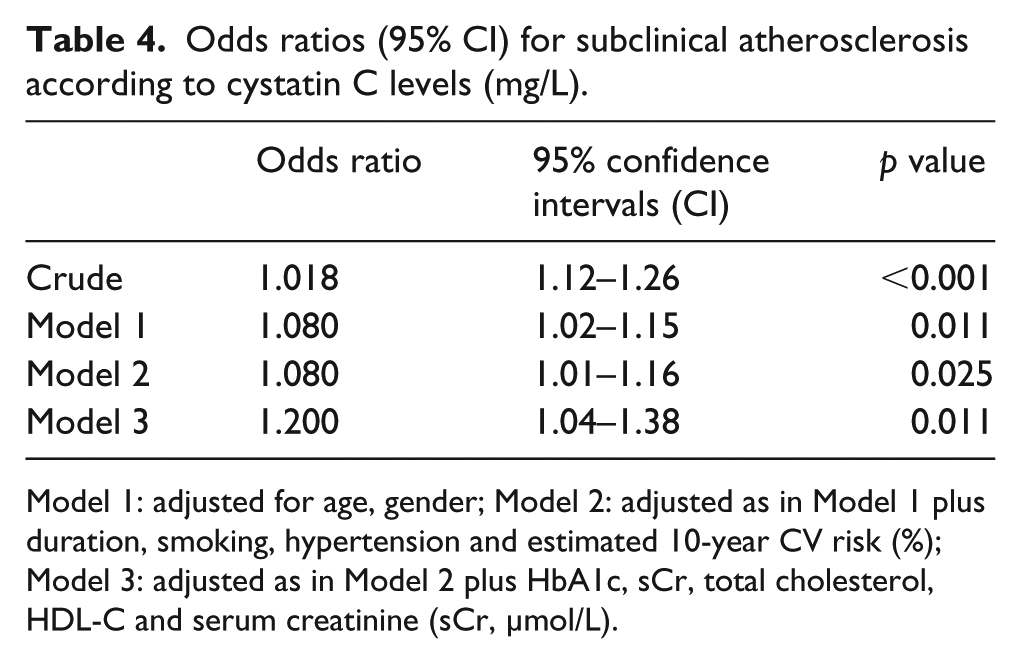
Model 1: adjusted for age, gender; Model 2: adjusted as in Model 1 plus duration, smoking, hypertension and estimated 10-year CV risk (%); Model 3: adjusted as in Model 2 plus HbA1c, sCr, total cholesterol, HDL-C and serum creatinine (sCr, µmol/L).
Discussion
In this study, we found that serum cystatin C is closely correlated with arterial stiffness, with its increment, indicating the risk for atherosclerosis in patients with T2DM. Cystatin C was more sensitive to SA than other renal function indicators such as sCr, GFR and microalbuminuria in people with diabetes were.
It is widely accepted that decreased renal function is a hallmark for increased CVD risk. 19 As a renal function marker, serum cystatin C could be a more precise indicator than sCr because it is less affected by other factors, thereby reflecting renal function much precisely in early stage of chronic kidney disease.12,20 Since cystatin C is more accurate for measurement of renal function, it will be a good indicator and will have a significant correlation to the CV risk prediction of diabetes patients.
It is reported that increased serum cystatin C, accompanied by a decline in renal function might be directly relevant in the stiffness of large to small arteries. 21 Furthermore, in patients with normal or mild kidney dysfunction serum cystatin C levels and arterial stiffness have been shown to be significantly related.6,8,22 As cystatin C reflects renal function more precisely, cystatin C might be a better maker for predicting SA, a pre-stage of the CVD occurrence. In addition, cystatin C has been reported as a better surrogate marker for predicting cardiovascular events. The US community-based cohort research conducted on old people showed that serum cystatin C had more predictable linear relationship with cardiovascular mortality than sCr. 23 Serum cystatin C had high correlation with morbidity from cardiovascular causes like myocardial infarction or stroke. 24
Albuminuria is established as a hallmark of diabetic kidney disease; therefore, its screening is for all people with diabetes. 25 In addition, it was also reported as a surrogate marker of CVD from a recent cohort study based on large data in China. 26 However, interestingly, our study was not consistent with others that reported that UACR had significant correlation with SA. This may be attributed to the susceptibility of UACR to non-diabetic-related external factors such as intense exercise, dehydration, fever, inflammation and even medication. Since proteinuria develops after kidney damage, with increased glomerular permeability, 27 the detection of atherosclerosis might be delayed even after occurrence of pathological changes at an early stage.
Measurement of baPWV is a non-invasive method, which can predict arterial stiffness with high relevance, by measuring the PWV of muscular artery. 28 PWV provides information about the function of blood vessels so that it can detect early alterations of peripheral arteries in diabetic patients.29,30 As the functional change of blood vessels precedes structural changes, PWV may play an important role in early diagnosis of SA. However, the controversy to define the cut-off value of baPWV for SA, owing to the lack of clinical research of prognosis according to the age, gender and race still exists. The research conducted in Japan (similar demographic characteristics with Korea) showed that the group with baPWV higher than 1700 cm/s had significantly higher cardiovascular mortality rate than the other group. 18 Therefore, based on previous research, we defined the SA group as patients with baPWV over 1700 cm/s.
There are some limitations to our study. First, although a baPWV over 1700 cm/s is considered an acceptable definition of SA based on a previous study, 31 there is still a debate on the proper ‘cut-off’ value for both ‘non-diabetes’ and ‘diabetes’ patients. This warrants further prospective and large trials, to validate the prognostic value of PWV. Second, this cross-sectional and retrospective study, based on medical records, did not allow for causal relationship. Third, we could not exclude the effect of medication use. In our study, anti-hypertensive drug constituted the highest position, at 71%, in the SA group, compared to 43.5% in the non-SA group. Since PWV is affected by BP-lowering agents, 32 the degree of atherosclerosis may have been underestimated in both groups. Treatment of dyslipidaemia also delays the progression of atherosclerosis. This may have interfered with the results. However, cystatin C remained a significant risk predictor of atherosclerosis in patients with diabetes, after adjusting for several confounding factors in this study.
The strength of our study is that we showed cystatin C as an independent risk factor for atherosclerosis, especially in people with diabetes. This result emphasizes the efficiency of serum cystatin C as a surrogate marker, predicting the additional CVD risk in T2DM patients. However, clinical application study on the causal relationship between serum cystatin C and SA is required, through prospective tracking observation for next few years.
In conclusion, serum cystatin C is related to SA in patients with T2DM. Cystatin C is identified as a predictor of the risk of atherosclerosis, after adjusting for various factors associated with diabetes and CVD; the risk rises by 1.2 times with every 1 mg/L increase in cystatin C level. This result suggests that serum cystatin C would be a useful surrogate marker for predicting the risk of atherosclerosis in people with T2DM.
Footnotes
Acknowledgements
Y.K.C., Y.J.L., K.W.K., R.K.C. and J.S.M. participated in acquisition of the data, searching the literature, coordination and design of the study, performed the statistical analysis and interpreted the data. Y.K.C., Y.J.L., S.M.C. and J.S.M. drafted and revised the article. J.S.Y., K.C.W. and H.W.L. interpreted data, reviewed and edited the report. All authors read and approved the final article. Y.K.C. and Y.J.L. contributed equally to this work.
Availability of data and material
All data generated or analysed during this study are included in this published article.
Declaration of conflicting interests
The author(s) declared no potential conflicts of interest with respect to the research, authorship and/or publication of this article.
Ethical approval and consent to participate
The study was approved by the Yeungnam Institute’s internal review board and was performed in full compliance with the declaration of Helsinki.
Funding
This work was supported by the 2016 Yeungnam University Research Grant.