
Abstract
Background:
Diabetic retinopathy is a neurological disease, which can lead to blindness in severe cases. The pathogenesis underlying diabetic retinopathy is unclear. The aim of this study was to explore the role of dysregulated microRNA 29a/b in the onset and progression of diabetic retinopathy.
Methods:
Diabetes mellitus was induced in rats using 60 mg/kg of streptozotocin. Glucose (5.5 and 25 mM) was used to stimulate rat retinal Müller cells. Real-time polymerase chain reaction and Western blot analyses were used to determine gene expression. A luciferase reporter assay was conducted to validate the relationship of microRNA 29a/b with glioma-associated oncogene homolog 1 and Forkhead box protein O4.
Results:
The expression of microRNA 29a/b and glutamine synthetase decreased in both diabetes mellitus rats and rat retinal Müller cells stimulated with high glucose, whereas the expression of sonic hedgehog, glioma-associated oncogene homolog 1, glial fibrillary acidic protein, and vascular endothelial growth factor, as well as the content of glutamate, increased. Dysregulated microRNA 29a/b was directly regulated by the sonic hedgehog–glioma-associated oncogene homolog 1 signalling pathway, and microRNA 29a and microRNA 29b targeted Forkhead box protein O4 and regulated its expression.
Conclusion:
Downregulation of microRNA 29a/b, mediated by the sonic hedgehog–glioma-associated oncogene homolog 1 signalling pathway, exacerbated diabetic retinopathy by upregulating Forkhead box protein O4.
Keywords
Introduction
Diabetic retinopathy (DR) is one of the most important complications of diabetic mellitus (DM) and is mainly caused by metabolic disorders. 1 Generally, DR does not show any obvious symptoms in the early stages of the disease and it is not diagnosed until it has progressed to an advanced stage, which can often lead to irreversible blindness. 2 Although major advances in therapeutic modalities provide symptom relief in cases of DR, these do not meet the needs of patients. A novel and effective diagnostic approach is needed to detect early-stage DR.
MicroRNAs (miRNAs) are a class of endogenous noncoding small RNAs, which comprise approximately 22 nucleotides. 3 miRNAs participate in multiple physiological and biochemical processes, such as cell growth, apoptosis, neurogenesis, signal transduction and immunity. 4 They mediate degradation of target messenger RNA (mRNA) by binding the 3′ untranslated region (UTR) and inhibiting its expression at the post-transcriptional level. Previous studies reported that many miRNAs were involved in the development of DR. For example, miR-21 regulated the pathogenesis of DR by regulating the expression of PPARα (peroxisome proliferator-activated receptor alpha). 5 MiR-195 regulated changes mediated by SIR1, a regulator of many auxin-inducible genes, in DR. 6 A number of studies proposed that miR-126 and miR-23b-3p could serve as promising novel biomarkers in DR.7,8 Research also showed that the miR-29 family, which contains miR-29a, miR-29b, and miR-29c, participated in various physiological processes and functioned as an inhibitor of tumorigenesis or disease. According to one study, miR-29 could be used as a therapeutic agent in pancreatic cancer stroma by targeting pancreatic ductal adenocarcinomas. 9 Another study reported that microRNA 29a/b (miR-29a/b) promoted osteogenesis via Wnt signalling. 10 In addition, research demonstrated the clinical significance of both miR-29a and miR-29b in type 2 DM and reported that they could be involved in the pathogenesis of diabetic nephropathy and act as biomarkers in the progression of this disorder. 11 However, whether miR-29a/b can serve as an important biomarker in DR remains unclear.
Glioma-associated oncogene homolog 1 (Gli1) is widely expressed in many organs, such as muscle, bone, heart, kidney and liver, and is associated with fibrotic changes after injury. A previous study indicated that Gli1 was involved in retinal progenitor and Müller cells. 12 A recent study demonstrated that the sonic hedgehog (SHH) pathway was associated with the expression of glial fibrillary acidic protein (GFAP) and that SHH-Gli1 signalling played an important role in the process of retinal injury. 13 However, the role of SHH-Gli1 signalling in the mechanism of DR was unclear. Forkhead box (FOX) proteins of O class comprise FOXO1, FOXO3, FOXO4 and FOXO6 transcription factors, which govern a variety of physiological responses, such as DNA damage, cell proliferation and apoptosis, signalling transduction and neural responses. A previous study indicated that FOXO4 was upregulated in diabetic rats and that it acted as a novel regulatory biomarker in DR. 14 However, the potential role of FOXO4 in mediating the regulatory mechanism of DR was unclear.
The aims of this study were to elucidate the mechanism of miR-29a/b in mediating the pathogenic process of DR in high glucose (HG)-stimulated rat retinal Müller cells (rMC-1) in DM.
Materials and methods
Diabetic induction and ethics statement
A total of 36 male Sprague-Dawley rats aged 4–6 weeks were obtained from Shanghai Bioray Laboratories Inc. (Shanghai, China). The rats were housed in a pathogen-free facility, under a 12 h-12 h day/light cycle in a humidified atmosphere at 25°C. All animals had access to adequate food and water. After an acclimatization period of 2 weeks, the rats were randomly divided into a DM group and a control group (n = 18 in each group). DM rats were established by an intraperitoneal injection of streptozotocin (60 mg/kg dissolved in 0.1 mol/L citrate buffer). The control rats were intraperitoneally injected with the same amount of citrate buffer (0.1 mol/L). After 72 h, rats with a blood glucose concentration above 16.7 mM after fasting overnight were considered to denote successful establishment. The model rats and control animals were euthanized, and Müller cells were isolated for further studies.
This study was approved by the Animal Care and Use Committee. All experiments were performed in accordance with the Guide for the Care and Use of Laboratory Animals.
Cell culture
rMC-1 cells were purchased from the American Type Culture Collection. Müller cells were isolated from retinal tissue of DM rats and normal rats. Briefly, tissues of DM rats and normal rats were cut into 1 mm × 1 mm × 1 mm pieces and then transferred into a culture flask containing DMEM/F12 medium, supplemented with 0.2 (V/V) fetal calf serum, 100 kU/L of penicillin and 100 kU/L of streptomycin and incubated at 37°C in a humidified atmosphere of 5% CO2 with 10% fetal calf serum. The medium was changed every 3 days. The cells were subcultured after cell fusion. Cells at passage 3 and with a final concentration of about 3.2 × 10⁷/L were used in subsequent in vitro experiments.
rMC-1 stimulation
rMC-1 cells were stimulated with 25 or 5.5 mM glucose for 24, 48 and 72 h and then cultured in a six-well plate (1 × 10⁵ cells per well) containing DMEM/F12, supplemented with 10% fetal calf serum and maintained at 37°C in a humidified atmosphere of 5% CO2.
Real-time polymerase chain reaction
Total RNA was isolated from tissues or cells using TRIzol reagent (Invitrogen, Carlsbad, CA, USA), according to the manufacturer’s instructions. RNA was quantified using a NanoDrop 2000 (Thermo Fisher, Waltham, MA, USA). Complementary DNA (cDNA) was synthesized using an RNA plate with a commercially available Reverse-Transcription Kit (Invitrogen), according to the manufacturer’s instructions. Real-time polymerase chain reaction (PCR) was performed using an ABI 7900 PCR System (Applied Biosystems, Tokyo, Japan). The primers used in this study were synthesized by Shanghai Yingjun Technology (Shanghai, China). GAPDH served as an internal control. Primers used to amplify miR-29a and miR-29b and U6 small nuclear RNA (snRNA) were purchased from Qiagen (Hilden, Germany). U6 snRNA expression was used as an internal control for quantification of miRNAs. The data represent the results of three separate experiments conducted under the same conditions. The primers sequences were as follows:
miR-29a: forward 5′-TAGCACCATTTGAAATCAGTTT-3′; reverse 3′-TGCGTGTCGTGGAGTC-5′;
miR-29b: forward 5′-AAAATATTTGGTTTTTATTAGGGT-3′; reverse 3′-CATAACCTCTTCCTTTACCATTAAA-5′;
FOXO4: forward 5′-ATGGAGGAAGAAAACGTACCCC-3′; reverse 5′- TTAGCTGGGCACCCAGTTG-3′;
Vascular endothelial growth factor (VEGF): forward 5′-ACACGAATTCATGAACTTTCTGCTGTCTTGGGT-3′; reverse 5′-ATTGCTCGAGTCACCGCCTCGGCTTGTCACATC-3′;
GFAP: forward 5′-AGATCCGCACGCAGTA TGA-3′; reverse 5′-AGTCGTTGGCTTCGTGCTT-3′;
Glutamine synthetase (GS): forward 5′-GCTGCAAGACCCGTACCCT-3′; reverse 5′-TTCCACTCAGGTAACTCTTCCACA-3′;
SHH: forward 5′-GTCAAAGCTTCGCACCTGCTCTTTGTGG-3′; reverse 5′-GTCAACTAGTCCAGGTGCCTATTTG GTAGAG-3′;
Gli1: forward 5′-GCCAGCCAAGAGAGACCAACAG-3′; reverse 5′-CCGACAGAGGTGAGATGGACAG-3′.
Western blot
The protein expression of several related genes was determined by a Western blot. Cells and tissues were ground and lysed in radio immunoprecipitation assay (RIPA) lysis buffer. After centrifugation, the supernatant was collected, and the protein concentration of the supernatant was quantified by the bicinchoninic acid (BCA) method. The proteins were then separated by sodium dodecyl sulphate polyacrylamide gel electrophoresis (SDS-PAGE), and an equal amount of protein was transferred onto polyvinylidene difluoride (PVDF) membranes, followed by incubation with primary antibodies (anti-SHH, anti-Gli1, anti-GFAP, anti-VEGF, anti-GS and anti-FOXO4) at 4°C for 24 h. Next, the proteins were cleared by phosphate-buffered saline (PBS) and incubated with secondary antibodies for 2 h at room temperature. The protein bands were visualized using enhanced chemiluminescence (ECL). β-actin served as an internal control. The antibodies used in this study were as follows: anti-SHH (1:500; Santa Cruz Biotechnology, CA, USA); anti-Gli (1:1000; Abcam, Cambridge, MA, USA); anti-GFAP (1:10000; Abcam); anti-VEGF (1:1000; Abcam); anti-GS (1:1000; Abcam); anti-FOXO4 (1:1000; Abcam); and β-actin (1:5000; Abcam). The data represent the results of three separate experiments conducted under the same conditions.
High-performance liquid chromatography
High-performance liquid chromatography (HPLC) was performed using an Agilent 1200 system, according to the manufacturer’s instructions. Briefly, cells were pretreated with perchloric acid at 4°C. The mobile phase consisted of methanol, water, acetate and triethylamine. The temperature of the column was 30°C. The glutamate concentration level was calculated by the peak area ratio. Standard amino acid solutions were used to quantify glutamate by running under the same conditions. Details were described in a previous report. 15
Cell transfection
Cell transfection was performed using Lipofectamine 2000 Reagent (Invitrogen). Briefly, cells were planted in a six-well plate, with 1 × 10⁵ cells per well for 24 h. Mimics, inhibitors of miR-29a and miR-29b and negative controls (NCs) were then transfected to cells. Real-time PCR was performed to evaluate the transfection efficiency. FOXO4 overexpression was achieved using a FOXO4 expression plasmid. The mimics, inhibitors and NCs were synthesized in Shanghai Yingjun Technology (Shanghai, China). The mimics and inhibitors were as follows:
miR-29a mimic: 5′-UAGCACCAUCUGAAAUCGGUUA-3′;
miR-29b mimic: 5′-UAGCACCAUUUGAAAUCAGUGUU-3′;
miR-29a inhibitor: 5′-UAACCGAUUUCAGAUGGUGCUA-3′;
miR-29b inhibitor: 5′-AACACUGAUUUCAAAUGGUGCUA-3′.
Luciferase reporter assay
The bound sites of miR-29a and miR-29b with FOXO4 were predicted by an miR code algorithm (http://www.mircode.org/). A firefly luciferase reporter assay was performed using the Dual-GLO luciferase system (Promega, Madison, WI, USA). Firefly luciferase was cloned to the vector to construct a luciferase reporter plasmid by cloning firefly luciferase cDNA. Luciferase activity was determined after co-transfection with a pre-miRNA precursor and Dual-Luciferase miRNA target expression vectors using Lipofectamine 2000 transfection reagent (Invitrogen). Relative luciferase activity was determined using a Dual-Luciferase Reporter Assay (Promega).
Statistical analysis
All data are presented as means ± standard deviation (SD). The analysis was performed using SPSS 18.0 software. Statistical differences were analysed using a one-way analysis of variance, combined with a t test. A value of p < 0.05 was considered a statistically significant difference.
Results
Expression of miR-29a, miR-29b, SHH and Gli1 in a rat model of streptozotocin-induced DR in DM rats
To quantify the expression of miR-29a, miR-29b, SHH and Gli1 in DM rats, real-time PCR and Western blot analyses were performed of DR samples (n = 6 in each group) pretreated with streptozotocin for 1, 3, and 5 months. As presented in Figure 1, the expression levels of both miR-29a and miR-29b were significantly decreased in Müller cells as in DR group compared with those in the control group (Figure 1(a) and (b)), whereas those of SHH and Gli1 were upregulated (Figure 1(c)). Analysis of the expression levels of several proteins associated with cell activation and function in tissues of both DR rats and normal rats showed that the expression of GFAP and VEGF increased in the DR group as compared with those in the control group. However, GS was weakly expressed in DR rats (Figure 1(d)). HPLC quantification of glutamate revealed that the level was much higher in the DR group than in the control group (Figure 1(e)).
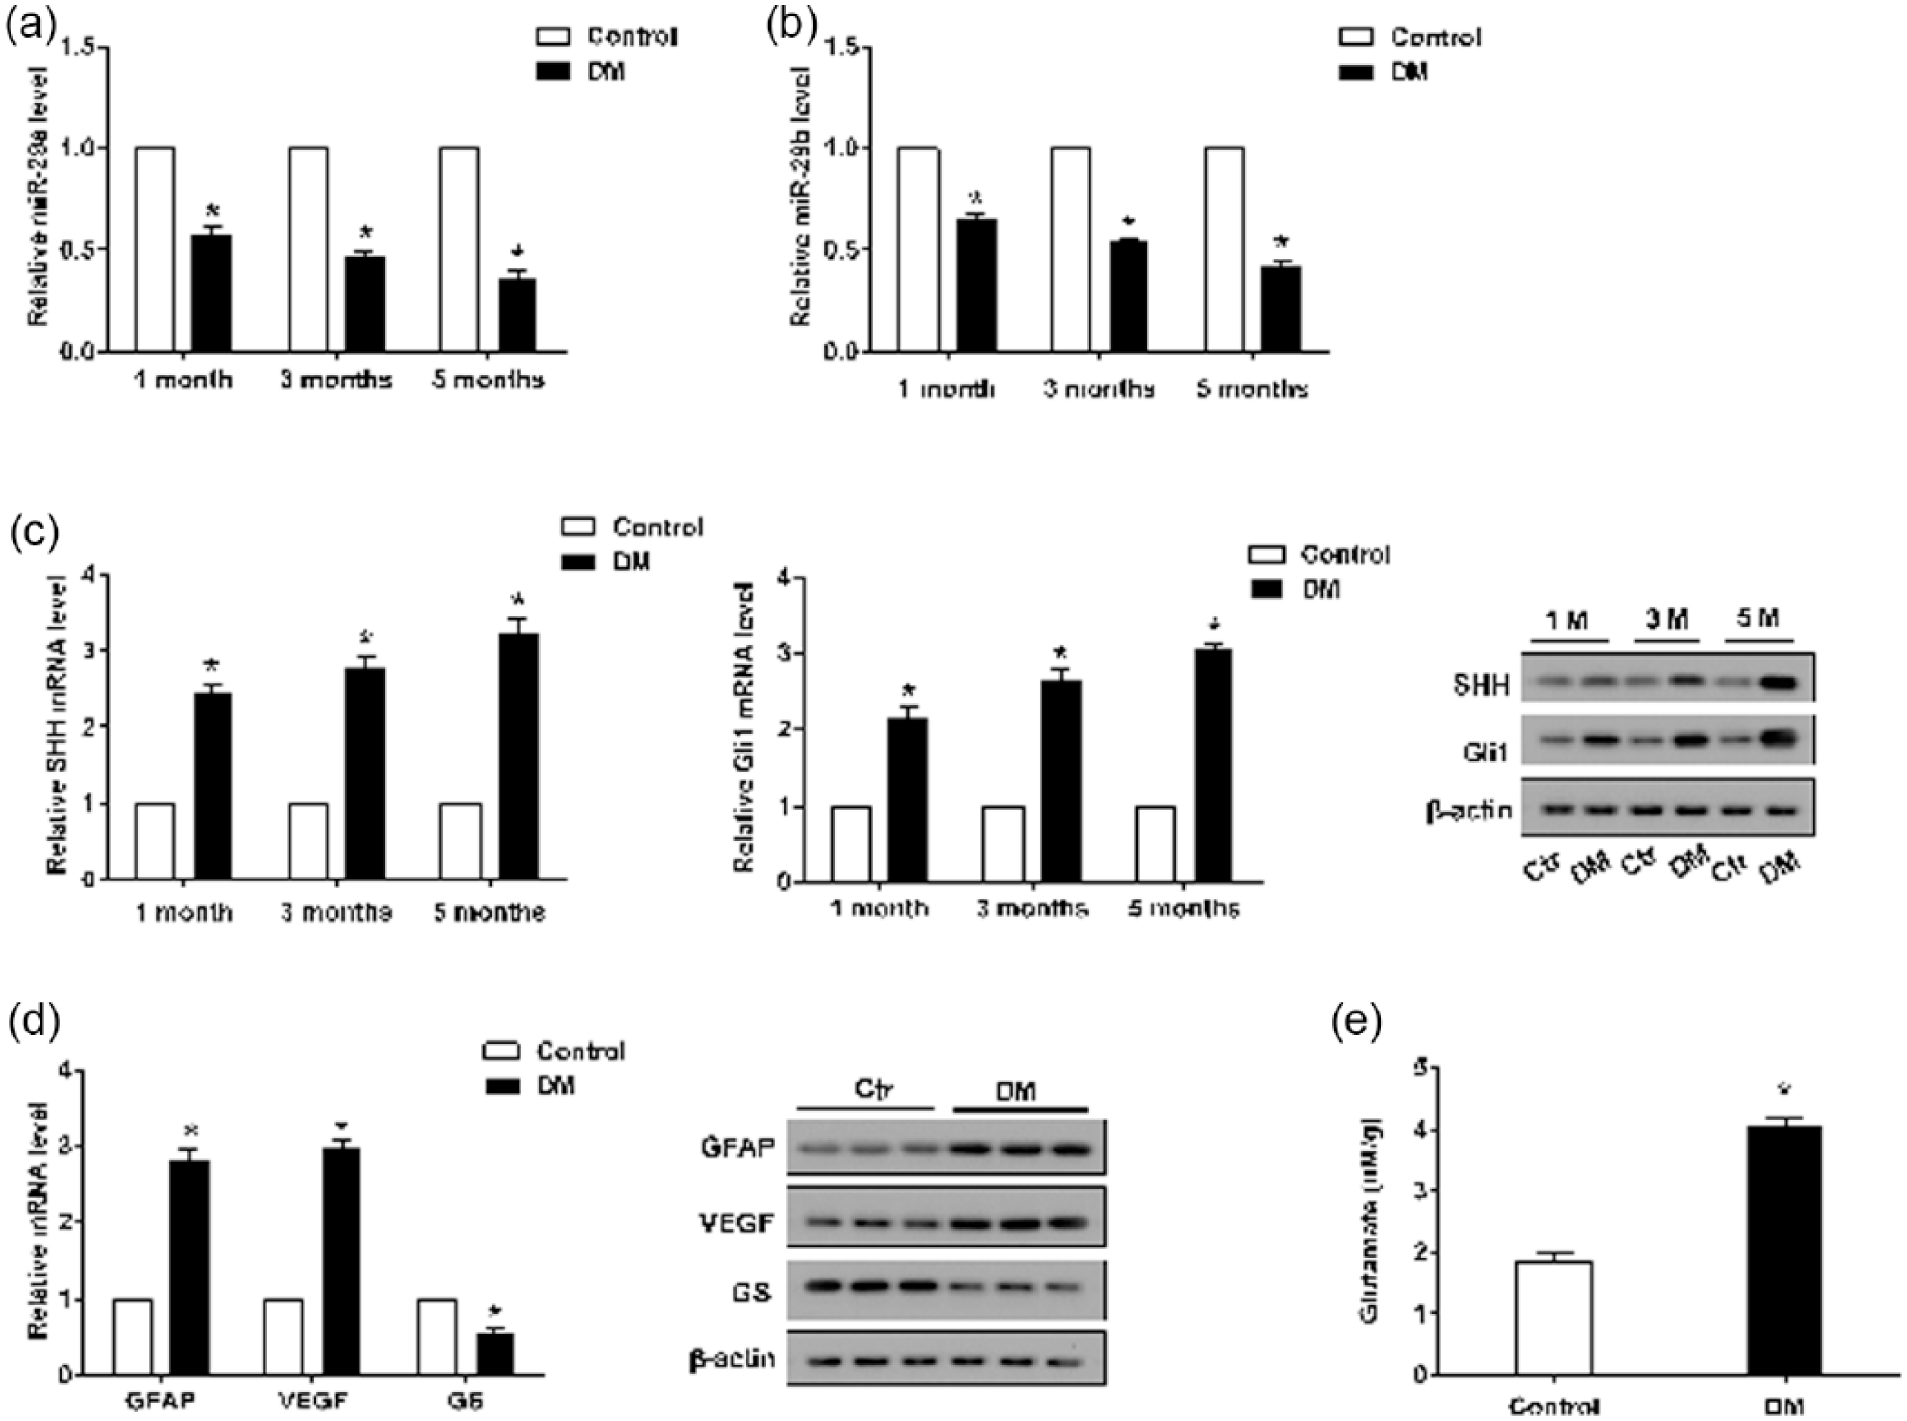
The expression pattern of miR-29a/b, SHH and Gli1 in Müller cells of diabetic rats. (a)–(c) The mRNA expression levels of miR-29a, miR-29b, SHH and Gli1 were determined by real-time PCR. (c) The protein expression of SHH and Gli1 was determined by a Western blot. (d) The mRNA and protein expression of GFAP, VEGF and GS were detected by real-time PCR and Western blot analyses. (e) HPLC was used to measure the content of glutamate. β-actin served as an internal control, *p < 0.01 versus control.
Expression pattern of miR-29a, miR-29b, SHH and Gli1 in rMC-1 cells
To further determine the expression of miR-29a, miR-29b, SHH and Gli1, in vitro experiments were performed. The results of the real-time PCR revealed that the expression of miR-29a and miR-29b dramatically decreased in rMC-1 cells stimulated with HG (Figure 2(a) and (b)), whereas the expression of SHH and Gli1 was downregulated (Figure 2(c)). Moreover, the expression of GFAP and VEGF increased and that of GS decreased in rMC-1 cells stimulated with HG (Figure 2(d)). The Western blot analysis revealed that the expression of SHH, Gli1 and GS decreased markedly in HG-stimulated rMC-1 cells as compared with that in rMC-1 cells stimulated with normal glucose (Figure 2(c) and (d)). The expression of GFAP and VEGF (Figure 2(d)) also increased in HG-stimulated rMC-1 cells as compared with that in the control. Furthermore, the level of glutamate increased in HG-stimulated rMC-1 cells (Figure 2(e)).
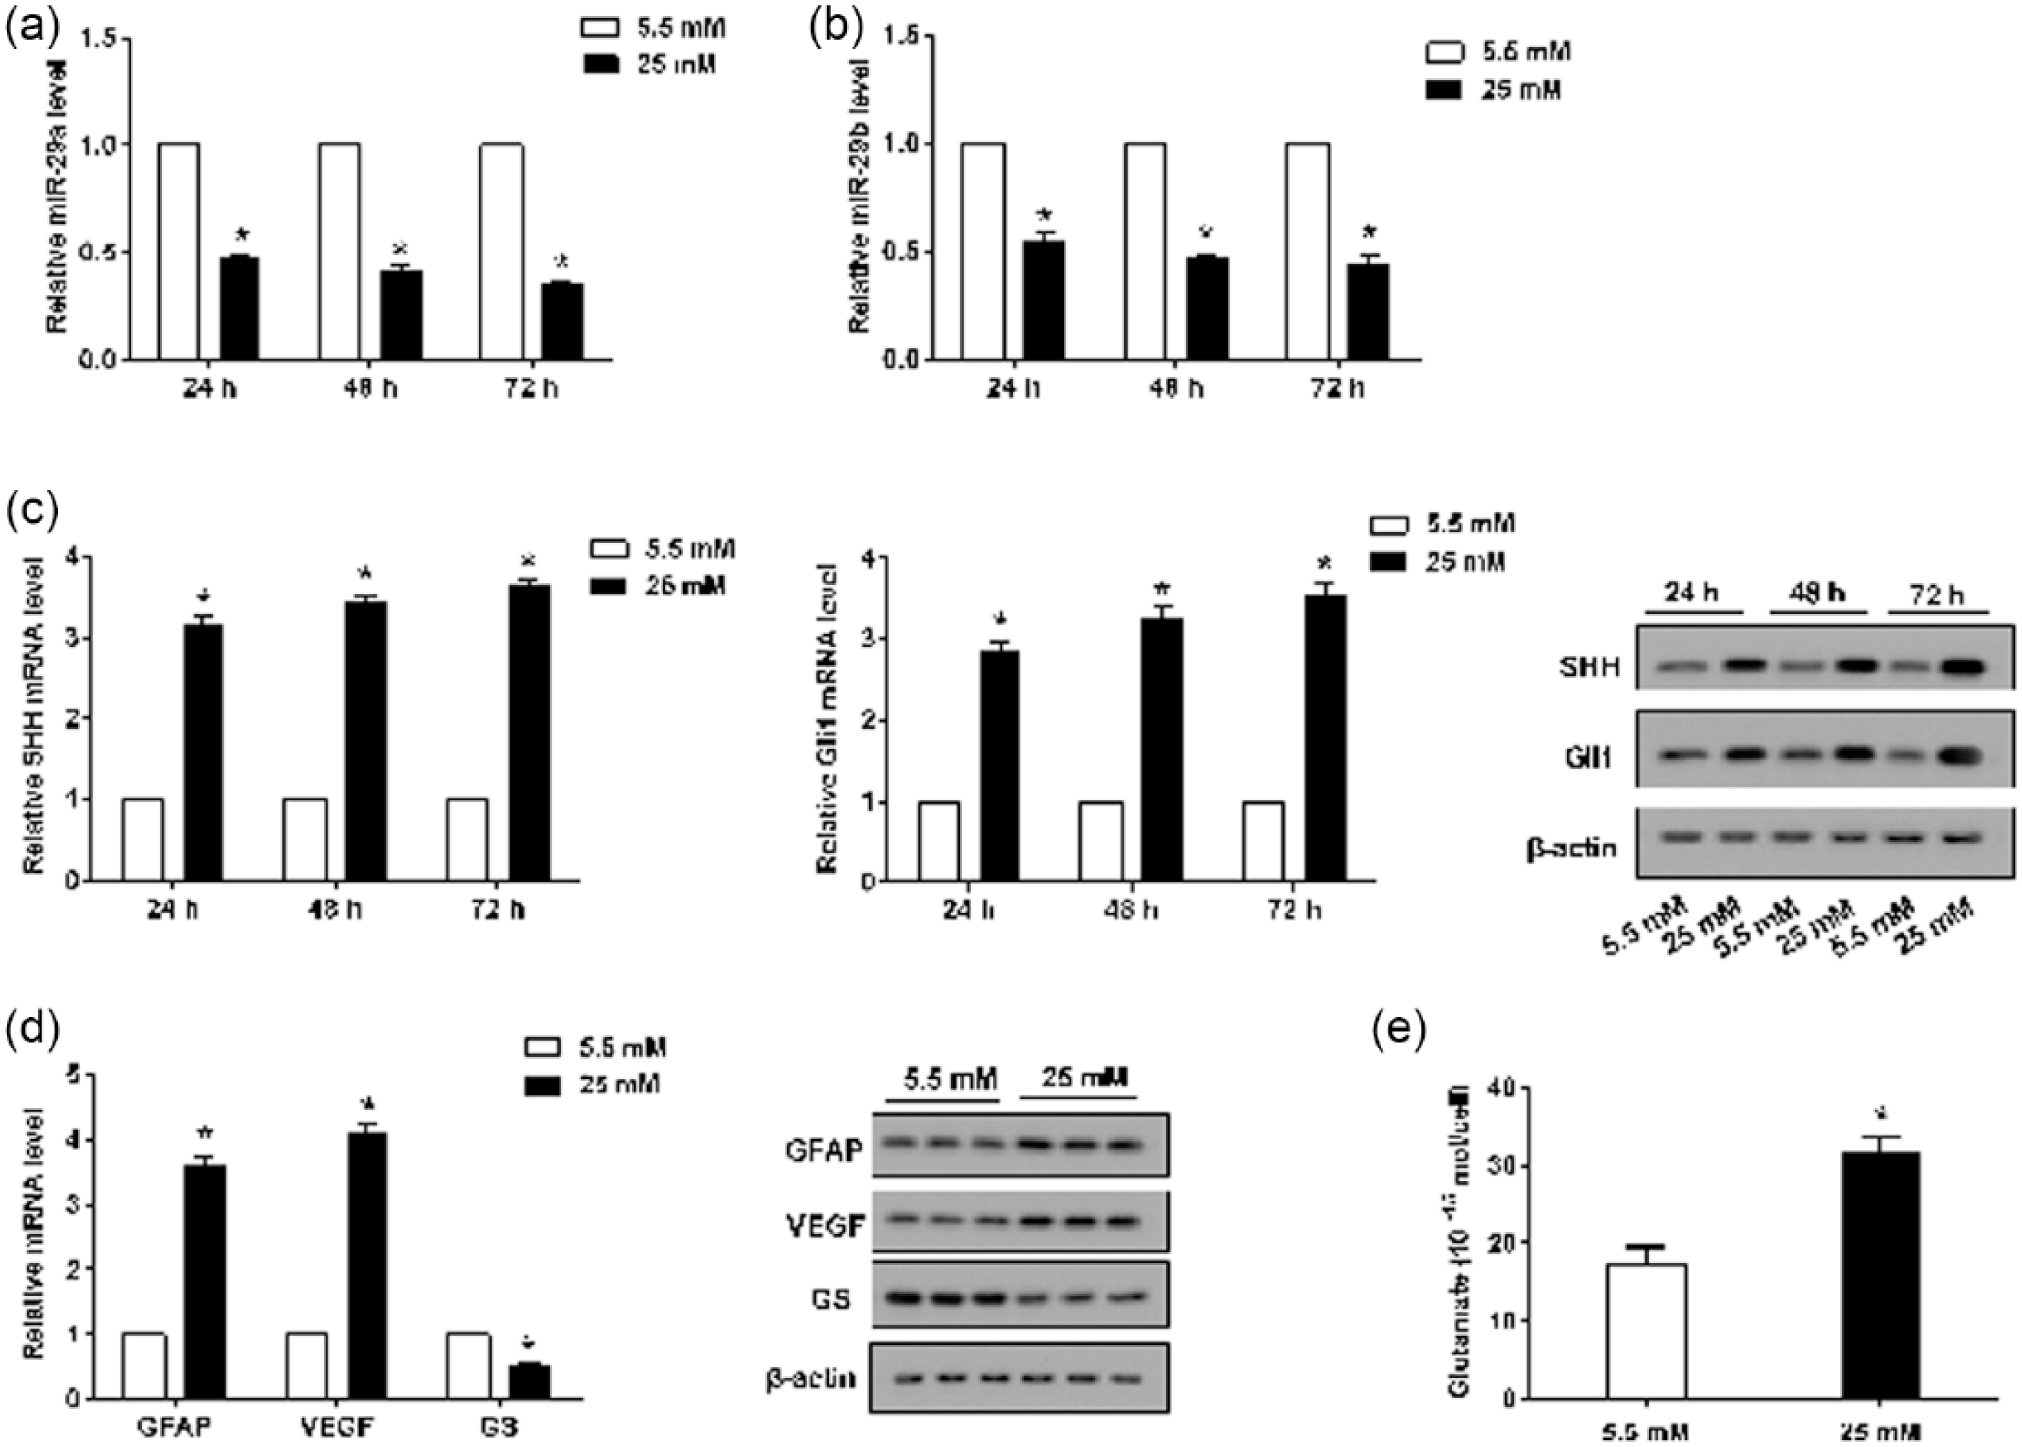
Effects of HG supplementation on rMC-1cells. rMC-1 cells were divided into six groups and pretreated with 5.5 mM glucose or 25 mM glucose (HG) for 24, 48 and 72 h. (a) and (b) Relative miR-29a and miR-29b expression was determined by real-time PCR. (c) The expression levels of SHH and Gli1 were measured by real-time PCR and Western blot analyses. (d) The mRNA and protein expression of GFAP, VEGF and GS were detected by real-time PCR and Western blot analyses. (e) HPLC was used to measure the glutamate content. β-actin served as an internal control, *p < 0.01 versus control.
Both miR-29a and miR-29b were regulated by Gli1
As shown by the results of the online analysis, both miR-29a and miR-29b are located on chromosome 4 of the rat (Figure 3(a)). The luciferase reporter assay demonstrated that pretreatment of rMC-1 cells with cyclopamine significantly promoted relative luciferase activity of the miR-29a/b promoter but did not affect relative luciferase activity of the Mutant-Gli promoter (Figure 3(b) and (c)). Furthermore, the expression of miR-29a and miR-29b decreased in HG-stimulated rMC-1 cells, and glutamate supplementation further decreased their expression (Figure 3(c)).
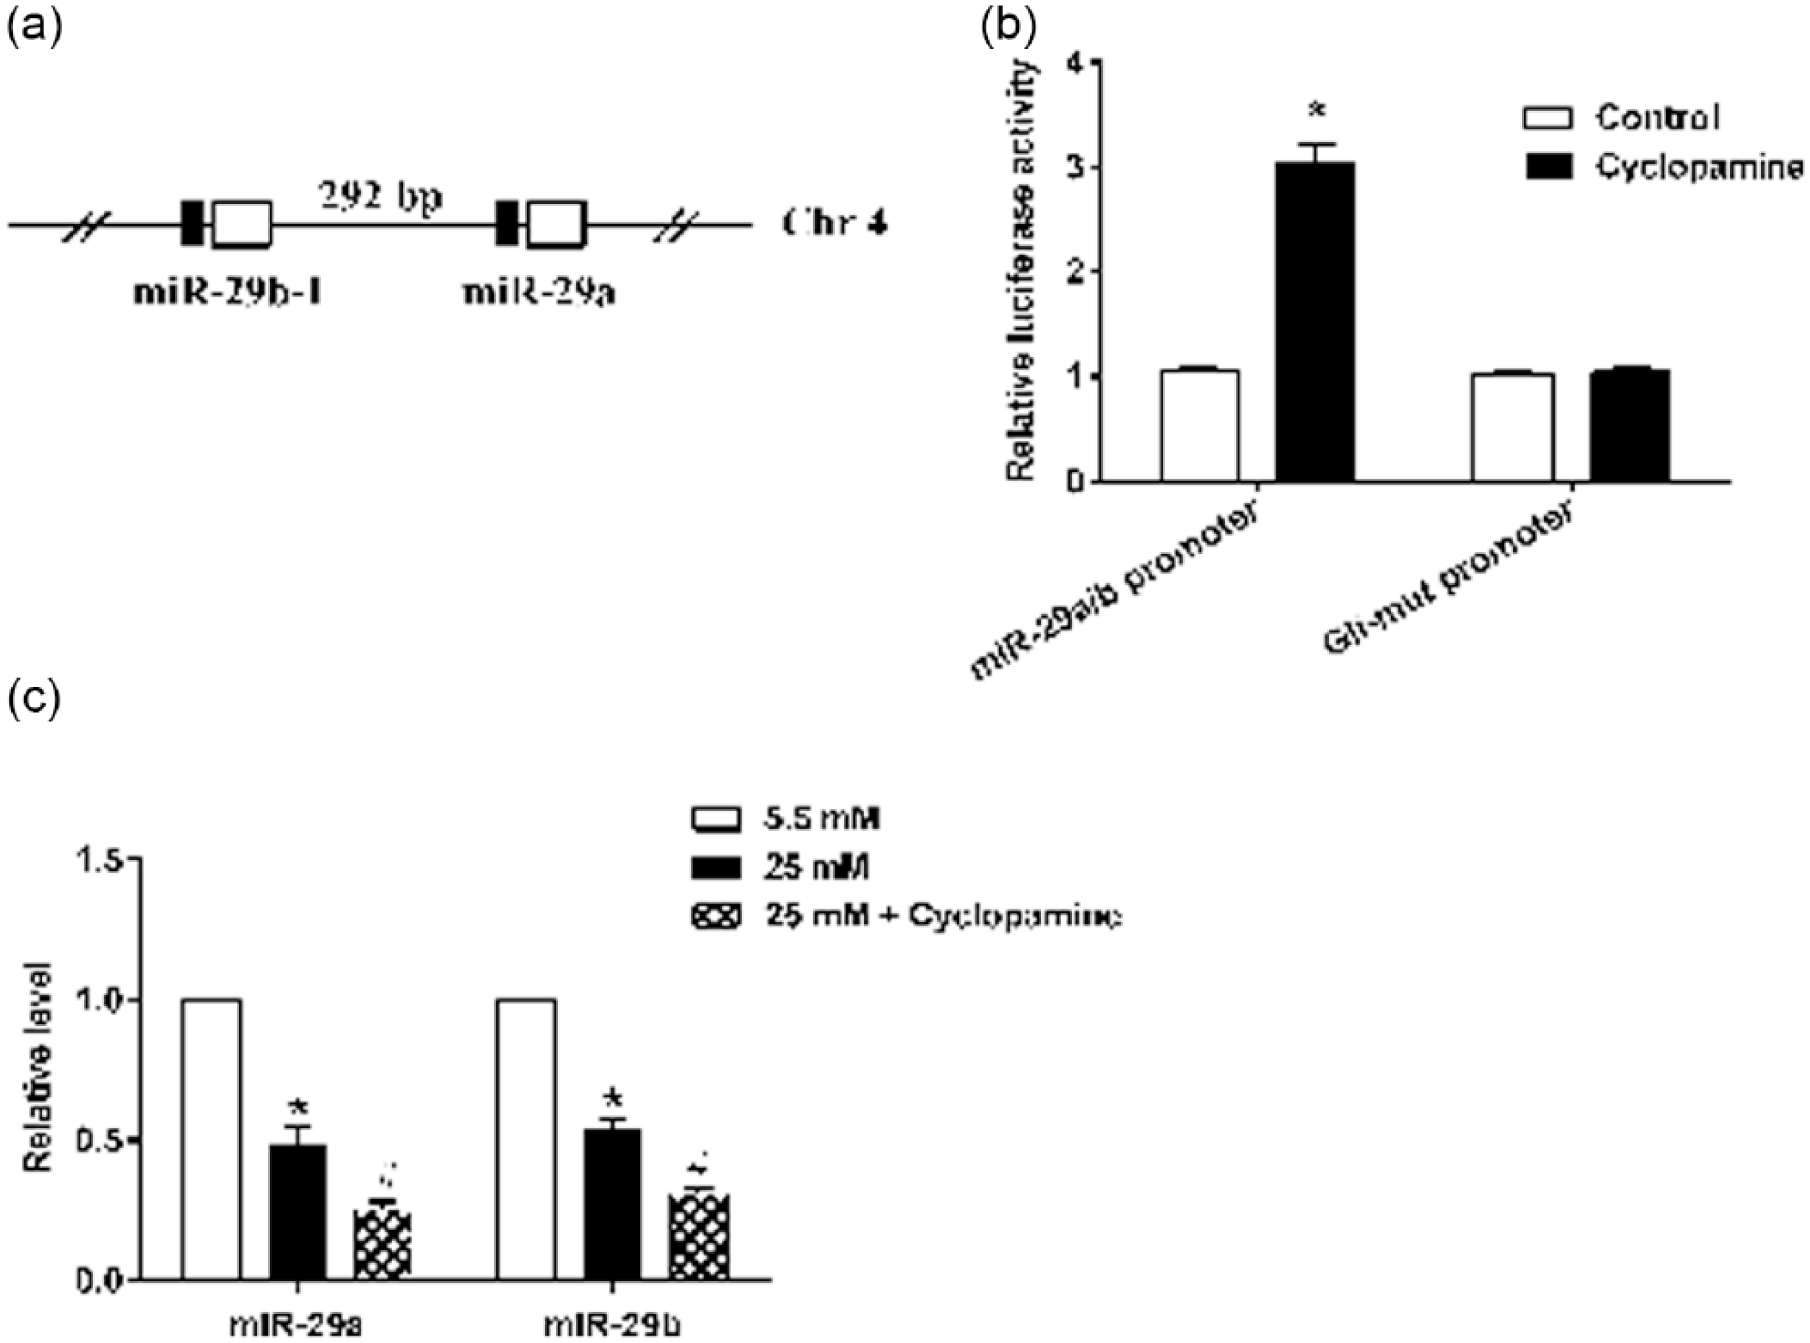
The SHH-Gli1 pathway regulated the expression of miR-29a and miR-29b. (a) Both miR-29a and miR-29b were located on chromosome 4 in rat. (b) A luciferase reporter assay was performed to detect the relative luciferase activity of miR-29a/b and Gli1. (c) Real-time PCR was performed to detect the mRNA expression of miR-29a and miR-29b following treatments with 5.5 mM glucose, 25 mM glucose and 25 mM glucose + cyclopamine. *p < 0.01 versus control or 5.5 mM glucose.
Interaction effects of upregulated miR-29a/miR-29b and HG on rMC-1
The expression of miR-29a/miR-29b was significantly upregulated in rMC-1 cells transfected with an miR-29a or miR-29b mimic (Figure 4(a) and (b)). HG supplementation markedly increased the expression of GFAP, VEGF and GS, as well as the level of glutamate. However, cells transfected with the miR-29a or miR-29b mimics reversed these effects of HG (Figure 4(c) to (g)).
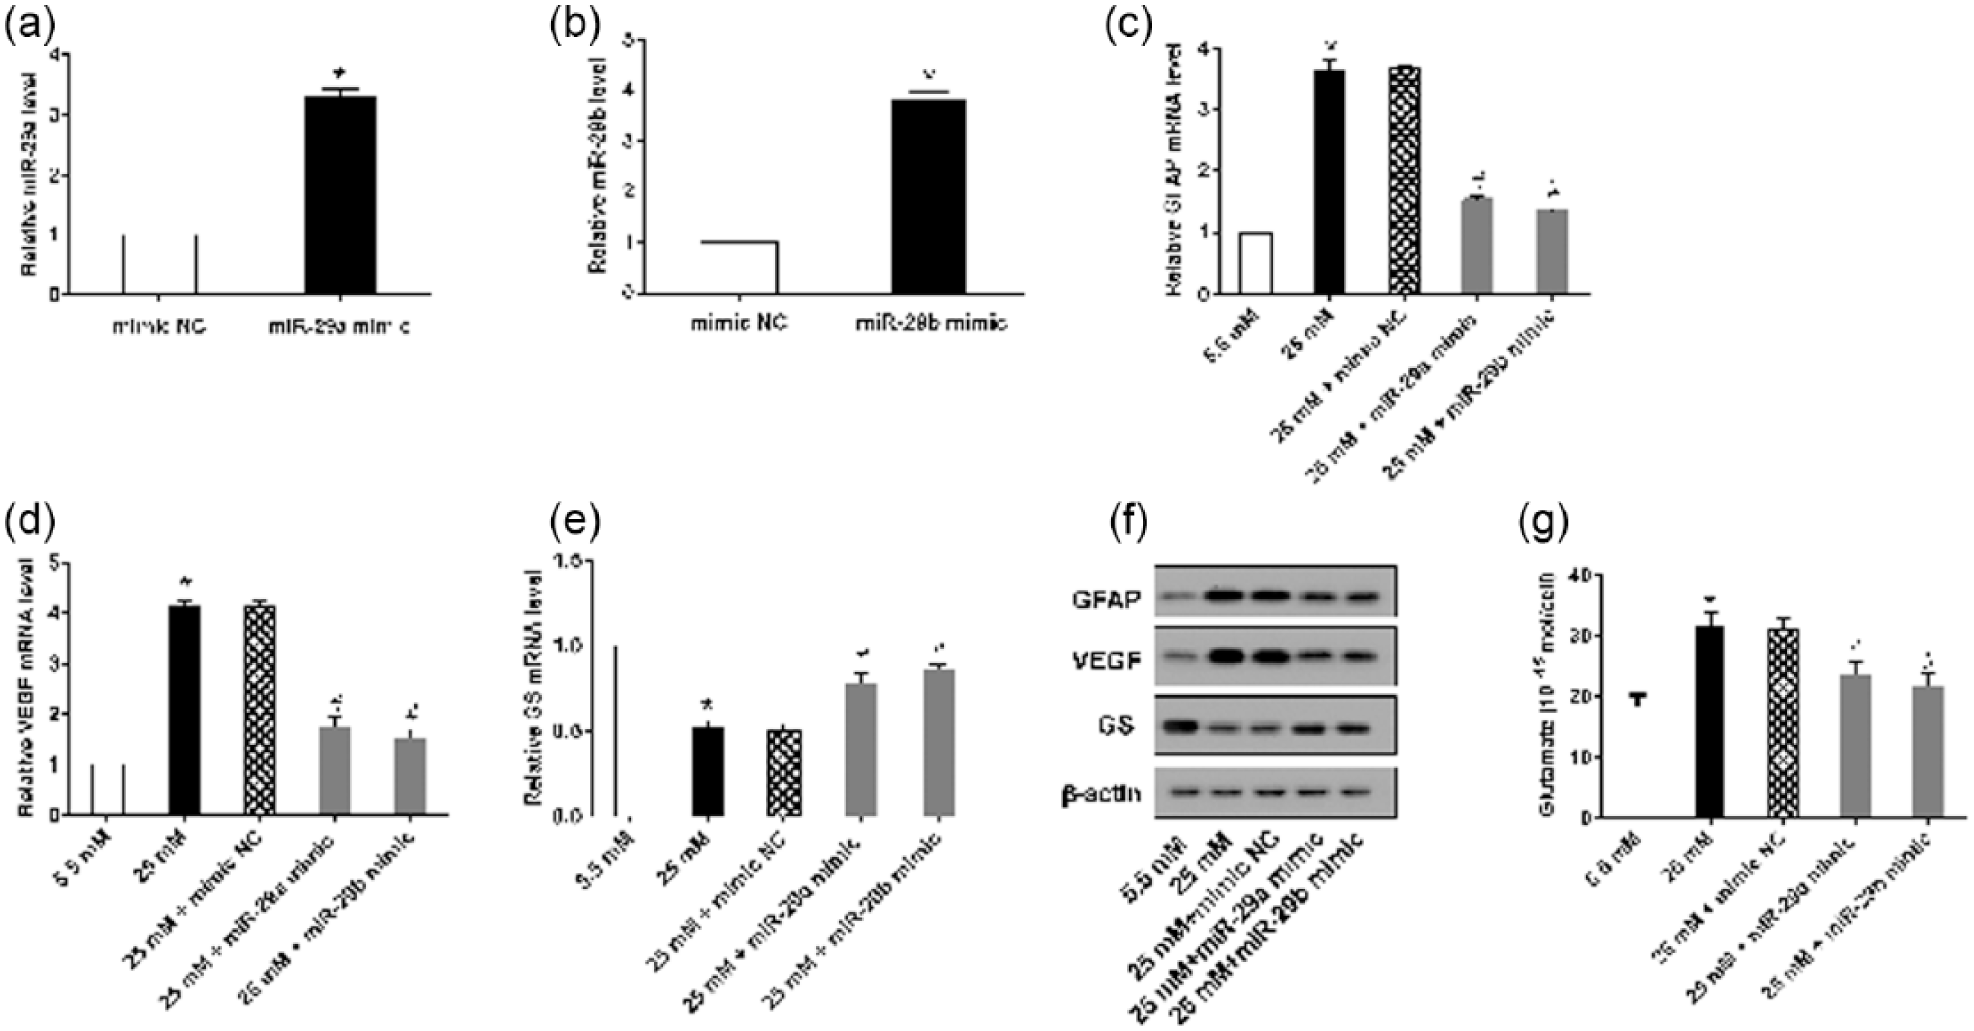
Overexpressed miR-29a/b reversed the effects of HG. rMC-1 cells with overexpression of miR-29a and miR-29b were stimulated with HG for 72 h, (a) and (b) Real-time PCR was performed to detect the expression of miR-29a and miR-29b. (c)–(e) The mRNA expression of GFAP, VEGF and GS was measured by real-time PCR. (f) The protein expression of GFAP, VEGF and GS was determined by a Western blot. (g) HPLC was used to measure the content of glutamate. β-actin served as an internal control, *p < 0.01 versus mimic control or 5.5 mM glucose; #p < 0.01 versus 25 mM + mimic NC.
Both miR-29a and miR-29b targeted FOXO4 to regulate its expression
As presented in Figure 5(a), HG stimulation significantly promoted the expression of FOXO4 in rMC-1 cells. TargetScan was used to explore the relationship of miR-29a and miR-29b with FOXO4. The results predicted that both miR-29a and miR-29b bound to the 3′UTR of FOXO4. To further verify the relationship between miR-29a/b and FOXO4, a luciferase reporter assay was performed. As expected, cells transfected with either the miR-29a or miR-29b mimic significantly decreased the luciferase activity of the 3′UTR of Wild-Type (WT)-FOXO4 but did not affect the luciferase activity of the 3′UTR of Mutant (Mut)-FOXO4 (Figure 5(c)). Cells transfected with the miR-29a or miR-29b mimic significantly decreased the mRNA and protein expression of FOXO4, whereas cells transfected with the miR-29a or miR-29b inhibitor significantly promoted the mRNA and protein expression of FOXO4 (Figure 5(d)).
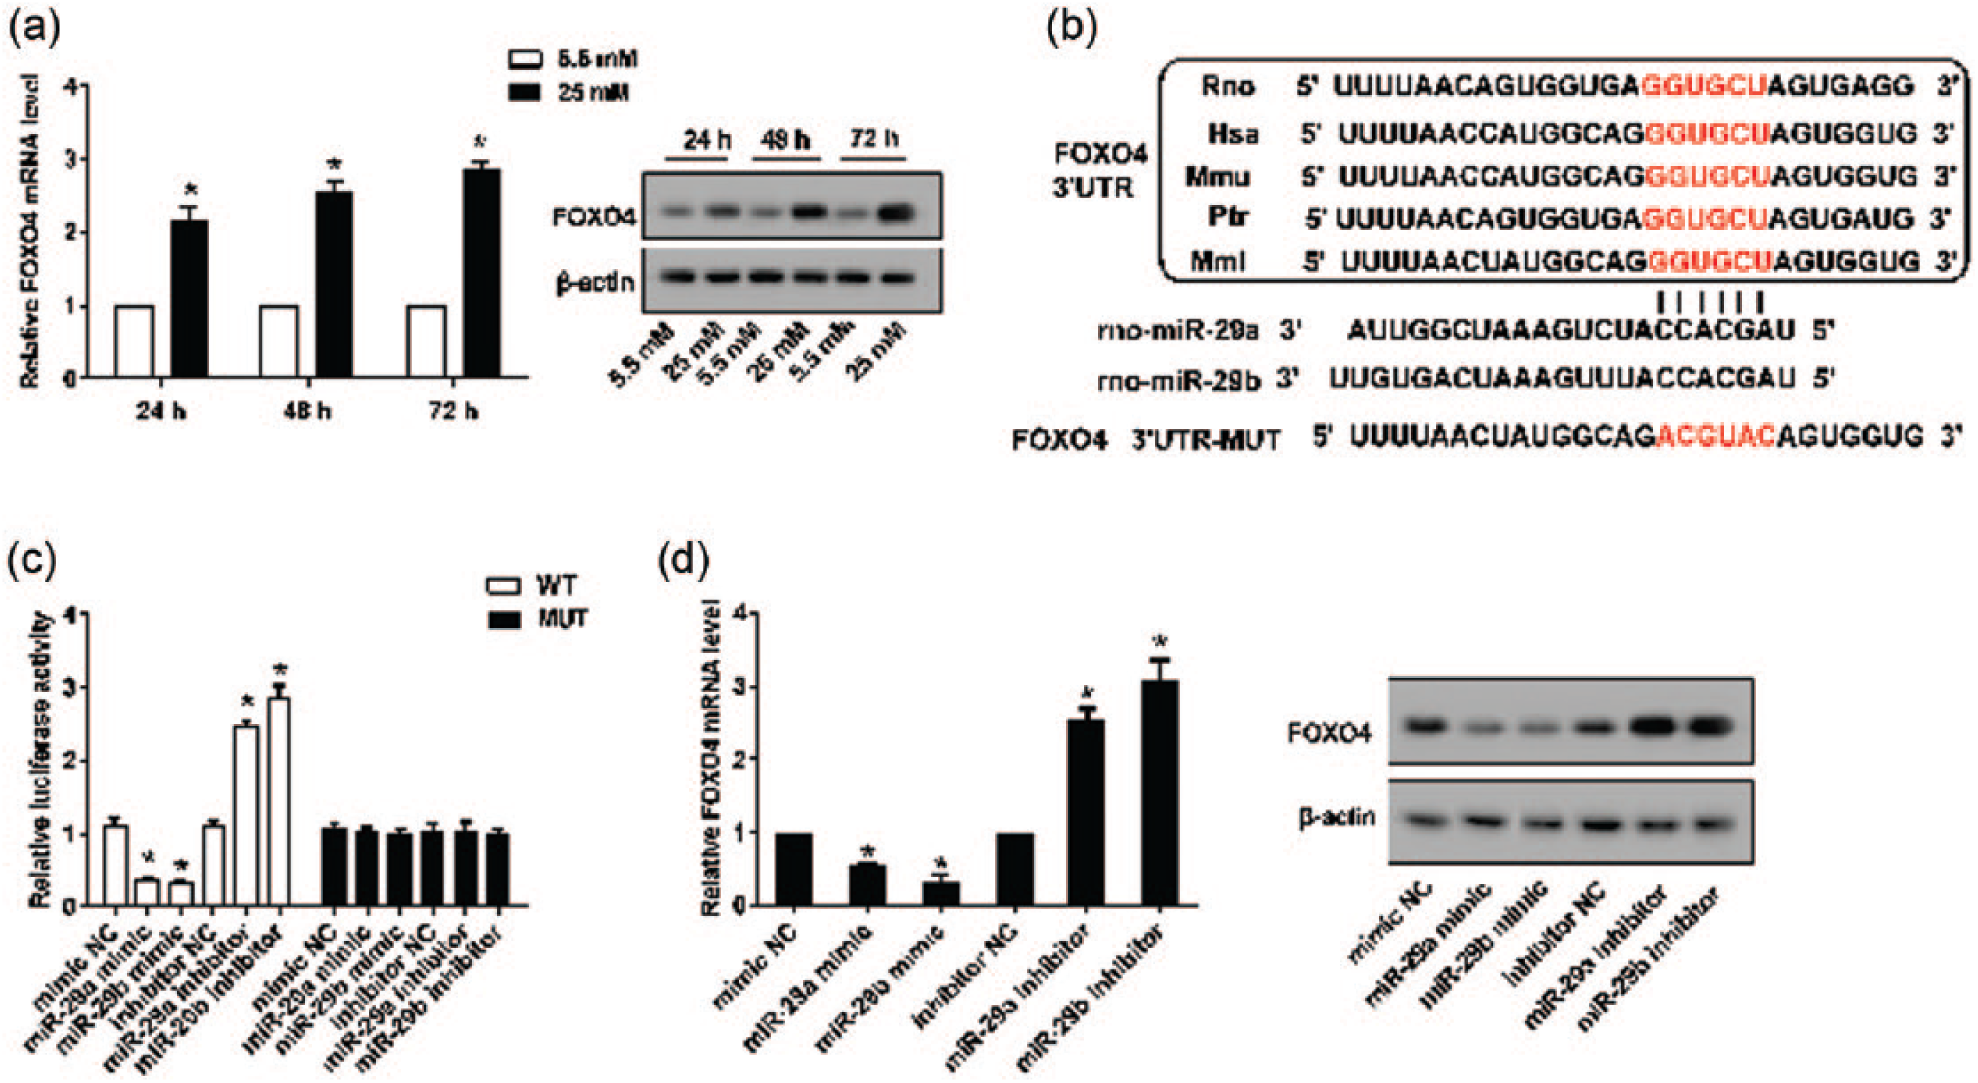
FOXO4 was the target gene of miR-29a and miR-29b. rMC-1 cells were stimulated with HG for 24, 48 and 72 h. (a) The expression of FOXO4 was determined by real-time PCR and Western blot analyses. (b) Online TargetScan predicted that both miR-29a and miR-29b bound to the 3′UTR of FOXO4. (c) A luciferase reporter assay was performed to detect the relative luciferase reporter activity of the 3′UTR of FOXO4. (d) Real-time PCR and Western blot analyses were used to detect the expression level of FOXO4 in rMC-1 cells transfected with an miR-29a mimic, miR-29b mimic, miR-29a inhibitor or miR-29b inhibitor. β-actin served as an internal control, *p < 0.01 versus control.
FOXO4 reversed the effects of overexpressed miR-29a and miR-29b
The role of FOXO4 was further evaluated by overexpression in HG-stimulated rMC-1 cells in the presence of the miR-29a or miR-29b mimic. The results revealed that both miR-29a and miR-29b mimics markedly decreased the expression of FOXO4 (Figure 6(a)), GFAP, (Figure 6(b)) and VEGF (Figure 6(c)) but increased the expression of GS (Figure 6(d)). Moreover, both the miR-29a and miR-29b mimics significantly decreased the level of glutamate (Figure 6(f)). Overexpressed FOXO4 abolished the effects of the miR-29a and miR-29b mimics. The Western blot revealed the same expression trends of GFAP, VEGF and GS as those observed with the real-time PCR analysis (Figure 6(e)).
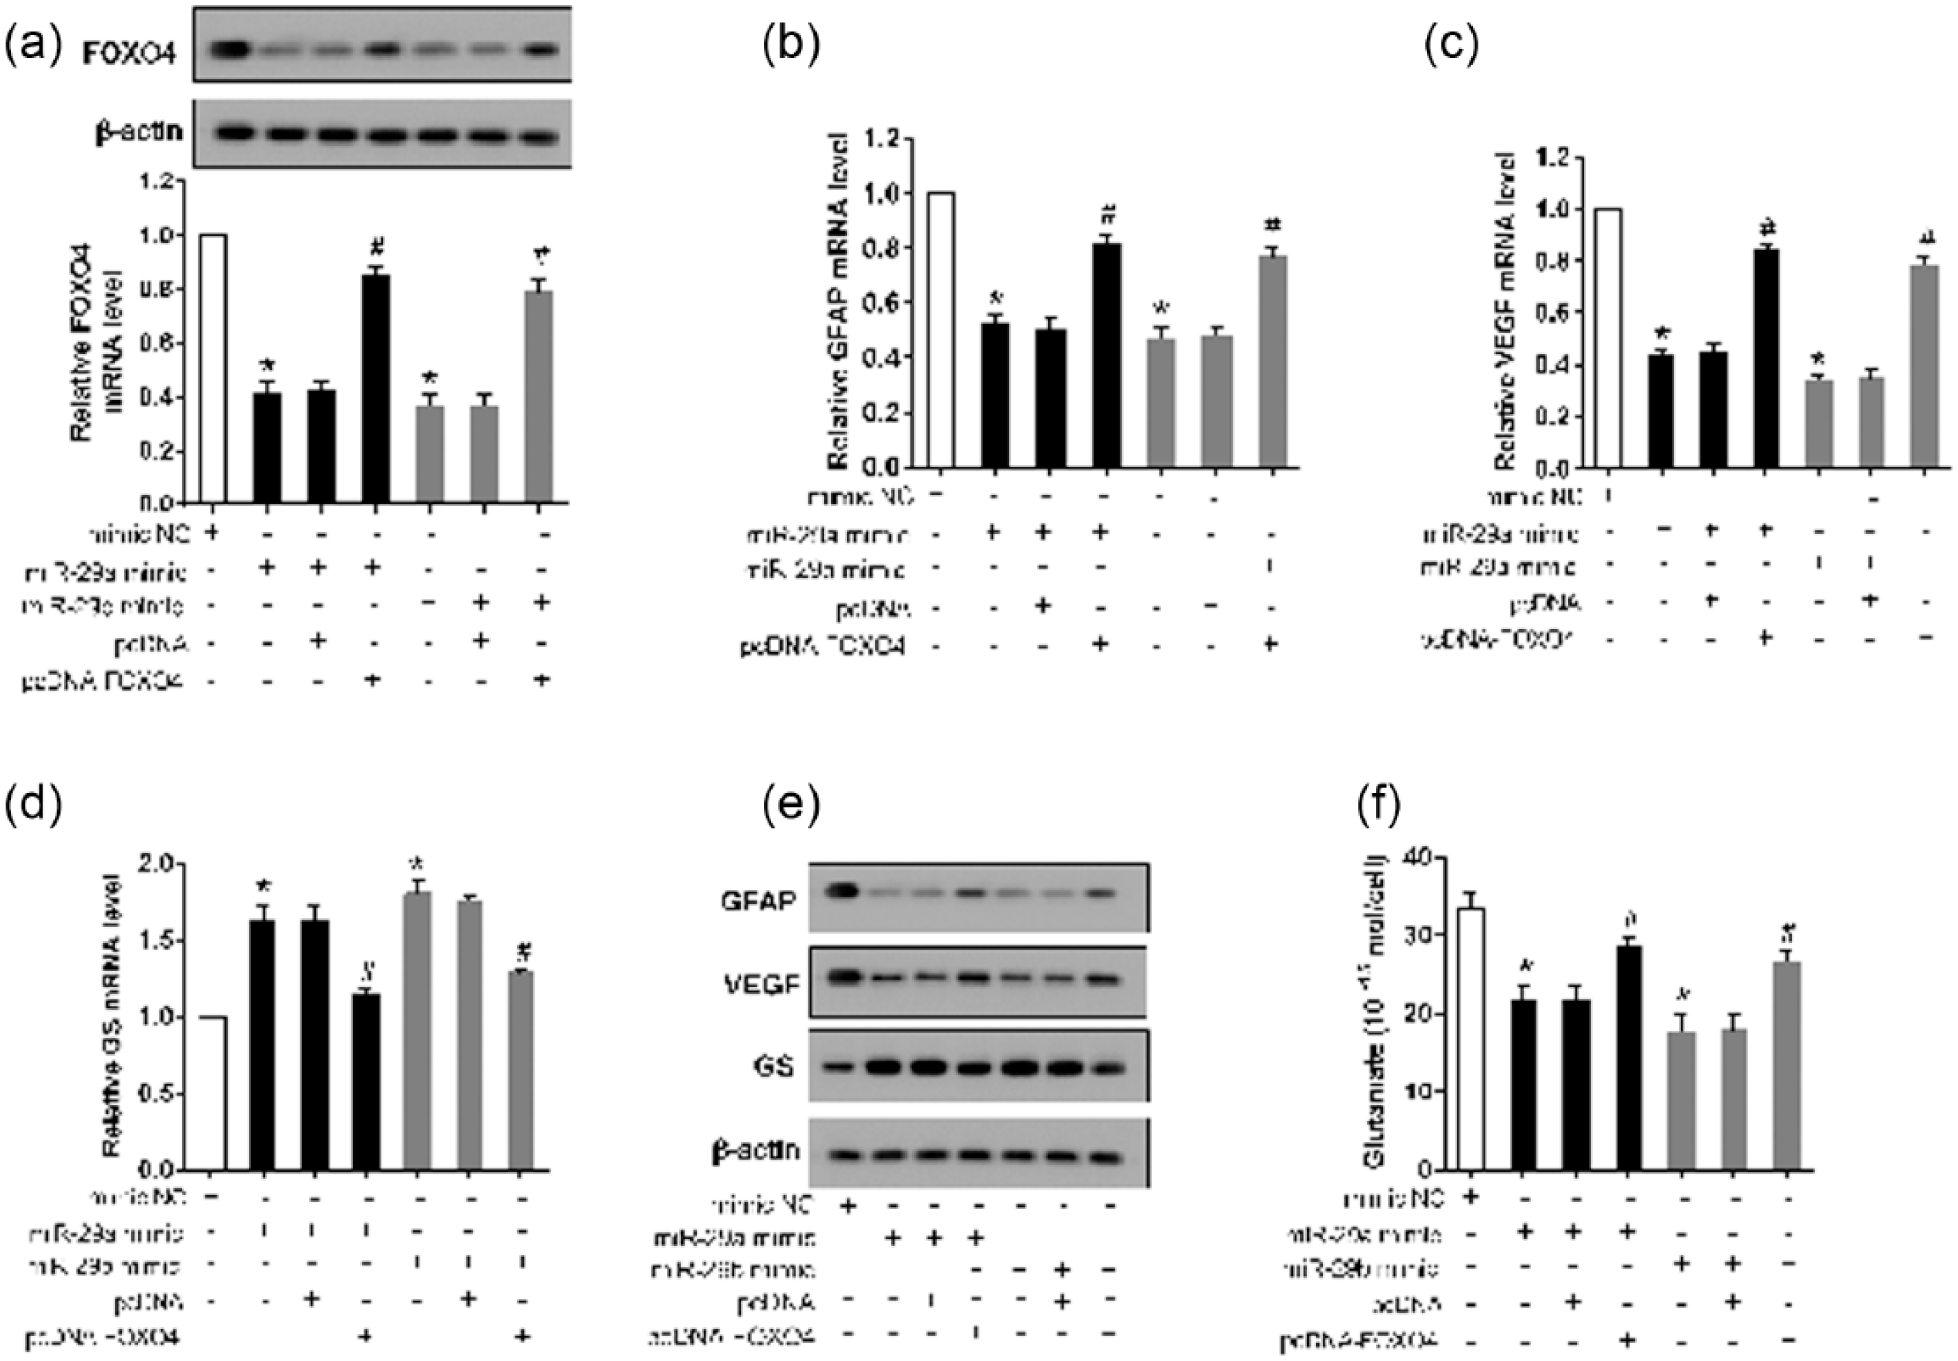
Overexpressed FOXO4 reversed the effects of miR-29a and miR-29b overexpression on GFAP, VEGF, GS and glutamate. (a) rMC-1 cells were co-transfected with an miR-29a mimic or miR-28b mimic and pcDNA-FOXO4 and supplemented with HG for 72 h. Real-time PCR and Western blot analyses were carried out to detect the expression of FOXO4. (b)–(d) Real-time PCR was used to determine the mRNA levels of GFAP, VEGF and GS. (e) A Western blot was performed to detect the protein expression of GFAP, VEGF and GS. (f) HPLC was used to measure the glutamate content. β-actin served as an internal control, *p < 0.01 versus mimic control; #p < 0.01 versus miR-29a/b mimic + pcDNA.
Discussion
Müller cells are symbolic DR cells in DM. Early DR pathology is often accompanied by increased expression of GFAP, which is a sensitive nonspecific biomarker of the response to retinal injuries and diseases.13,16 Previous studies indicated that Müller cells were a source of retinal VEGF in diabetic rats and that VEGF derived from Müller cells played an important role in retinal inflammation in DR. Studies also demonstrated that DR often resulted in an accumulation of retinal glutamate and downregulation of GS in Müller cells and that this led to excitotoxicity, particularly in retinal neurons.17,18 A previous study accelerated Müller cell function in DR based on the expression of GFAP, VEGF and GS, as well as the level of glutamate. 19 In this study, the expression of GFAP and VEGF increased, whereas that of GS decreased, in Müller cells of DM rats and HG-stimulated rMC-1. Furthermore, the glutamate level increased in Müller cells of DM rats and HG-stimulated rMC-1. These findings are in accordance with those of a previous study, indicating the feasibility of the results (Figure 7).
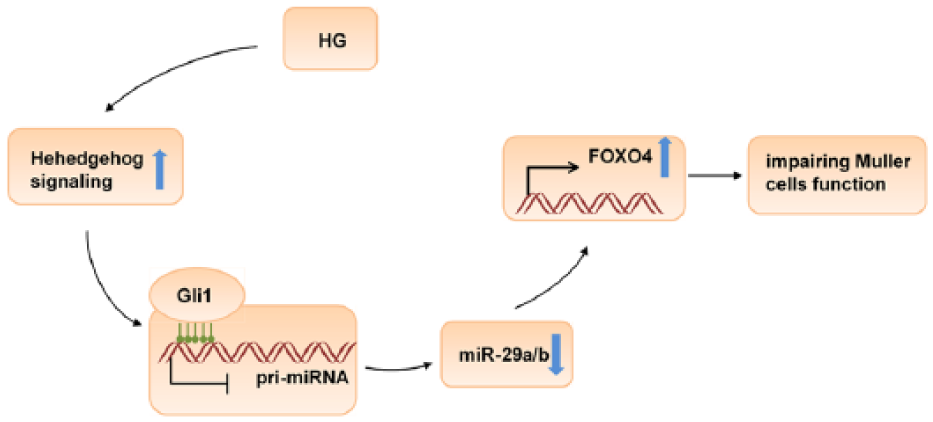
The role of miR-29, FOXO4, Gli1 and SHH in Müller cells in DR.
DR is a neurodegenerative disease. SHH, a glycoprotein expressed in the nervous system, is widely accepted as a molecular marker of DR. A previous study showed that the expression of SHH altered the function of Müller cells in DR and that SHH had a neuroprotective function in DR. 20 Research also demonstrated that the SHH pathway was activated in DR models. 21 In this study, the expression of both SHH and Gli1 was significantly increased in Müller cells, pointing to potential roles of SHH and Gli1 in the pathogenesis of DR. Furthermore, Gli1 directly regulated the expression of miR-29a and miR-29b. In addition, treatment of rMC-1 cells with cyclopamine, an inhibitor of the SHH pathway, significantly promoted luciferase activity of miR-29a/b but did not affect the activity of the 3′UTR of Mut-Gli. Based on these findings, we concluded that SHH-Gli1 signalling directly regulated the expression of miR-29a and miR-29b.
Due to its multiple functions, the miR-29 family has been widely studied. Inhibition of the expression of miR-29a/b/c via transforming growth factor β1 (TGF-β1) promoted the expression of extracellular matrix (ECM) and renal fibrosis. 22 In addition, miR-29a mediated the pathogenesis of type 2 diabetes, 23 and miR-29a overexpression attenuated the action of insulin by targeting PI3K on the PEPCK gene in HepG2 cells. 24 In this study, the results of the luciferase reporter assay revealed that both miR-29a and miR-29b targeted FOXO4. In addition, overexpressed miR-29a/b reversed the effect of HG, and overexpressed FOXO4 reversed the effect of miR-29a/b overexpression. These results indicated that FOXO4 mediated miR-29a/b–regulated DR. Zhang et al. 14 reported that HG stimulation significantly promoted the expression of FOXO4 and that α-melanocyte–stimulating hormone (α-MSH) seemed to reverse this effect in retinal vascular endothelial cells. In this study, FOXO4 was expressed in both Müller cells and retinal vascular endothelial cells. The potential role of miR-29a/b in regulating FOXO4 expression in retinal vascular endothelial cells and mediating the mechanism underlying the pathogenesis of DR requires further study.
In summary, the SHH-Gli1 signalling pathway regulated the expression of miR-29a/b, and downregulation of miR-29a/b promoted the onset and progression of DR, mediated by FOXO4. The findings provide insight into miR-29a/b–induced DR. Therapies based on the expression of miR-29a/b may play a role in DR treatment in the future.
Footnotes
Declaration of conflicting interests
The author(s) declared no potential conflicts of interest with respect to the research, authorship and/or publication of this article.
Funding
The author(s) disclosed receipt of the following financial support for the research, authorship, and/or publication of this article: The research was supported by Natural Science Foundation Project of Zhejiang (NO. LY18H120002).