
Abstract
Objective:
This study aimed at validating photoplethysmography for assessing bilateral blood pressure differences through investigating the correlations of digital volume pulse with arteriosclerosis risk.
Methods:
Totally, 111 subjects (70 healthy and 41 diabetic) were recruited. Demographic, blood pressure and anthropometric data were recorded. Blood was collected for determining serum cholesterol, total triglyceride, total cholesterol, high-/low-density lipoprotein cholesterol, fasting blood sugar and glycated haemoglobin concentrations. Arterial stiffness was assessed with electrocardiogram-based pulse wave velocity, crest time and inter-digital volume pulse differences.
Results:
Receiver operating characteristic curve demonstrated high inter-digital volume pulse difference sensitivity to glycated haemoglobin level over 6.5%. Linear regression analysis demonstrated significant correlation between inter-digital volume pulse difference and electrocardiogram-based pulse wave velocity (r = 0.692, p < 0.001). Compared with electrocardiogram-based pulse wave velocity, inter-digital volume pulse difference exhibited highly significant correlations with age, glycated haemoglobin level, pulse pressure, total cholesterol/high-density lipoprotein ratio, crest time, high-density lipoprotein and systolic blood pressure (all ps < 0.001).
Conclusion:
In conclusion, the results not only demonstrated successful application of a novel non-invasive waveform contour index, inter-digital volume pulse difference, in differentiating young from aged subjects and patients with good diabetic control from those with poor diabetic control but also validated its use in identifying arteriosclerosis risks. The results, therefore, endorse its domestic application as non-invasive tool for arteriosclerosis risk screening.
Keywords
Introduction
Since a decade ago, the European Society of Hypertension (ESH) and the American Heart Association (AHA) have both advocated blood pressure measurement from both arms to enhance accuracy.1,2 The latest guideline from ESH and European Society of Cardiology (ESC) suggests that a consistent difference in systolic blood pressure (SBP) between both arms over 10 mmHg is associated with increased cardiovascular risk. 3 However, measurement methodology has been shown to influence the results.4,5 Accordingly, simultaneous assessment at both arms with one or two automatic devices and multiple readings have been suggested to prevent overestimation and observer bias.4,5 Nevertheless, to date, inter-arm blood pressure difference (IABPD) has not been demonstrated to be able to detect subtle vascular changes caused by systemic diseases. Digital volume pulse (DVP), a circulatory waveform signal acquired non-invasively through photoplethysmography (PPG), is related to the pulsatile volume of blood in tissue. 6 This study aimed at (1) testing the hypothesis that DVP from bilateral index fingers can reflect risks of arteriosclerosis and (2) assessing the sensitivity of this novel approach in evaluating disease severity in individuals with advanced ages and patients with type 2 diabetes mellitus as age 7 and diabetes 8 are known contributors to arterial stiffness.
Methods
Study populations and grouping
Between July 2009 and October 2010, totally 111 testing subjects (i.e. 70 healthy and 41 diabetic) were recruited. Diabetes was defined as either a fasting sugar >126 mg/dL or glycated haemoglobin (HbA1c) > 6.5%. 9 Patients with a body mass index ≥30, habitual smokers and those with known subclavian stenosis, Raynaud’s syndrome or diabetic neuropathy that may affect peripheral circulation and those receiving follow-up for less than 2 years were excluded. However, 70 healthy subjects were enrolled from an annual physical check-up programme. A questionnaire was given to each testing subject to obtain demographic and anthropometric data as well as medical history. The subjects were divided into four groups: healthy young (Group 1, 20 ≤ age ≤ 40, n = 35), healthy upper middle-aged (Group 2, age > 40 years, n = 35), well-controlled diabetic (Group 3, age > 40 years, n = 20) and poorly controlled diabetic (Group 4, age > 40 years, n = 21). Poorly controlled (Group 4) and well-controlled (Group 3) diabetes were defined as a recent HbA1c level (i.e. within 1 month) higher and lower than 8%, respectively. 9 The study was approved by the Institutional Review Board (IRB) of our institutes. Informed consents were obtained from all subjects.
Study protocol
Blood samples were collected after 6-h fasting for determining the levels of serum total cholesterol (TC), triglyceride, high-/low-density lipoprotein cholesterol (HDL-C/LDL-C), fasting blood sugar and HbA1c. Vascular stiffness indices included electrocardiogram-based pulse wave velocity (ECG-PWV), crest time (CT) and inter-digital volume pulse differences (IDVPD).
To avoid circadian effect on autonomic function, 10 measurements were taken in the morning (i.e. 8:30–10:30 a.m.). All subjects refrained from caffeine-containing beverages and theophylline-containing medications for 8 h before hospital visit. All participants were allowed to relax in a supine position for 5 min in a quiet room with temperature control at 26°C ± 1°C. ECG-PWV was obtained through simultaneous acquisition of ECG and DVP signals from bilateral index fingers for 10 min. 11 Excessive variations in waveform amplitudes presenting as outliers were removed during the computation process. Blood pressure was obtained once over the left arm of the supine subjects using an automated oscillometric device (BP 3AG1; Microlife Corporation, Taiwan) with an appropriate cuff size.
Rationale for using differences in DVP for assessing arteriosclerosis
Previous studies have demonstrated DVP as an assessment tool for arterial stiffness. 12 As a pilot study, one representative subject was chosen from each group to obtain 100 waveforms from each index finger from both sides (Figure 1). The results showed substantially higher variations in the pulse wave amplitude in the healthy young subject (Figure 1(Aa) and (Ab)) compared to those in the patient with poorly controlled diabetes (Figure 1(Da) and (Db)). However, the differences in amplitudes between waveforms acquired from both sides were smallest in the healthy young subject (Figure 1(Ac)) and largest in the patient with poorly controlled diabetes (Figure 1(Dc)), suggesting that the differences in DVP waveform amplitudes acquired through PPG between both sides may serve as an indicator of the risk of arteriosclerosis similar to that reported for IABPD. Therefore, this study tested the validity of IDVPD in identifying risks of arteriosclerosis in aged and diabetic subjects.
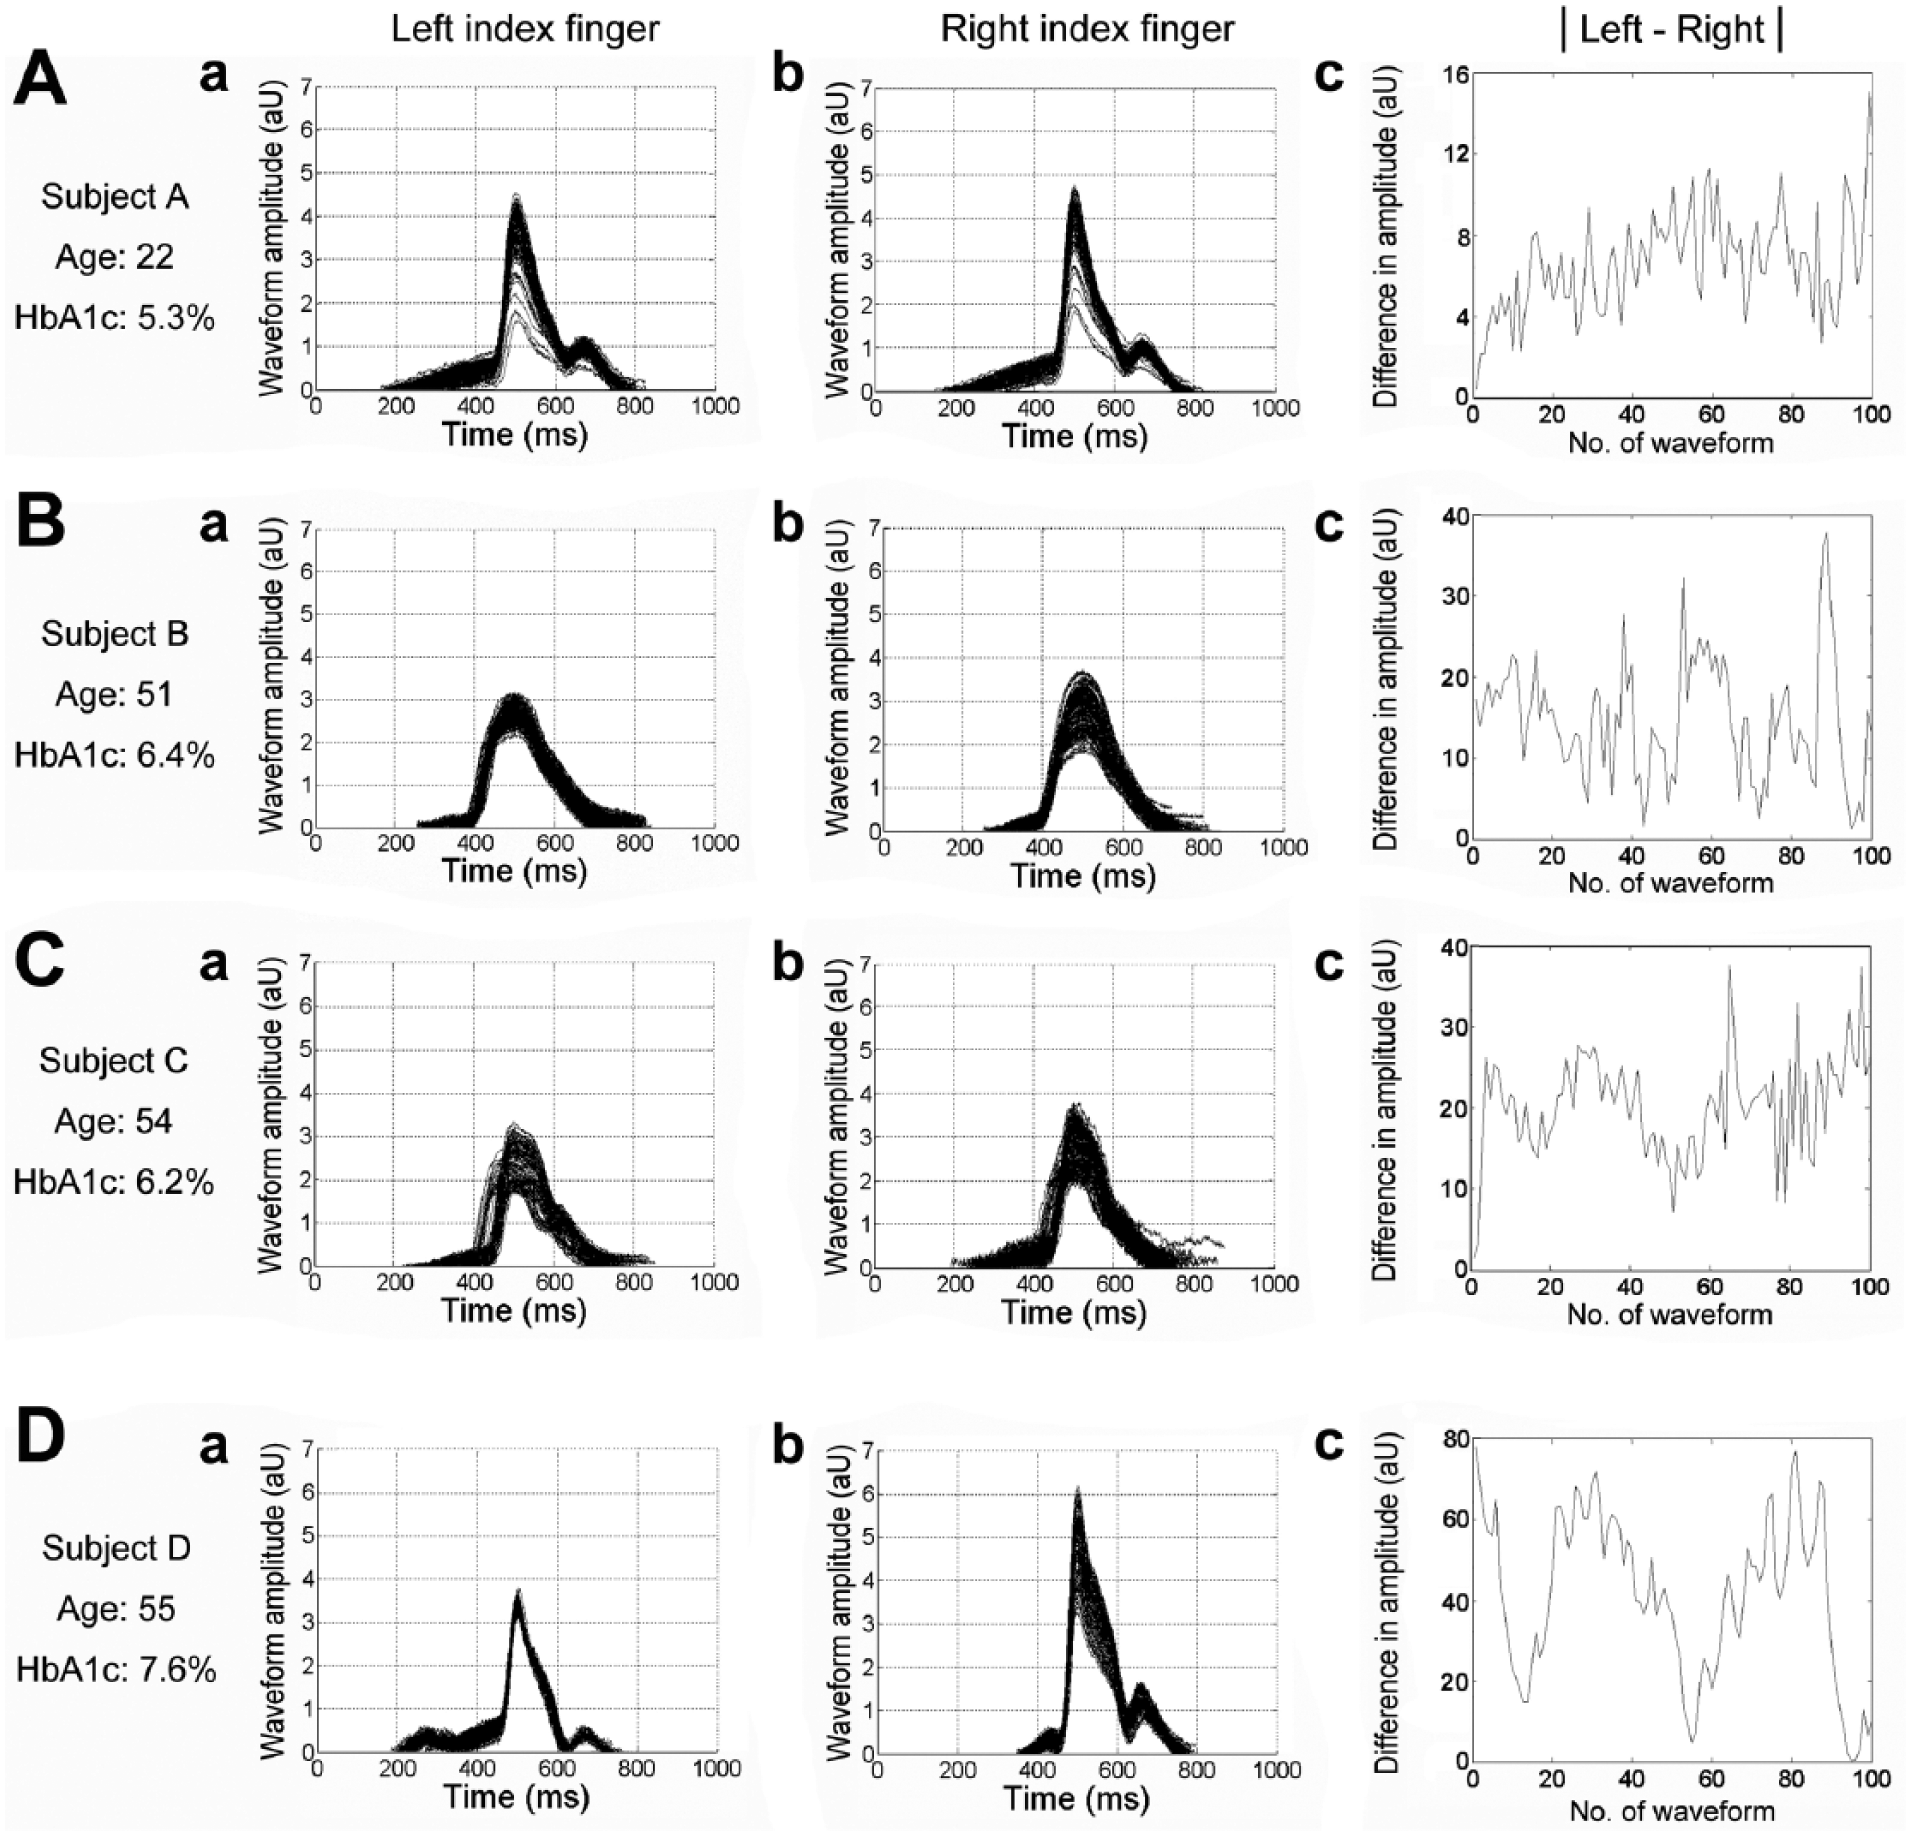
A total of 100 consecutive digital volume pulse (DVP) signals from one representative subject in each group shows (a) waveform signals from the left index finger, (b) right index finger and (c) the absolute values of the difference in amplitude between both sides. Note the progressive increase in amplitude difference from (A) subject A (6.77 ± 3.13 mV), (B) subject B (14.81 ± 8.91 mV), (C) subject C (20.34 ± 7.02 mV), to (D) subject D (43.34 ± 19.64 mV). Subject A: healthy young individual from Group 1, subject B: healthy upper middle-aged subject from Group 2, subject C: patient with well-controlled diabetes from Group 3 and subject D: patient with poorly controlled diabetes from Group 4.
Computation of IDVPD
The computation of IDVPD was attained through six major steps: (1) within each 10-min recording, photoplethysmographic (PPG) waveforms with amplitudes over mean plus 1.5 times of standard deviation (SD) (i.e. outliers) were removed; (2) the waveform amplitudes on both sides were computed from a 2-min segment; (3) the respective SDs were calculated; (4) the amplitudes of each group of data were divided by their SD (i.e. normalization) to create new amplitude series; (5) the mean amplitudes on both sides were obtained; and (6) the differences in mean amplitudes between left and right sides were divided by the mean amplitude (i.e. either right or left) with the larger value chosen as the denominator, followed by 100% multiplication to give IDVPD.
Results
Demographic, haemodynamic and biochemical characteristics of the study subjects
Although no significant difference was noted in diastolic blood pressure among the four groups, significant and progressive elevations were noted in SBP, HbA1c, TC/HDL-C ratio and fasting serum glucose from Group 1 to Group 4. Besides, both CT and IDVPD exhibited progressive and significant increases from Group 1 to Group 4 (CT: p < 0.05; IDVPD: p < 0.001).
Sensitivity of IDVPD and ECG-PWV with reference to HbA1c
Receiver operating characteristic (ROC) curve showed a high sensitivity of IDVPD to an HbA1c level over 6.5% (i.e. a diagnostic criterion of diabetes). The sensitivity was substantially higher than that of ECG-PWV [area under the curve for IDVPD and ECG-PWV was 0.905 (95% confidence interval (CI) = 0.846–0.965) and 0.786 (95% CI = 0.693–0.879), respectively, p < 0.0001]. The cut-off point for IDVPD was 22.23% (sensitivity = 0.906, specificity = 0.848).
Correlation between IDVPD and ECG-PWV
Bland–Altman analysis showed satisfactory consistency between the two parameters after normalization (mean = 0.001, SD = 0.784) within 95% CI. Linear regression analysis demonstrated a highly significant correlation (r = 0.692, p < 0.001).
Relationship between IDVPD and the risk factors for cardiovascular disease and metabolic disorder
Pearson’s correlation analysis on the significance of associations of IDVPD and ECG-PWV with the risk factors of cardiovascular diseases showed significant correlations between both indices and all anthropometric, biochemical and haemodynamic parameters. On the one hand, IDVPD is highly correlated with HbA1c (p < 0.001) and is moderately correlated with age, waist circumference, triglyceride, TC, LDL, SBP, pulse pressure (PP), fasting serum glucose, TC/HDL ratio and CT (all ps < 0.05) and is modestly correlated with body mass index. On the other hand, IDVPD is moderately negatively correlated with HDL (p < 0.05).
Discussion
Based on the concept of haemodynamic discrepancy between both sides of the extremities as an indicator of cardiovascular diseases,7–9 this study investigated the validity of a novel non-invasive waveform contour index, IDVPD, in identifying the risk of arteriosclerosis in the aged individuals and diabetic patients. Not only did the study demonstrate that the index successfully differentiated between young and aged subjects as well as between patients with satisfactory and poor diabetes control, but it also showed high sensitivity to HbA1c and consistency with ECG-PWV and CT. Moreover, its highly significant correlations with the risk factors of cardiovascular diseases and metabolic syndrome suggest the possibility of its being used as a non-invasive, convenient and economical tool for early detection of arterial stiffness suitable for domestic use.
Footnotes
Declaration of conflicting interests
The author(s) declared no potential conflicts of interest with respect to the research, authorship and/or publication of this article.
Funding
This work was supported by Research Grants from the Ministry of Science and Technology, Taiwan (Grant Nos NSC 102-2221-E-259-004 and MOST 103-2221-E-259-011).