
Abstract
Aims:
To investigate the possible protective effect of elevated undercarboxylated osteocalcin on diabetic cardiomyopathy mechanisms and risk factors.
Methods:
In all, 32 male rats were divided into four groups: control, diabetic, diabetic warfarin and normal warfarin–treated groups. Isolated heart functions were assessed; fasting serum insulin, glucose and glycosylated haemoglobin, homeostasis model assessment insulin resistance and lipid profile were investigated. Serum undercarboxylated osteocalcin and adiponectin were also measured. In cardiac tissue, malondialdehyde content, acyl-CoA dehydrogenase gene expression, Bax/Bcl2 ratio, sarcoendoplasmic reticulum calcium ATPase and osteocalcin receptor (G protein–coupled receptor family C group 6 member A) genes expression were investigated.
Results:
Prophylactic elevation of undercarboxylated osteocalcin was accompanied by improved insulin sensitivity and lipid profile, increased serum adiponectin, upregulated myocardial osteocalcin receptor with preserved left ventricular function, decreased cardiac malondialdehyde content, acyl-CoA dehydrogenase and Bax/Bcl2 ratio.
Conclusion:
Undercarboxylated osteocalcin was suggested to have protective effects against diabetic cardiomyopathy, possibly through direct action on upregulated G protein–coupled receptor family C group 6 member A and indirectly via adiponectin. These effects may be mediated through antagonizing oxidative stress and apoptosis.
Introduction
Diabetes mellitus (DM) is a major epidemic of this century, with rapidly increasing incidence and prevalence. The majority of diabetic patients succumb ultimately to heart disease, much of which stems from atherosclerosis and hypertension. 1 Despite, myocardial dysfunction was reported in diabetic patients in absence of hypertension and coronary artery disease. 2 This dysfunction is referred to as diabetic cardiomyopathy (DCM).
Left ventricular (LV) diastolic dysfunction was reported as the earliest detectable functional defect in DCM, later followed by progressive reduction in systolic function as well. 3
Several mechanisms underlie the pathophysiology of DCM. In diabetes, especially type II, hyperglycaemia is associated with impaired insulin signalling and consequently defective glucose oxidation. On the other hand, excess free fatty acid (FFA) release causes cardiac lipotoxicity, that is, increased lipid accumulation. In addition, genes involved in α-oxidation like acyl-CoA dehydrogenase are upregulated via activating peroxisome proliferator–activated receptor (PPAR)-α by excess fatty acid (FA) in diabetic myocytes. 1 This increases reactive oxygen species (ROS) generation, resulting in ROS-induced tissue injury via lipid peroxidation of polyunsaturated FAs in the cell membrane, producing toxic molecules, for example, malondialdehyde (MDA). 4
Apoptosis plays an important role in the development of DCM. Westermann et al. 5 proved the activated apoptotic pathways by measuring the cardiac expression of the apoptotic Bax and the anti-apoptotic Bcl2 genes.
Osteocalcin (OC) is a hormone secreted by osteoblasts. It undergoes posttranslational modification by γ-carboxylation, which facilitates its binding to hydroxyapatite. 6 The undercarboxylated osteocalcin (ucOC) is a hormone that favours glucose handling and increases energy expenditure. The absence of OC leads to glucose intolerance in mice, while genetically modified mice with increased ucOC were protected from type II diabetes and obesity. 7
Reduced total OC, elevated glucose and triglyceride levels are inter-related. Furthermore, serum OC level was associated with decreased risk of coronary heart disease (CHD) and protective metabolic changes in Chinese adults, 8 but being specifically protective against diabetic myocardial complications is still unclear.
Elevation of serum ucOC can be achieved by blockage of the carboxylation process, using vitamin K antagonists, for example, warfarin, 9 that acts by inhibiting vitamin K–dependent gamma carboxylases involved in the synthesis of coagulation factors and bone-derived proteins. 10
This work investigated the possible protective effects of elevating serum ucOC – using warfarin parenterally – on the development of DCM and associated risk factors. Moreover, the possibility of a direct action for OC on the myocardium was studied and the underlying mechanisms were investigated.
Materials and Methods
Materials
Warfarin powder was purchased from Sigma (St. Louis, MO, USA) and dissolved in alkaline aqueous solution, and injected subcutaneously (sc; 0.25 mg/kg) on three alternative days/week. 11
Streptozotocin (STZ) powder was purchased from Sigma and dissolved in citrate buffer (pH 4.5) and immediately injected intraperitoneally (ip) as recommended by the National Institute of Diabetes Animal Models of Diabetic Complications Consortium.
Animals
In all, 32 adult male albino rats, weighing 100–120 g were purchased from the animal care unit of Cairo Medical University. All experimental procedures were carried out in accordance with the guide for the care and use of laboratory animals published by the US National Institute of Health (NIH, 1985), and approved by the local ethical and scientific committee (Faculty of Medicine Cairo University). All animals were housed in wire mesh cages in a conditioned atmosphere at 25°C, humidity 50%–55%, with a 12-h light/dark cycles and had free access to food and water.
Study design
After 1 week of stabilization, rats were randomly divided into four groups; eight rats each. In the control group (1), rats were fed standard rodent diet (STD: 6.5% kcal fat), and on day 14, 0.5 mL of citrate buffer was injected ip, followed after 24 h by another similar dose, and then they received sc alkaline aqueous solution (0.5 mL) for three alternative days/week, for 8 weeks. In diabetic group (2), and diabetic warfarin–treated group, beginning on day 0, animals were fed a high-fat diet (HFD: 60% kcal fat) for a period of 2 weeks. On day 14, rats on the HFD were injected ip with the first low dose of STZ (30 mg/kg in 0.01 M citrate buffer, pH 4.3) followed after 24 h by a similar second dose to induce type II DM. 12 Type II diabetes was confirmed in HFD rats by measuring fasting serum glucose and insulin 3 days after STZ injection and then all rats were fed STD till the end of the work. After that, rats of group 2 were left diabetic, receiving only sc aqueous injection just as the control group for 8 weeks, a duration supposed to be enough for developing DCM. 12
Diabetic warfarin–treated group rats received warfarin injection sc, started at onset of diabetes, as prophylaxis, and continued also for 8 weeks. In group (4) (normal warfarin–treated group), normal rats were injected by warfarin for 8 weeks. 11 All rats were sacrificed after 10 weeks from the start of the work.
In warfarin-treated groups (3 and 4), 11 rats died bleeding from different injuries. Those rats were substituted, and then all studied rats were separated, each in a cage, to avoid injuring one another. Later, only one rat died from group 3 and was also substituted.
Study procedures
At the end of the study, all rats were subjected to overnight fasting, blood samples were collected from the retro-orbital plexus for the assessment of fasting serum glucose and insulin, homeostasis model assessment–insulin resistance (HOMA-IR) calculation, glycosylated haemoglobin, lipid profile [triglycerides, very-low-density lipoprotein (VLDL) and high-density lipoprotein (HDL) cholesterol], serum ucOC and serum adiponectin, and then the rats isolated hearts were functionally assessed by recording the left ventricular developed pressure (LVDP), ΔP/ΔT (contractility index), −ΔP/ΔT (diastolic index) using the Powerlab data acquisition system (ADInstruments Pty Ltd, Australia), aided by Langendorff apparatus for heart perfusion, and finally cardiac tissue samples were collected for measuring MDA content, acyl-CoA dehydrogenase, sarcoendoplasmic reticulum calcium ATPase (SERCA) gene expression, the pro-apoptotic marker Bax and the anti-apoptotic marker Bcl2 gene expression (Bax/Bcl2 ratio was calculated), and OC receptor [G protein–coupled receptor family C group 6 member A (GPrc6A)] expression.
Assessment of isolated heart function
Under aseptic conditions, animals were heparinized by ip injection of heparin (1000 IU), anaesthetized using ketamine hydrochloride (25 mg/kg, ip), left thoracotomy was performed and hearts were exposed, excised and immediately placed in ice cold Kreb–Henseleit (KH) heparinized solution. The ascending aorta was cannulated and placed along the perfusion line of a non-recirculating constant flow Langendorff apparatus (Radnoti; Harvard Apparatus, USA). Hearts were perfused using KH buffer, pH 7.4 [25 NaHCO3, 4.7 KCl, 118.5 NaCl, 1.2 MgSO4, 1.2 KH2PO4, 2.5 CaCl2 and 10 glucose (in mM); Sigma Aldrich, USA]. Perfusion was maintained at a constant flow of 16 mL/min at 37°C and aerated with gas mixture (95% O2, 5%CO2). Hearts were allowed to beat spontaneously.
To determine LV pressure, a latex balloon was inserted into the LV through an incision in the left atrial appendage. The balloon was filled with saline to give an end-diastolic pressure of ~0–10 mmHg. Hearts were then placed in water jacketed heart chamber (Radnoti) maintained at 37°C and allowed to stabilize for 30 min. The intraventricular balloon catheter was then connected to a pressure transducer (MLT 844, Australia).
LV pressure was monitored continuously and recorded on a computer. Digital analysis of the wave was then performed and displayed by software of Powerlab (Labchart 7). LV function was assessed by LVDP defined as peak systolic minus end-diastolic pressure, maximum rate of pressure rise ΔP/ΔT (as indices for contractility) and maximum rate of pressure decline −ΔP/ΔT (as an index for diastole). Parameters were recorded continuously for 15 min. 13
Biochemical assessment
Fasting serum glucose
The serum glucose was assayed by the method adopted by Trinder. 14
Fasting serum insulin
Insulin concentrations were measured in previously frozen and thawed serum samples by enzyme-linked immunosorbant assay (ELISA) using the Rat Insulin ELISA Kits (Linco research).
HOMA-IR
For the assessment of peripheral insulin resistance, HOMA index was calculated as follows: HOMA = glucose (mmol/dL) × insulin (µIU/mL)]/22.5. A HOMA number of more than 2.0 was taken as sensitive. 15
Measuring glycosylated haemoglobin
Ion-Exchange Chromatography Kit supplied by Crystal Chem, USA.
Lipid profile
Serum triglycerides were measured by quantitative – enzymatic –colorimetric determination (Boehringer, Germany). HDL and low-density lipoprotein (LDL)/VLDL Cholesterol Assay Kit was purchased from Cell Biolabs, Inc., USA.
Measuring serum ucOC
ucOC was measured by Rat ucOC ELISA Kit purchased from MyBioSource (USA).
Measuring serum adiponectin
Serum adiponectin was measured using Rat Total Adiponectin/Acrp30 Immunoassay (Quantikine ELISA) Kit from R&D Systems Europe, Ltd.
Measuring MDA
To measure the MDA concentration, 100 mg of heart tissue in 1 mL phosphate-buffered saline (PBS), pH 7.0, was homogenized with micropestle in microtube. Trichloroacetic acid (TCA) of 20% was added to tissue homogenate to precipitate the protein and centrifuged. Supernatants were collected and thiobarbituric acid (TBA) solution was added to the supernatants. After boiling, the absorbance was measured. Concentration of MDA in supernatants of heart homogenate was calculated using the standard curve. 16
Detection of acyl-CoA dehydrogenase, Bax, Bcl2, GPRC6A and SERCA gene expression by real-time quantitative reverse transcription polymerase chain reaction
Total RNA was extracted from frozen samples using TRIzol® reagent (Invitrogen, USA) according to a standard protocol. The isolated total RNA was converted into complementary DNA (cDNA) using Moloney murine leukaemia virus (M-MLV) reverse transcriptase (Promega, USA). Real-time polymerase chain reaction (PCR) was performed using an ABI 7500 Real-Time PCR System (Applied Biosystems, USA) and an SYBR® Green PCR Master Mix (Applied Biosystems) in a final volume of 10°µL with the following thermal cycling conditions: 95°C for 10 min, followed by 40 cycles of 95°C for 15 s and 60°C for 1 min. The sequences of PCR primer pairs used for each gene are shown in Table 1. Data were analysed with the ABI Prism sequence detection system software and quantified using the v1·7 Sequence Detection Software from PE Biosystems (USA). Relative expression of studied genes was calculated using the comparative threshold cycle method. All values were normalized to the β-actin genes as an invariant endogenous control (reference gene). 17
Measurement of fasting serum insulin, fasting serum glucose, HOMA-IR and glycosylated haemoglobin in the studied groups.
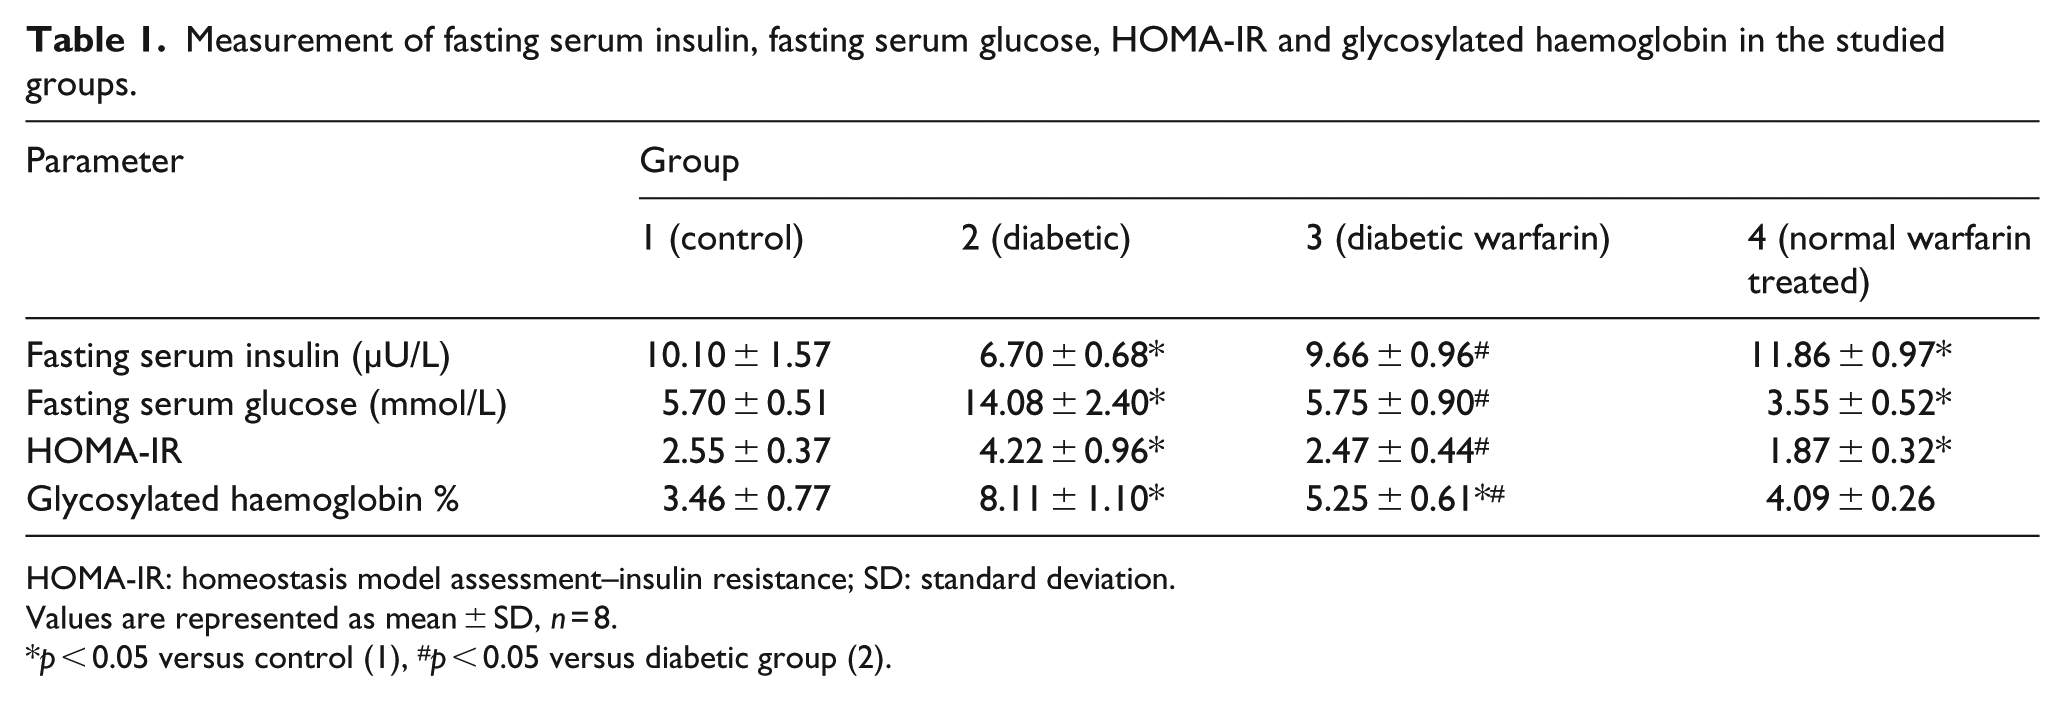
HOMA-IR: homeostasis model assessment–insulin resistance; SD: standard deviation.
Values are represented as mean ± SD, n = 8.
p < 0.05 versus control (1), #p < 0.05 versus diabetic group (2).
Sequences of the primers used for real-time PCR were Bax forward primer: 5′GGA CGA ACT GGA CAG TAA CAT GG3′ and reverse primer: 5′GCAAAGTAGAAAAGGGCGACAAC3′; Bcl2 forward primer: 5′ATCGCCCTGTGGATGACTGAG3′ and reverse primer: 5′CAG CCA GGA GAAATCAAACAGAGG3′; OC receptor (GPRC6A) forward primer: 5′CCAGTAGGGA GAGAATCAGGAGTAGGATGG3′ and reverse primer: 5′AGAGTTAAGGCTGTCATAGGT TCTGGGTACTCAG3′; acyl-CoA dehydrogenase forward primer: 5′TGCTGCTTTGGCTGTA TGTC 3′ and reverse primer: 5′TGAGCGTGAACAAGAACCAG3′; β-actin forward primer: 5′TGTTTGAGACCTTCAACACC3′ and reverse primer: 5′TAGGAGCCAGG GCAGTAA TC3′; SERCA forward primer: 5′-AATACCACTTGTTGGCTTA 3′ and reverse primer: 5′-A TGTGATGTTCCCATTAGAC-3′.
Statistical analysis
Statistical analysis was carried out using the statistical package SPSS version 22. Data were summarized using mean ± SD. Comparisons between groups were done using analysis of variance (ANOVA) with multiple comparisons post hoc test when comparing more than two groups and unpaired t test when comparing two groups. 18 Correlations between variables were done using Pearson correlation coefficients. p values <0.05 were considered as statistically significant.
Results
The changes in levels of fasting serum insulin, glucose, HOMA-IR and glycosylated haemoglobin
As shown in Table 1, type II DM was evidenced in diabetic group (2) by a significant increase in levels of fasting serum glucose, HOMA-IR and glycosylated haemoglobin with significant decrease in serum insulin compared to control group (p < 0.05). On the other hand, normal warfarin–treated showed significant decrease in fasting serum glucose, HOMA-IR and glycosylated haemoglobin, while serum insulin was significantly increased in comparison with the control group (p < 0.05). Indeed, warfarin prophylactic administration in diabetic warfarin group resulted in significant decrease in fasting serum glucose, HOMA-IR and glycosylated haemoglobin compared to values of diabetic group (p < 0.05), while serum insulin showed significant increase in comparison with the diabetic group (p < 0.05). No significant difference was observed in serum insulin, fasting serum glucose and HOMA-IR in diabetic warfarin–treated group in comparison with the control group indicating that these parameters were almost normalized with warfarin injection. However, glycosylated haemoglobin of that group still showed significantly increased values, in comparison with the control group (p < 0.05) (Table 1).
The results of serum lipids: triglycerides, HDL and VLDL cholesterol
Figure 1 shows that serum triglycerides and VLDL were significantly increased and HDL was significantly decreased in diabetic group compared to control group (p < 0.05), indicating the development of dyslipidaemia. On the contrary, serum triglycerides, VLDL and HDL cholesterol were markedly preserved in diabetic warfarin–treated group in response to warfarin injection and the consequently elevated ucOC, where triglycerides and VLDL showed significant decrease, while HDL was significantly increased in comparison with the control group (p < 0.05). In addition, normal warfarin–treated group showed significantly decreased VLDL cholesterol in comparison with the control group (p < 0.05), while serum triglycerides (TGs) and HDL showed insignificant differences compared to the control group.
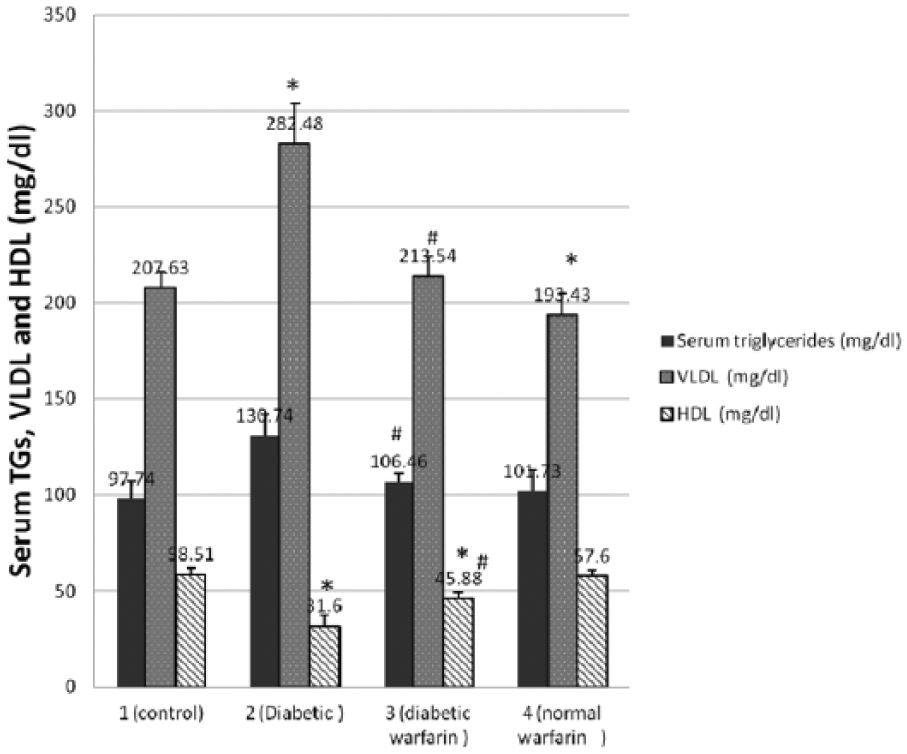
Serum TGs, VLDL and HDL (mg/dL) in the studied groups. Each vertical bar represents the mean of 8 animals ± SD.
The results of serum ucOC, serum adiponectin and GPRC6A gene expression in cardiac tissue
Type II DM was associated with a significant decrease in serum ucOC, adiponectin and OC receptor (GPRC6A) gene expression in the cardiac tissues (Figure 2(a) to (c)) compared to control group (p < 0.05). Warfarin injection resulted in significant increase in serum ucOC and serum adiponectin in normal rats of group (4), and both were also significantly increased in response to warfarin administration in diabetic rats of group (3), in addition to significantly increased GPRC6A gene expression in the myocardium of this group in comparison with the diabetic group (p < 0.05). However, these values were still significantly decreased in diabetic warfarin–treated group when compared to the control group (p < 0.05). Significant positive correlation was observed between serum ucOC and serum adiponectin and between serum adiponectin and OC receptor (GPRC6A) gene expression in cardiac tissue among the studied groups (Figure 3).
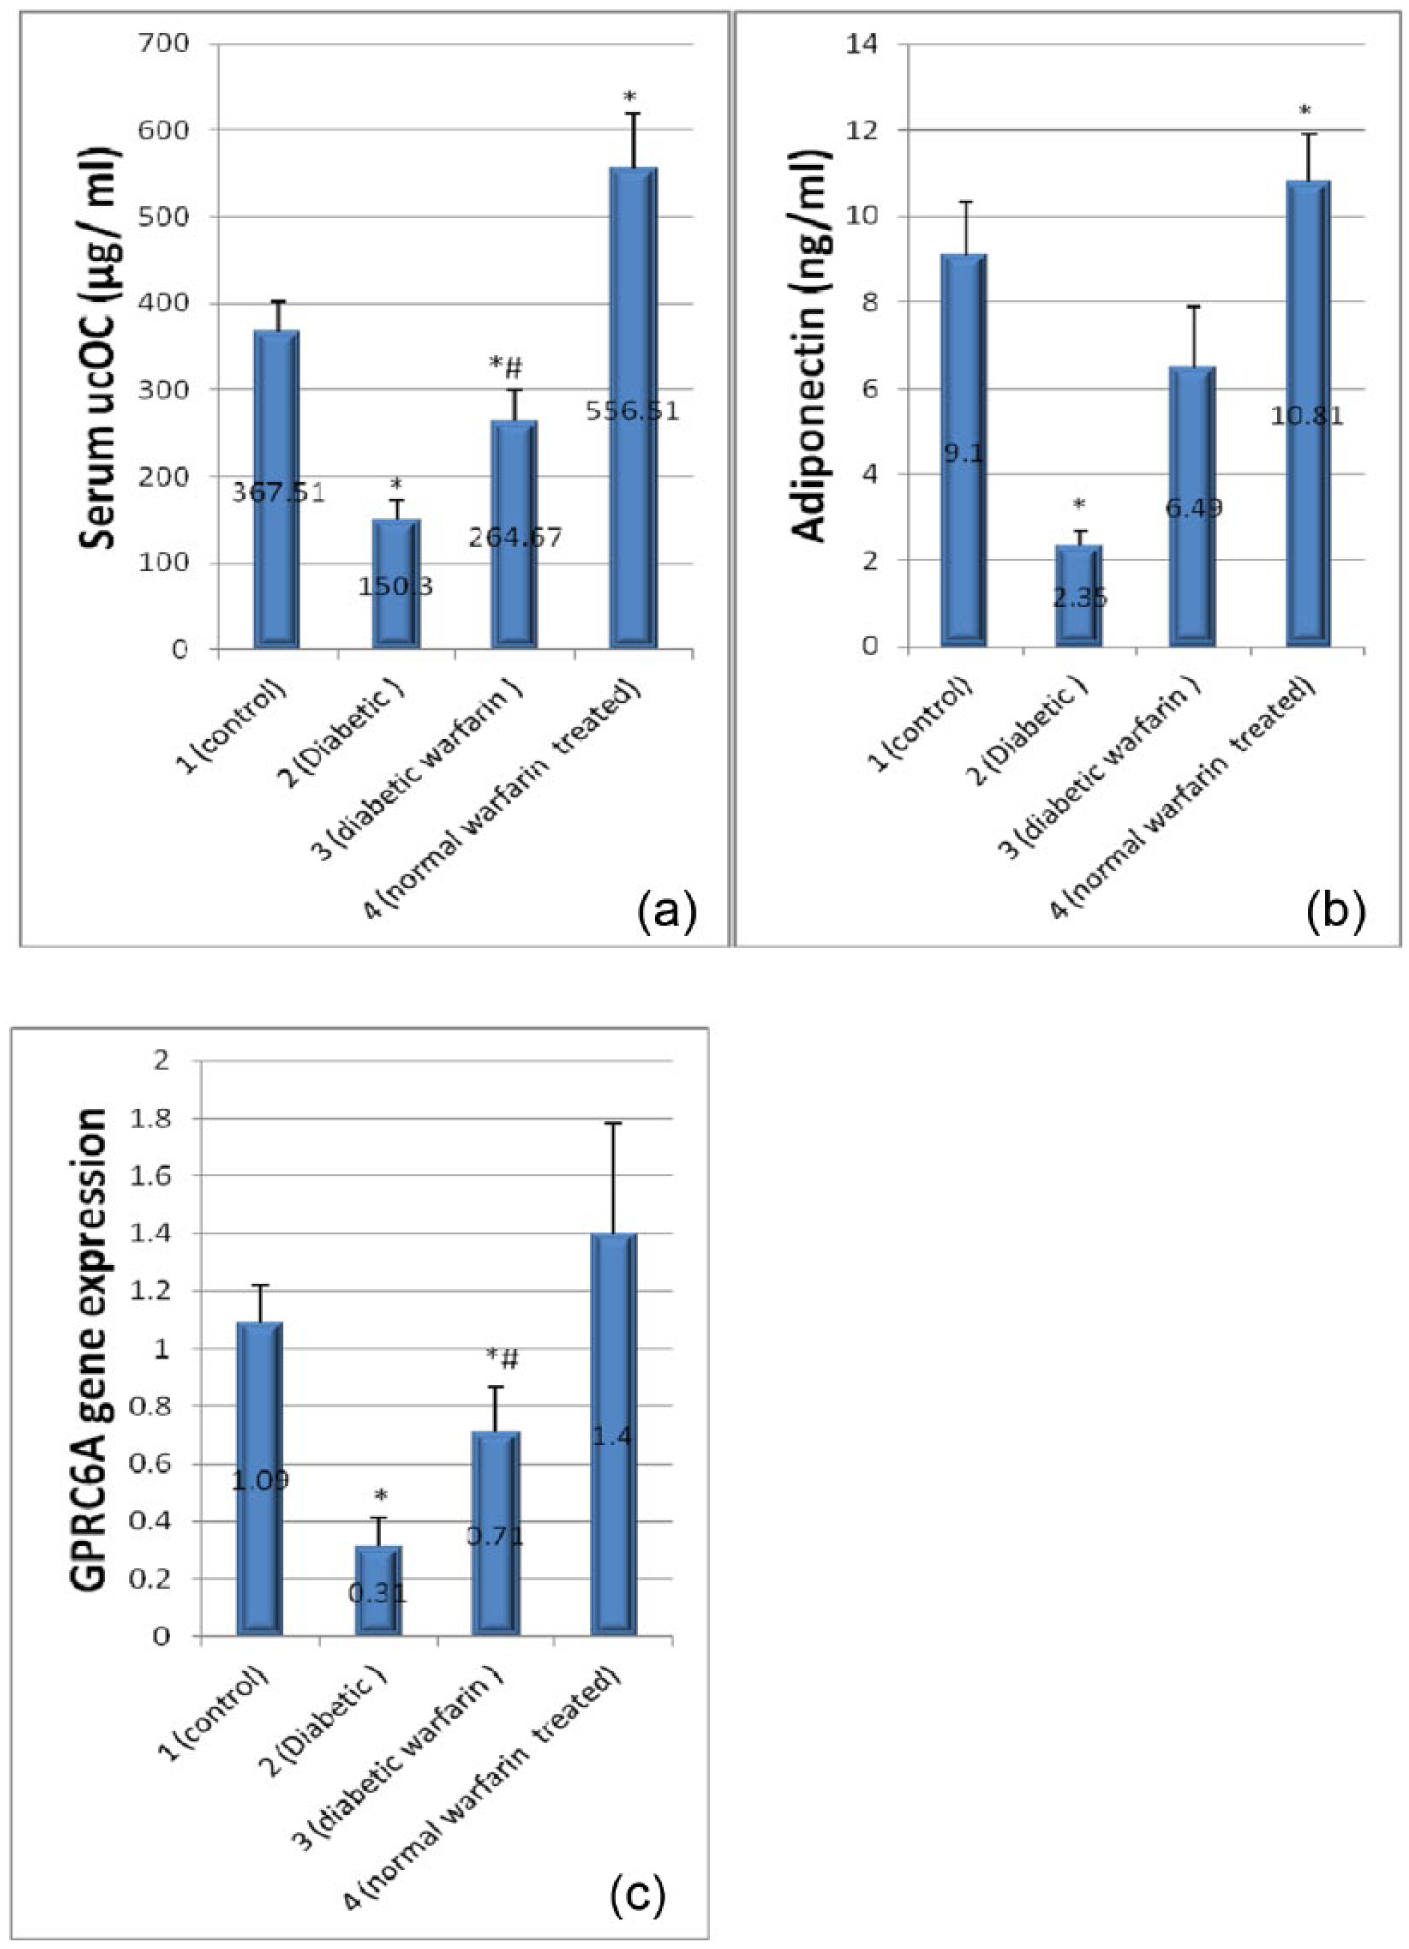
(a) Serum ucOC (µg/mL) in the studied groups, (b) serum adiponectin (ng/mL) in the studied groups and (c) OC receptor (GPRC6A) gene expression in the studied groups. Each vertical bar represents the mean of 8 animals ± SD.
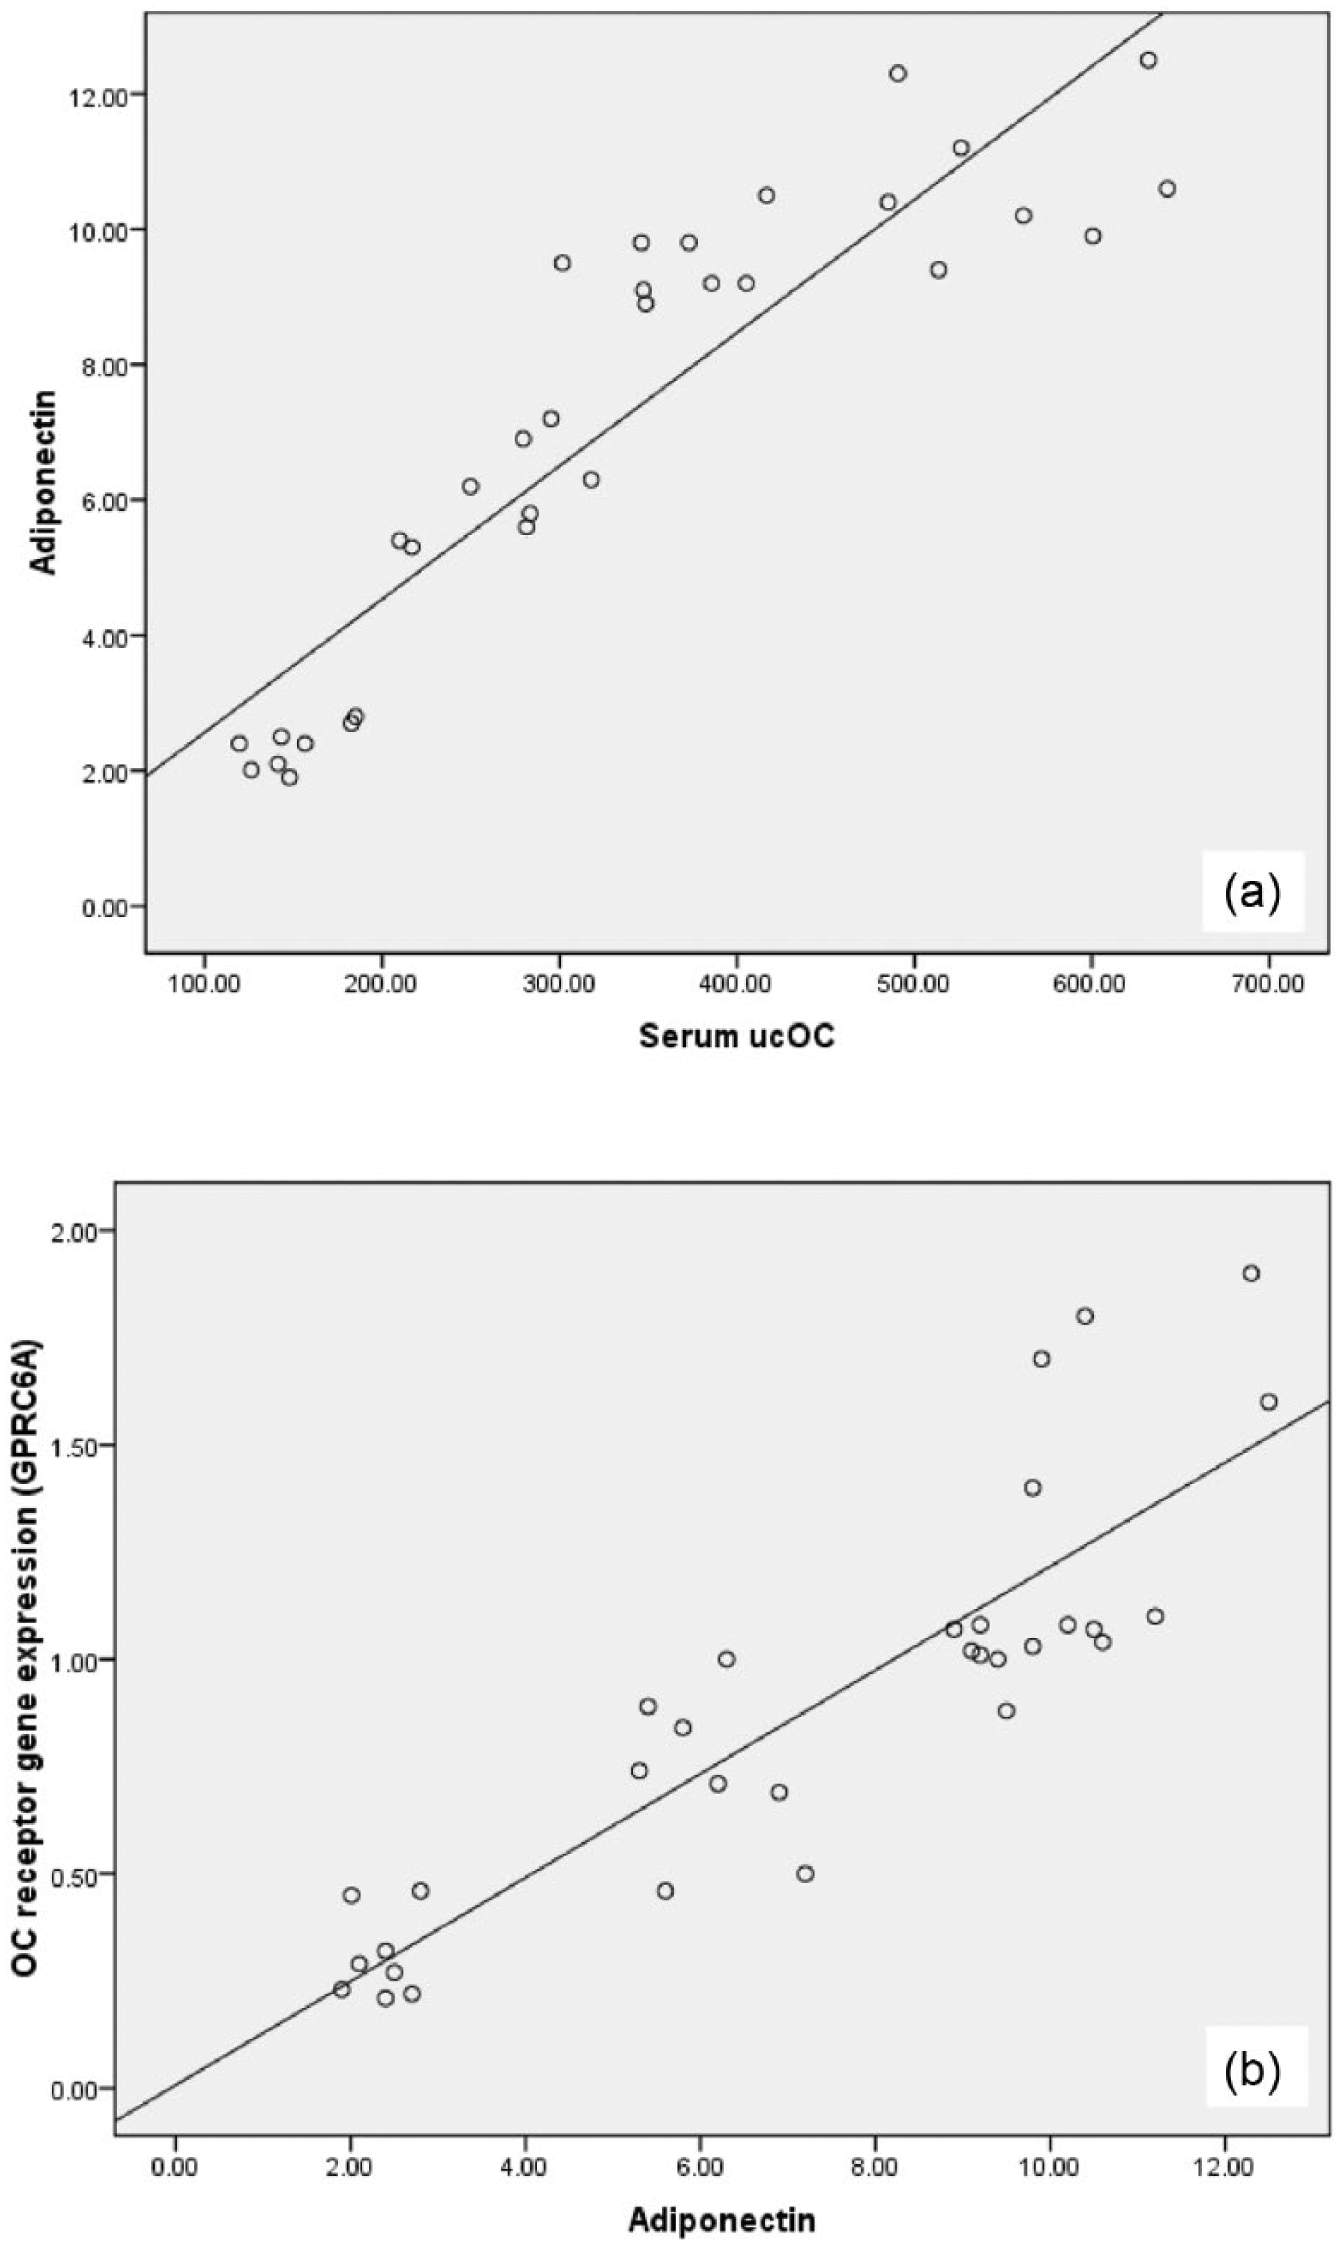
Correlation (a) between serum ucOC and serum adiponectin and (b) between serum adiponectin level and OC receptor (GPRC6A) gene expression in cardiac tissue among the studied groups.
The results of MDA content, acyl-CoA dehydrogenase gene expression and SERCA gene expression in cardiac tissue
As observed in Figure 4(a) and (b), MDA content and acyl-CoA dehydrogenase gene expression in cardiac tissues of diabetic group were significantly increased compared to the control group (p < 0.05), thus indicating oxidative stress and increased FA β-oxidation enzymes, respectively, both contributing to the development of DCM. In diabetic warfarin–treated group, the elevated serum ucOC was associated with partial preservation of MDA content and acyl-CoA dehydrogenase gene expression, where both were significantly decreased in comparison with the diabetic group (p < 0.05), but these values were still significantly increased in comparison with the control group (p < 0.05). MDA content and acyl-CoA dehydrogenase gene expression in normal warfarin–treated group showed insignificant differences compared to the control group.
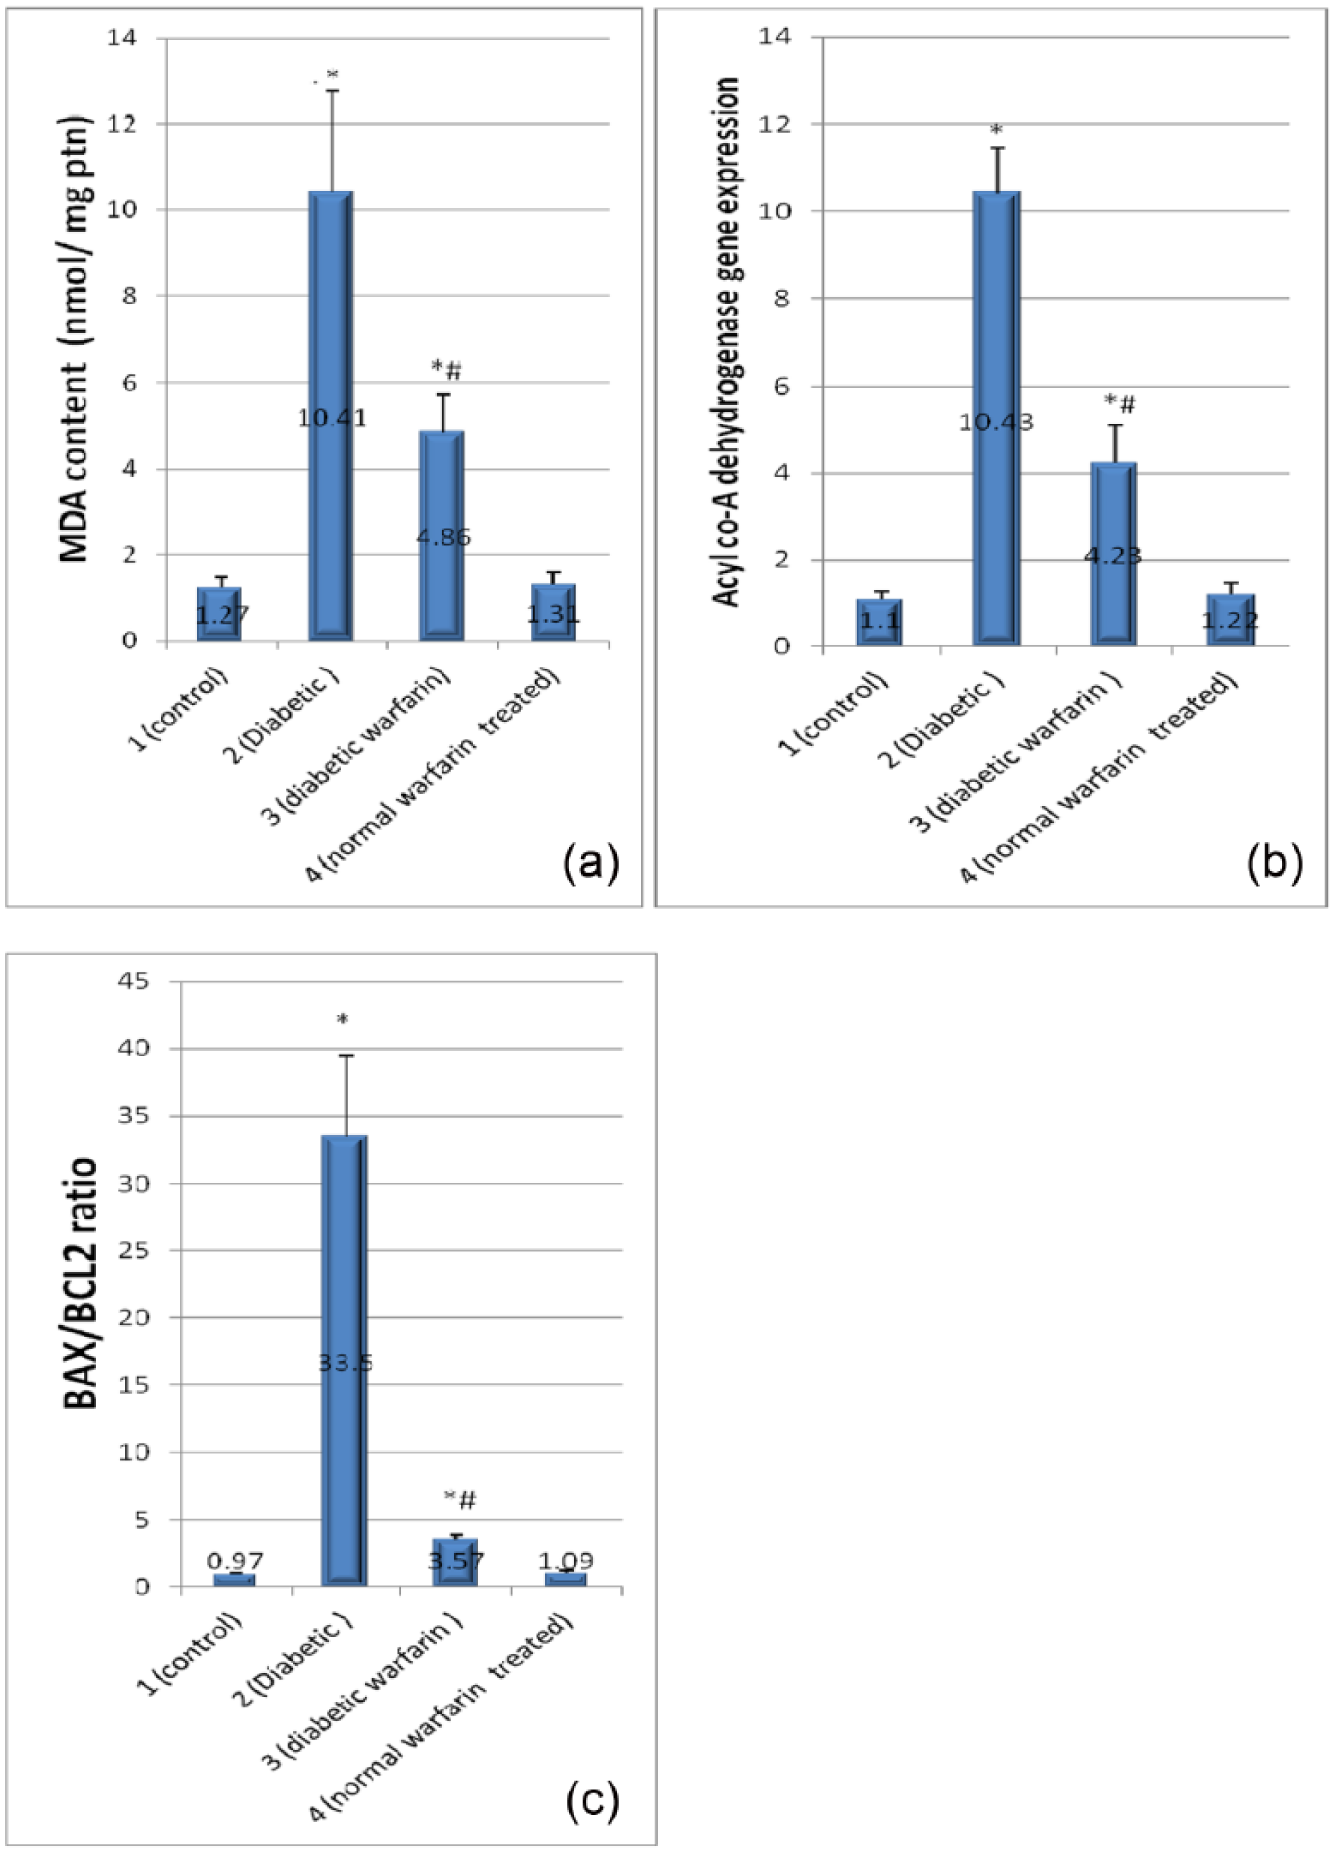
(a) MDA content (nmol/mg ptn), (b) acyl-CoA dehydrogenase gene expression and (c) Bax/Bcl2 ratio in the studied groups. Each vertical bar represents the mean of 8 animals ± SD.
Figure 5 showed significant decrease in SERCA gene expression in diabetic group compared to the control group (p < 0.05). After warfarin prophylaxis in group (3), its value is significantly increased compared to the diabetic group (2) but still significantly decreased compared to the control group (p < 0.05).
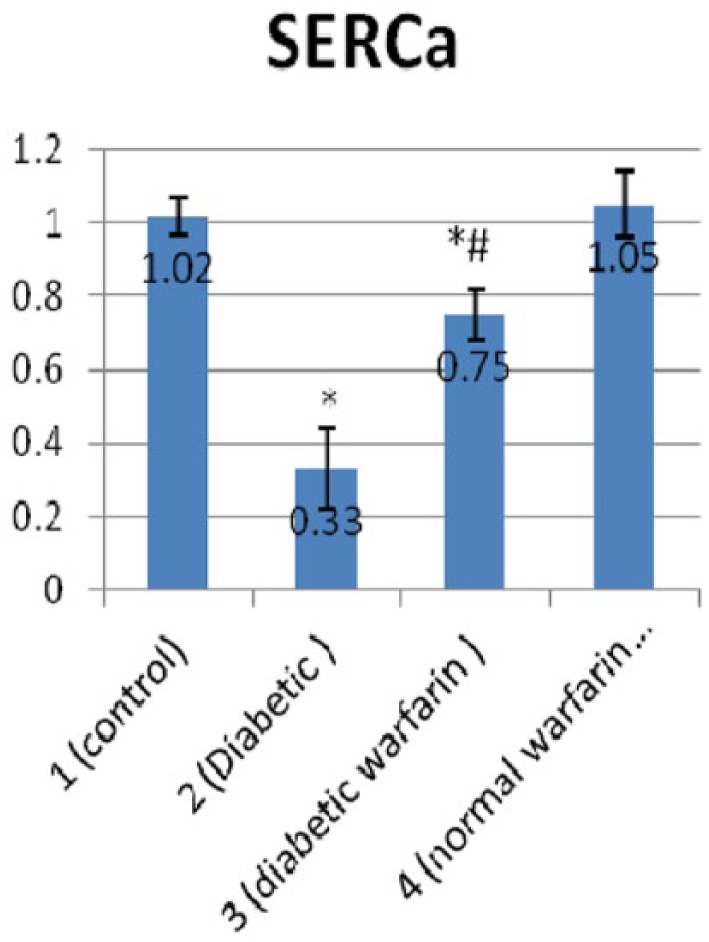
SERCA gene expression in the studied groups. Each vertical bar represents the mean of 8 animals ± SD.
The changes in Bax/Bcl2 ratio
Diabetic group (2) showed significantly increased Bax/Bcl2 ratio, compared to the control group (Figure 4(c)) (p < 0.05) indicating stimulated apoptotic cascades in diabetic myocardium, while diabetic warfarin–treated group was protected against such changes. Diabetic warfarin–treated group showed significantly decreased Bax/Bcl2 ratio in comparison with the diabetic group (2) (p < 0.05), and at the same time, that ratio was of no significant difference compared to the control group. Bax/Bcl2 ratio in normal warfarin–treated group showed insignificant difference compared to the control group.
The results of cardiac function: LVDP, ΔP/ΔT and −ΔP/ΔT
As shown in Table 2 and Figure 6, the assessment of LV function proved the development of DCM in diabetic group (2) as LVDP, ΔP/ΔT and −ΔP/ΔT showed significant decrease compared to the control group (p < 0.05). Systolic function affection proved by declined LVDP and ΔP/ΔT indicates a late stage of the disease. On the other hand, parenteral warfarin and consequently increased ucOC in diabetic warfarin–treated group resulted in partial protection of diabetic myocardium against marked decline of function. A significant increase in LVDP, ΔP/ΔT and −ΔP/ΔT was observed in diabetic warfarin–treated group, compared to the diabetic group (p < 0.05). Although −ΔP/ΔT in diabetic warfarin–treated group showed no statistically significant difference compared to the control group, LVDP and ΔP/ΔT were still significantly decreased in comparison with the control group (p < 0.05). Normal warfarin–treated group showed insignificant change in LVDP, ΔP/ΔT and −ΔP/ΔT, compared to the control group. It was also revealed that serum ucOC was positively correlated with cardiac function (Figures 7 and 8).
Measurement of LVDP, ΔP/ΔT and −ΔP/ΔT in the studied groups.
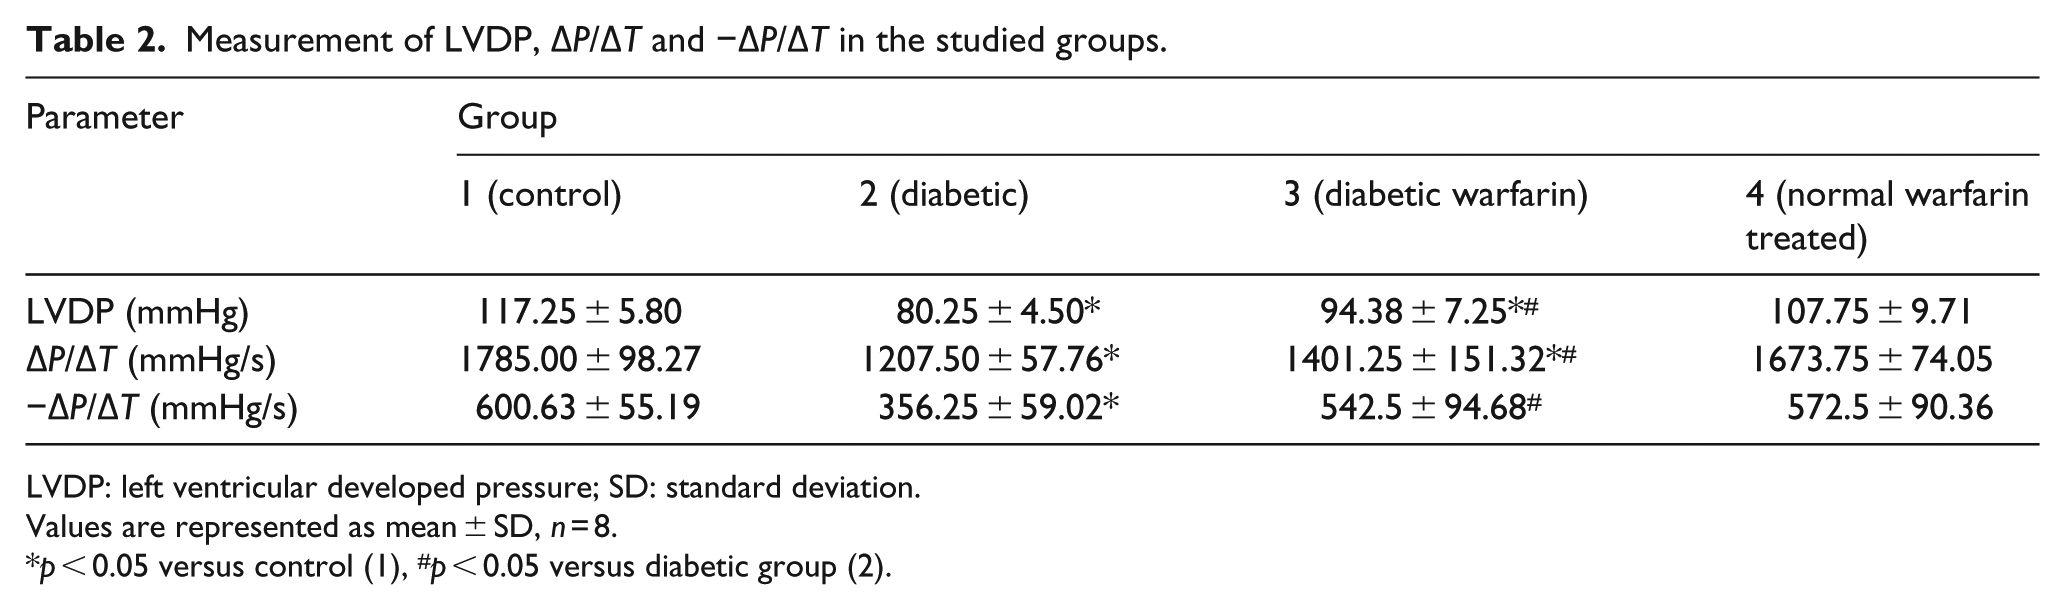
LVDP: left ventricular developed pressure; SD: standard deviation.
Values are represented as mean ± SD, n = 8.
p < 0.05 versus control (1), #p < 0.05 versus diabetic group (2).
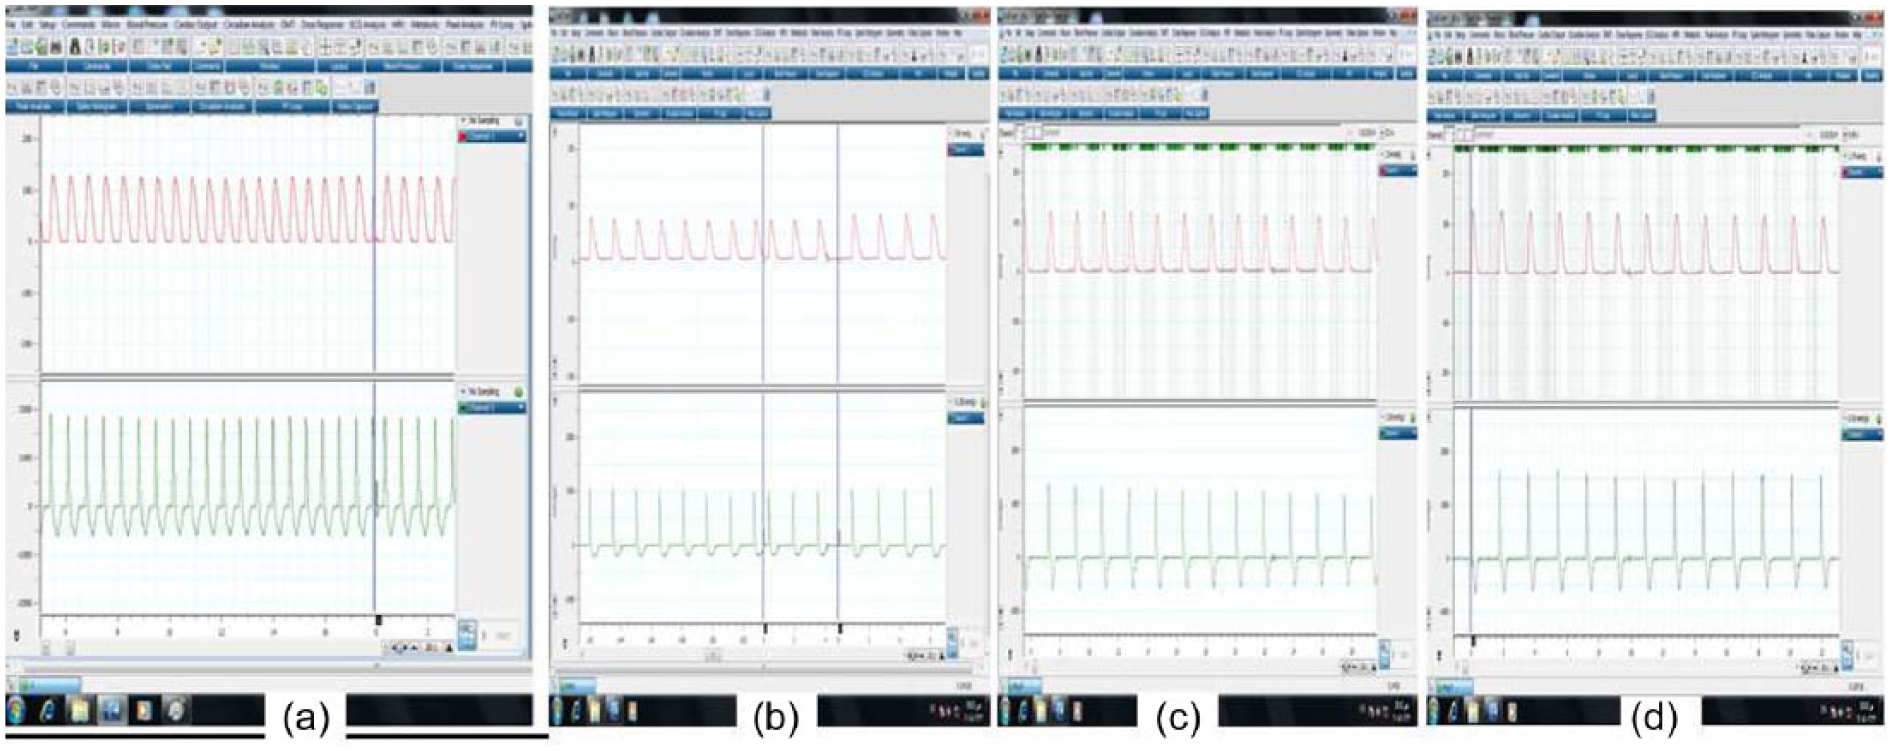
Samples of Powerlab recordings: (a) a rat from normal control group (1), (b) diabetic group (2), (c) diabetic warfarin group (3) and (d) normal warfarin–treated group (4). The upper channel is the recording of intraventricular pressure. The lower channel shows the positive and negative rates of change per unit time (ΔP/ΔT).
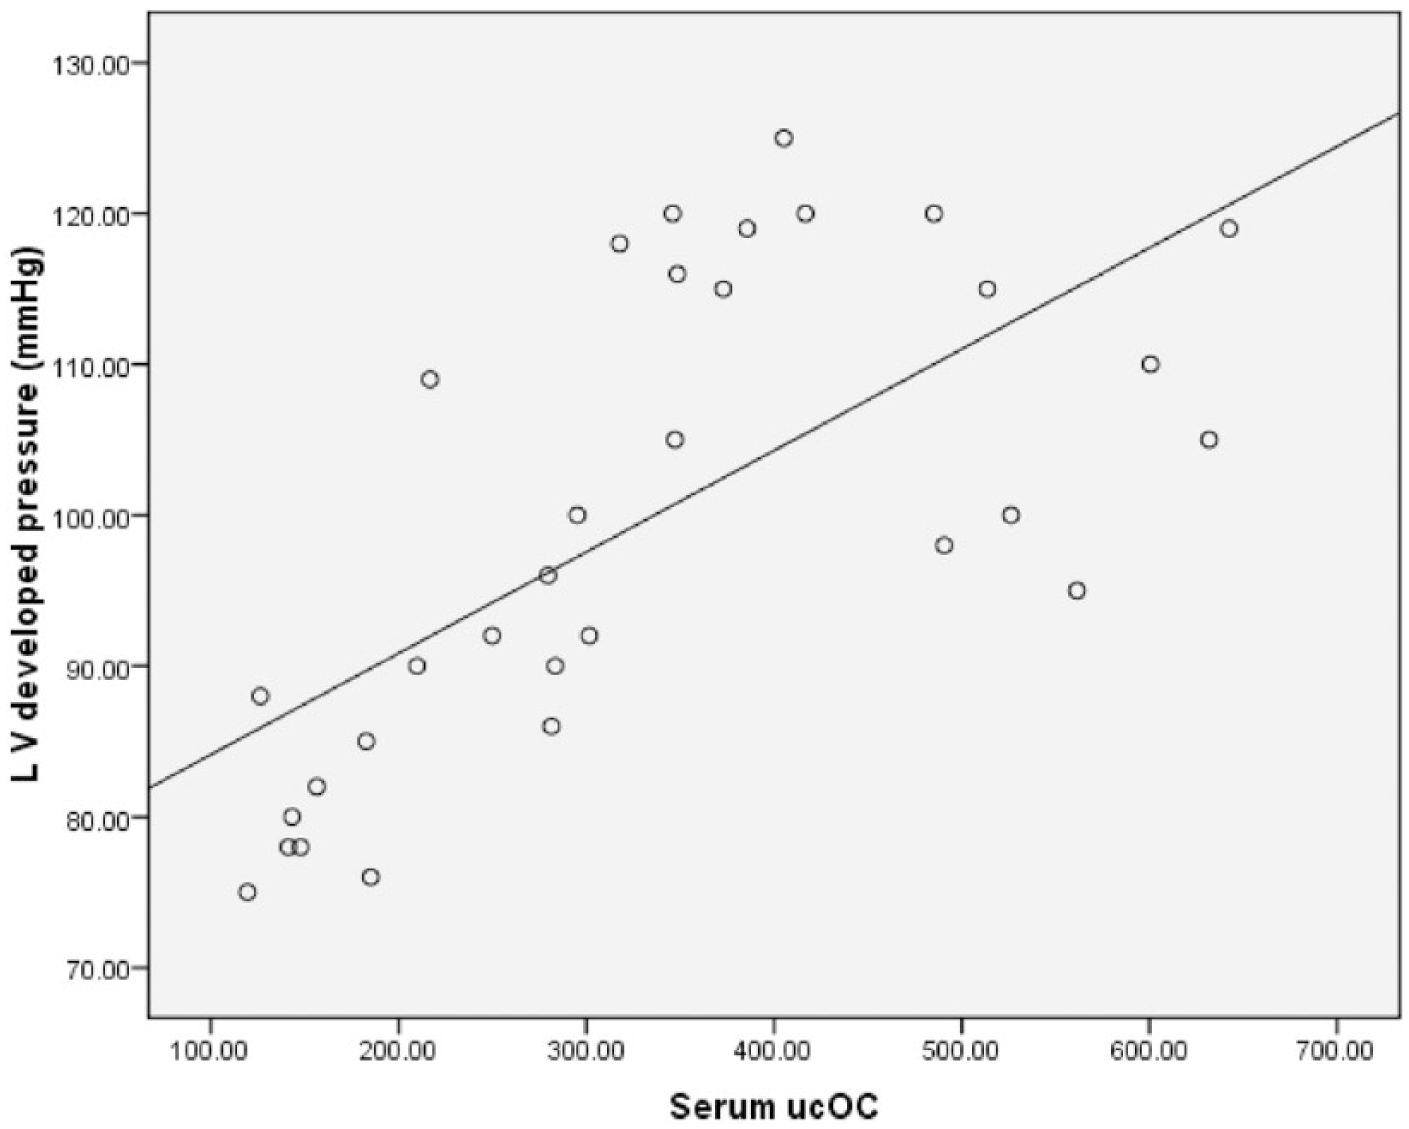
Correlation between serum ucOC and LVDP (mmHg) among the studied groups.
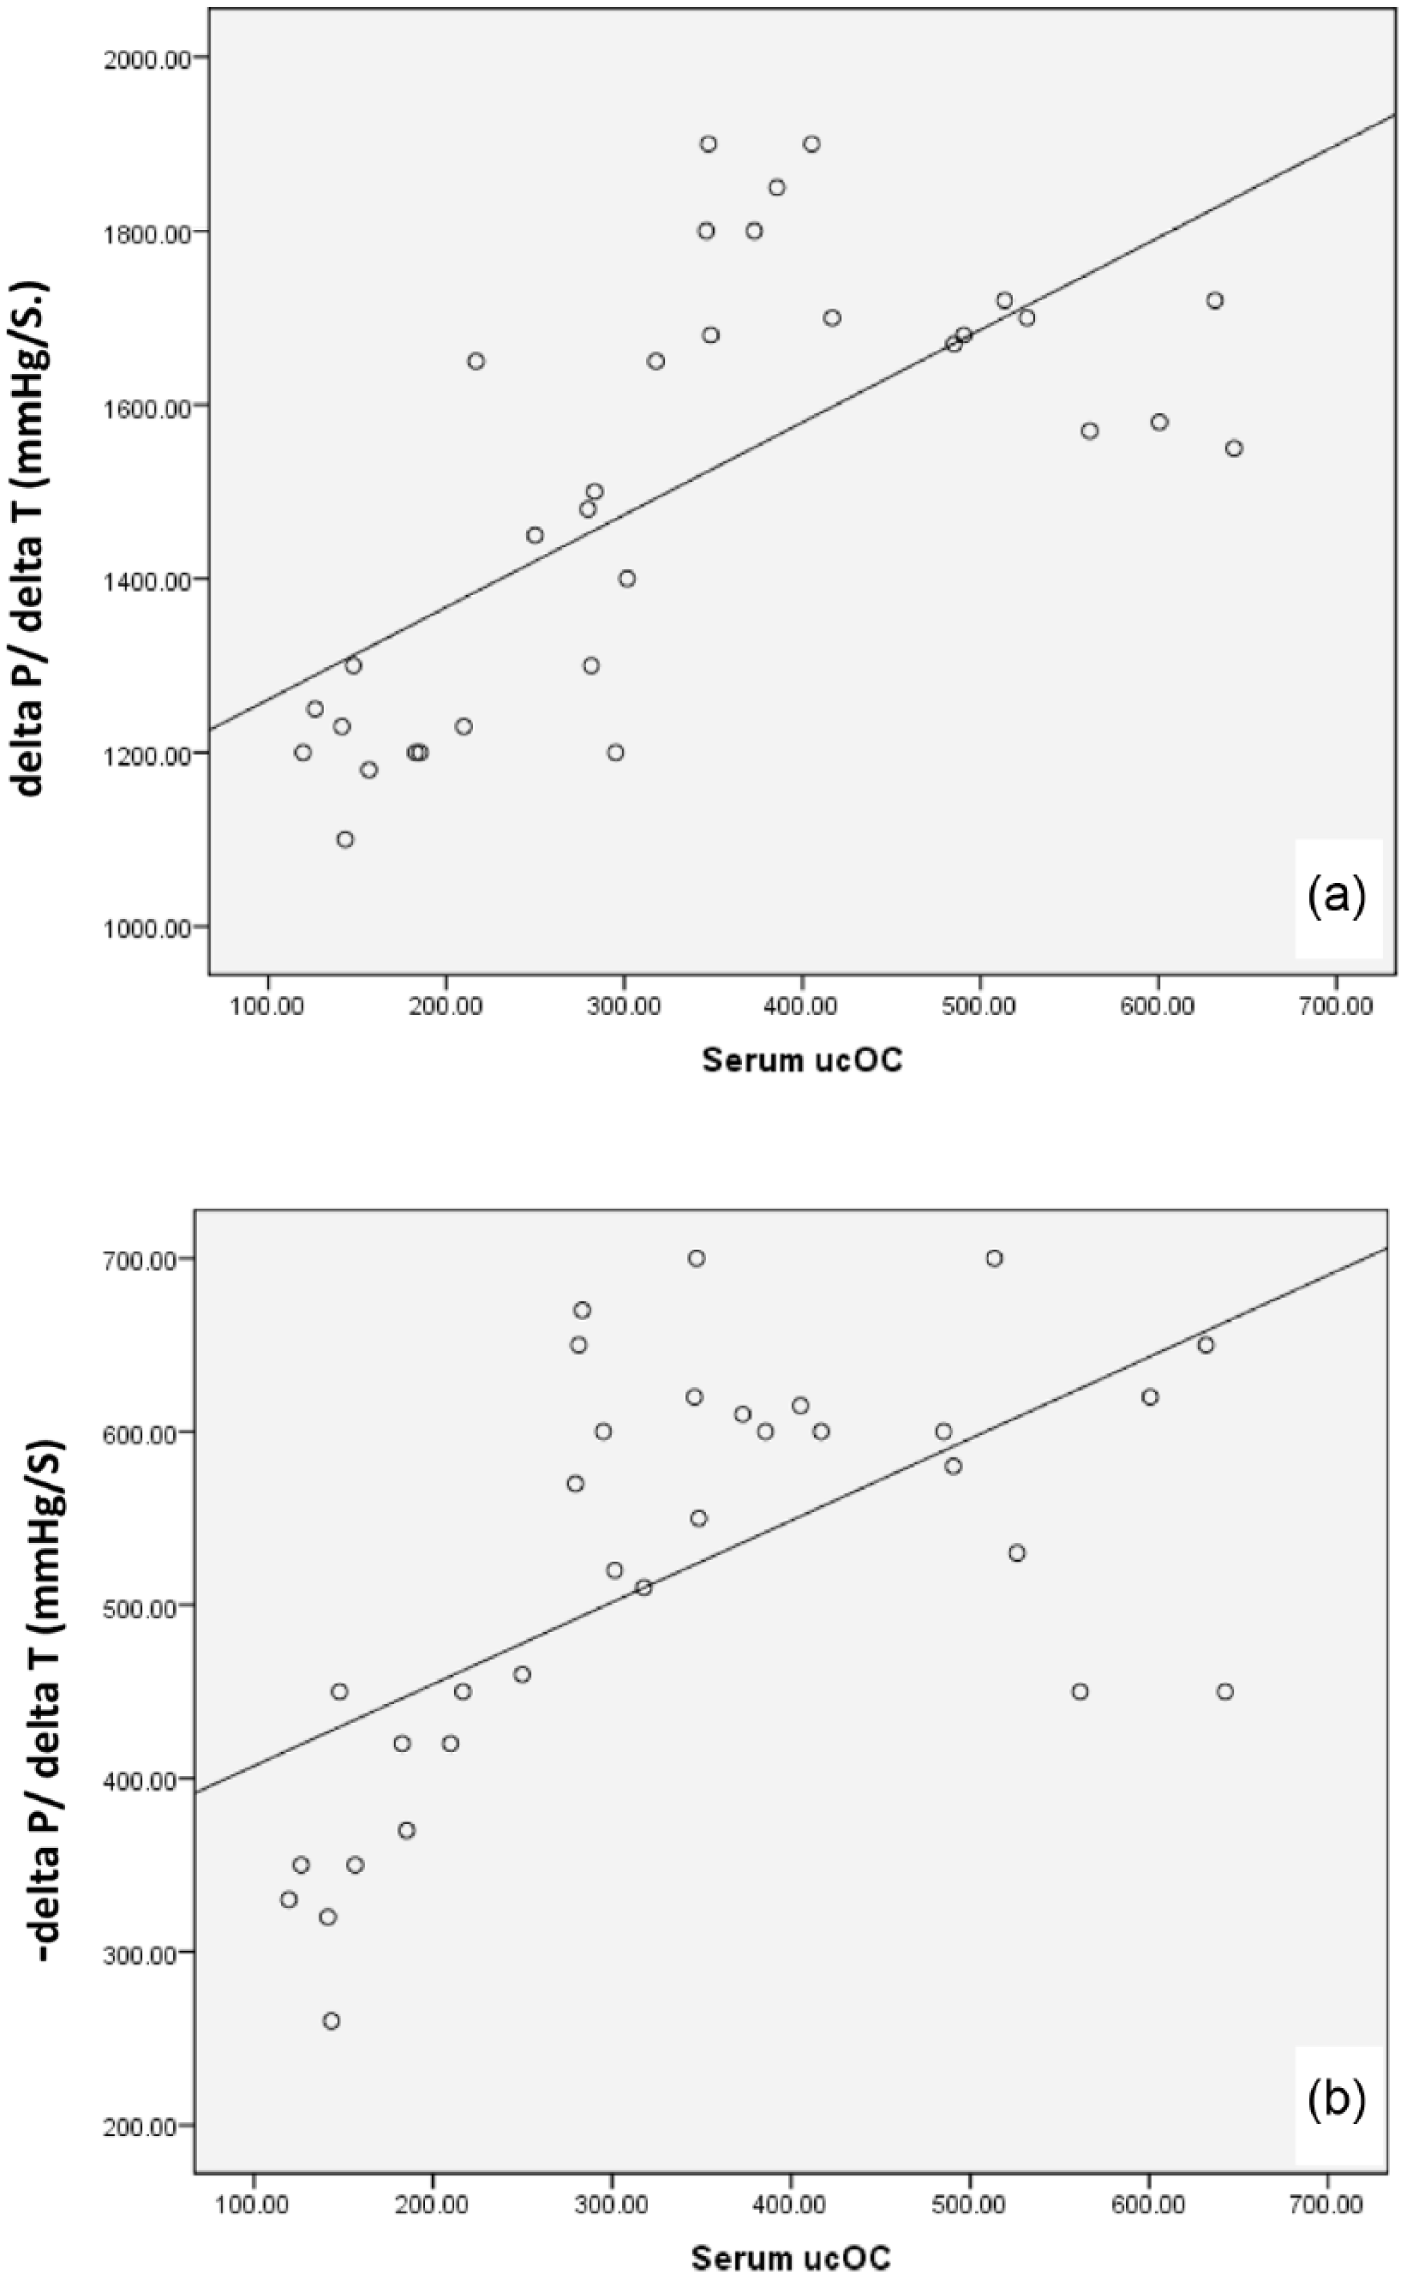
Correlation between (a) serum ucOC and ΔP/ΔT (mmHg/s) and (b) serum ucOC and −ΔP/ΔT (mmHg/s) among the studied groups.
Discussion
Sustained DM leads to deterioration of cardiac function independently of the known concomitant risk factors frequently seen in DM patients. This deterioration is referred to as DCM. 19 This study was designed to investigate the possible protective effect of ucOC on DCM and explore its effect on the involved risk factors and mechanisms.
The development and persistence of type II diabetic status were proved in this study by the significant elevation of fasting serum glucose, glycosylated haemoglobin and HOMA-IR, as well as the significant decrease in serum insulin in diabetic group (2) relative to control group. Lipid profile represents dyslipidaemia, a risk for the development of cardiovascular complications. These results were associated with significant decrease in serum ucOC and adiponectin levels in the diabetic group compared to the control group.
Ferron et al. reported a positive feedback mechanism between pancreatic beta cells, adipose tissue and bone, where insulin enhances ucOC production, which in turn enhances insulin production and sensitivity. They found that OC gain-of-function mouse model exhibits greater insulin sensitivity, and increased secretion of adiponectin. This supports the findings of this study where decreased insulin in type II DM was associated with decreased serum ucOC and adiponectin. 20
In this study, LVDP, ΔP/ΔT and −ΔP/ΔT were significantly lower in the diabetic group, compared to the control group, which proved the development of DCM with deterioration of both systolic and diastolic functions, after 8 weeks of DM induction, indicating a late stage of DCM.
It was reported from previous studies that LV diastolic dysfunction is the earliest detectable functional defect in DCM as diabetes affects diastolic function before systolic function, followed by progressive systolic dysfunction later in DCM.3,21
The results of echocardiography and hemodynamic measurements in Zhao et al. study indicated that myocardial performance was depressed at the eighth week of diabetes, as determined by significant reductions in dP/dtmax. This was correlated with decline in Ca2+ spark frequency. 22
Scognamiglio et al. 23 noticed a decrease in contractile proteins in association with shifts in myosin heavy chain isoforms, contributing to decreased systolic tension in diabetic heart. In this study, DCM was further evidenced by investigating the possibly involved cellular mechanisms.
Acyl-CoA dehydrogenase was investigated to assess substrate switch. It was significantly higher in the cardiac tissues of diabetic group, in comparison with the control, indicating mitochondrial dysfunction with increased FA β-oxidation enzymes. Increased FA supply and uptake that results in lipid accumulation in diabetic cardiomyocytes was proved to play a role in DCM. 24
Yang et al. detected multiple mechanisms contributing to the substrate switching in diabetic heart. These included increased delivery of FAs, decreased insulin signalling and activation of transcriptional pathways that regulate myocardial substrate use. Genes involved in β-oxidation such as medium- and long-chain acyl-CoA dehydrogenase and hydroxy-acyl-CoA dehydrogenase were upregulated. 25
Serum MDA level was found to increase in type II DM, making it possible to study it as a product of increased ROS at sites of DM complications. MDA promotes the crosslink between nucleic acid, protein and lipid, resulting in mutation, degeneration or even death of cells. 26 In this work, MDA content in the cardiac tissues was significantly higher in the diabetic group than in the control group.
Badole et al. 27 proved a state of oxidant stress in diabetic rat myocardium by increased MDA, decreased superoxide dismutase and glutathione peroxidase activity, and an enhanced activity and expression of inducible nitric oxide synthase (iNOS).
The role of apoptosis in type II DM-induced cardiovascular damage (CVD) was investigated in the study of Latha et al. 28 CVD-induced rats showed increase in the expression of Bax with simultaneous decrease in Bcl2, that is, elevated Bax/Bcl2 ratio, as compared to control rats indicating stimulated apoptotic cascades. This agrees with this work, where cardiac Bax/Bcl2 ratio was significantly higher in the diabetic group than in the control group.
Cardiac expression of SERCA has been reduced significantly in diabetic rats compared to control rats in this study; this finding is in agreement with Lebeche et al. 29 who stated that DCM hearts have reduced levels of SERCA with decreased sarcoplasmic reticulum (SR) calcium sequestration and intracellular calcium overload.
Normal warfarin–treated rats in this work showed significantly elevated serum ucOC and adiponectin relative to control group. Furthermore, diabetic warfarin group showed significantly elevated serum ucOC, adiponectin and cardiac OC receptor (GPRC6A) gene expression relative to diabetic group.
The reported effect of parenteral warfarin on serum glucose, insulin, HOMA-IR and glycosylated haemoglobin in this work is mostly attributed to the fore mentioned elevation of serum ucOC and consequently, serum adiponectin.
Ferron et al. 9 found that daily warfarin sc injection in mice increased the ucOC up to ninefolds measured by ELISA. In another study, ucOC was associated with islet cell proliferation and insulin expression and adiponectin expression in white adipose tissue. 20 In a human study on type II diabetes, an increase in OC levels over a period of 6 months was associated with a decrease in glycosylated haemoglobin and increased glucose tolerance. 30
Parenteral warfarin administration to diabetic rats with increased ucOC was associated with significant improvement in lipid profile relative to untreated rats.
Zhang et al. 8 reported a beneficial effect of ucOC on cardiac health. They concluded a linear relation between serum OC and CHD in humans. They indicated that serum OC was associated with decreased risk of CHD and protective metabolic changes, but their study considered the macrovascular affection of coronaries, not myocardial performance, which is the main concern in this work.
In this study, despite insignificant difference in normal warfarin–treated group compared to the control group, cardiac function assessment showed that diabetic warfarin–treated group was significantly protected against marked diabetic myocardial deterioration. This was presented by significant higher LVDP, ΔP/ΔT and −ΔP/ΔT, in comparison with the diabetic group. These results coincided with elevated ucOC and adiponectin in response to warfarin injection as well.
Effect of parenteral warfarin and the consequently elevated ucOC and adiponectin on the mechanisms underlying DCM were also studied. Acyl-CoA dehydrogenase, MDA and Bax/Bcl2 ratio were significantly lower in the cardiac tissues of diabetic warfarin–treated group, in comparison with the diabetic group. Moreover, the results of Bax/Bcl2 ratio in diabetic warfarin–treated group showed insignificant differences compared to the control group. The abnormal diastolic Ca2+ reuptake indicated by decreased SERCA, further evidenced the occurrence and progression DCM.
These findings suggest that ucOC was supposed to have both direct and indirect actions on the diabetic heart via GPRC6A and adiponectin, respectively, both actions may target mainly the apoptotic pathways, which are involved in almost all chronic diabetic complications. 31
In previous studies, pretreatment with adiponectin showed protective effects on induction of apoptosis by inducing expression of superoxide dismutase, catalase and regulation of Bcl-2 and Bax expression. 32
Interestingly, this work reported a positive correlation between serum ucOC and adiponectin, indicating that adiponectin may play a role in the reported anti-apoptotic effect of elevating ucOC. Another positive correlation between serum adiponectin and cardiac OC receptor (GPRC6A) gene expression was reported, suggesting a positive feedback loop, where ucOC increases serum adiponectin, which may help potentiating the possible direct action of ucOC on the cardiac cells, via stimulating OC receptor gene expression.
Although studies have proved a beneficial effect for adiponectin on cardiovascular health, 33 this is the first study relating ucOC to myocardial protection in diabetes, either through a supposed direct action on the upregulated OC receptor or indirectly through adiponectin.
Conclusion
ucOC was suggested to partially protect diabetic heart from developing DCM. This study supported the role of ucOC in improving insulin secretion and sensitivity as well as ameliorating dyslipidaemia. In addition, ucOC-induced alterations in diabetic myocardium can be attributed to antagonizing oxidative stress and exerting an anti-apoptotic effect, which may be indirectly via adiponectin or directly through the upregulated OC receptor.
Recommendation
This study may open a spectrum for the possibility of therapeutic manipulation of endogenous ucOC or even exogenous ucOC administration to protect against, or improve diabetes and its complications. Further studies are needed to adjust the warfarin dose to gain most benefit from ucOC with minimal effects on coagulation function. More specific methods for elevating ucOC without the side effect of warfarin are needed to be studied. Further studies are also required to know whether it has any synergistic effect with other commonly used hypoglycaemic agents, against diabetic myocardial affection.
Footnotes
Acknowledgements
The authors thank Dr Mohamed Eshra for his excellent statistical work.
Declaration of conflicting interests
The author(s) declared no potential conflicts of interest with respect to the research, authorship and/or publication of this article.
Funding
This research has been partially funded by Cairo University, by providing drugs and some kits for biochemical analysis.